Ichiyoshi Trend Pullback Framework for MT5

5
  • Indicatori
  • Le Quang Thanh
    Le Quang Thanh
    Professional Trading Tools for MetaTrader 5
    I specialize in developing high-quality indicators and Expert Advisors for MetaTrader 5, inspired by well-known trading methodologies used by professional traders and market researchers around the world.
  • Versione: 2.35
  • Aggiornato: 8 giugno 2026
  • Attivazioni: 10

Ichiyoshi Trend Pullback Framework for MT5 — Version 2.3 Holy Grail Inspired Trend-Pullback Indicator

Ichiyoshi Trend Pullback Framework for MT5 — Version 2.3 is a professional trend-pullback indicator created for traders who want to read the market with structure, discipline and context.

The framework is inspired by the practical logic of the well-known Holy Grail trend-pullback approach, widely associated with Linda Raschke’s professional trading philosophy. The idea is simple, but powerful: identify a real trend, wait for a meaningful pullback, confirm the timing, check momentum, respect market context, and only then decide whether the trade is worth the risk.

This is not a random buy/sell arrow indicator. It is designed as a structured decision-support framework for discretionary traders. Its purpose is to help you understand whether a setup is still waiting, building, or close to a higher-quality decision point.


The Holy Grail Mindset

Many traders do not fail because they cannot see price moving. They fail because they enter too early, chase price after it has already moved too far, ignore weak momentum, or trade when the market context is poor.

A professionl trend-pullback trader thinks differently:

Trend first.

Pullback second.

Confirmation third.

Momentum support.

Context awareness.

Risk before execution.

Ichiyoshi Version 2.3 brings this logic into a clear MT5 visual framework. It helps the trader ask the right question: not “Can I enter now?”, but “Is the market giving me enough reason to take this risk?”

Core Components

The indicator combines several important trading layers:
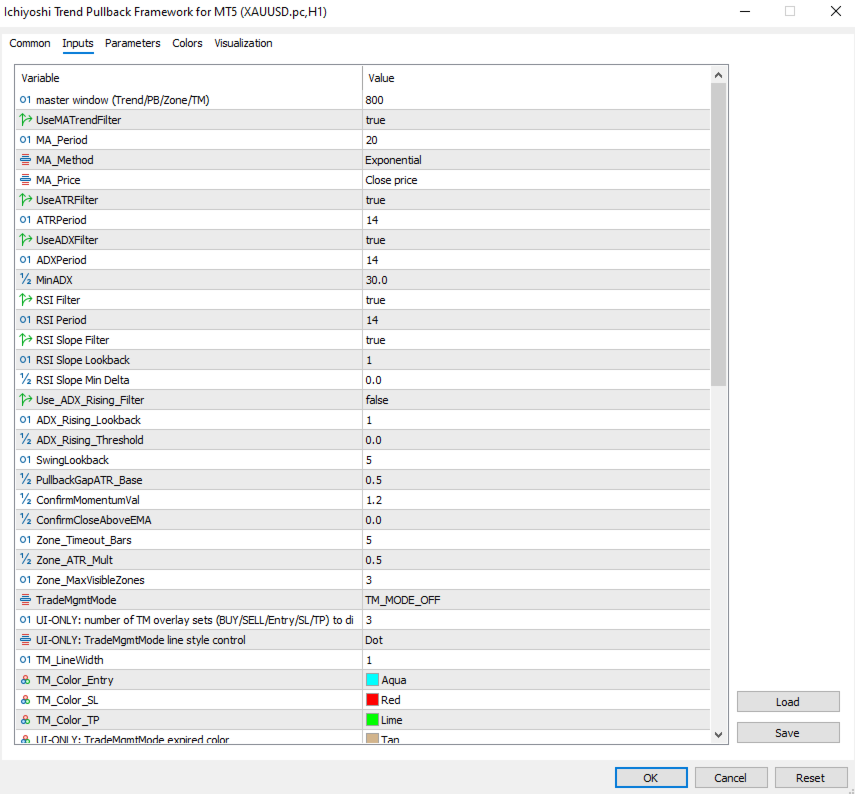
EMA Trend Reference


The EMA trend reference helps identify whether the market is developing in a bullish or bearish structure. It allows traders to focus on organized movement instead of reacting emotionally to every candle.

ADX Trend Strength


ADX helps evaluate whether the trend has enough strength. A market may look directional, but if the strength is weak, it can quickly become noisy or unreliable. ADX helps separate cleaner trend conditions from low-quality movement.

RSI Momentum Filter


RSI is used as a momentum filter, not as a simple overbought or oversold tool. In this framework, RSI helps confirm whether momentum supports the trade direction. For a BUY setup, bullish momentum should support the idea. For a SELL setup, bearish momentum should support it.

Version 2.3 also considers RSI behavior around the 50-line and slope. This makes the reading more practical. RSI_50 can show partial momentum alignment, while RSI_Slope warns that momentum is not fully confirmed yet.

ADX Rising


ADX Rising adds another quality layer by showing whether trend strength is improving. A trend that is gaining strength deserves different attention from a trend that is already fading.

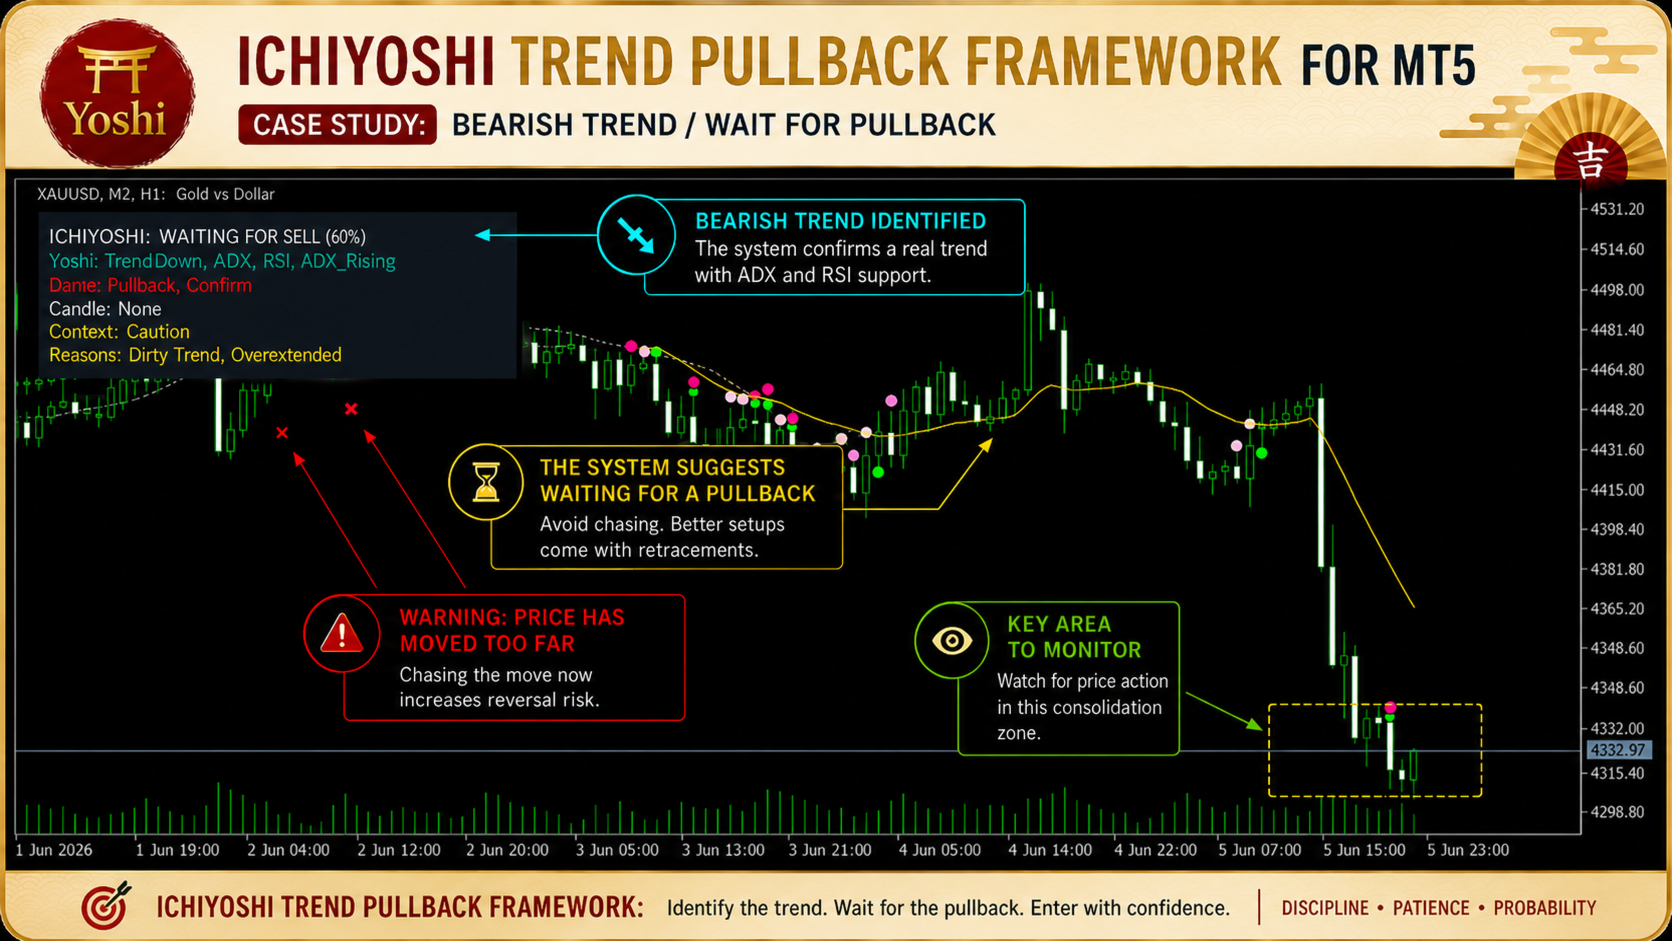
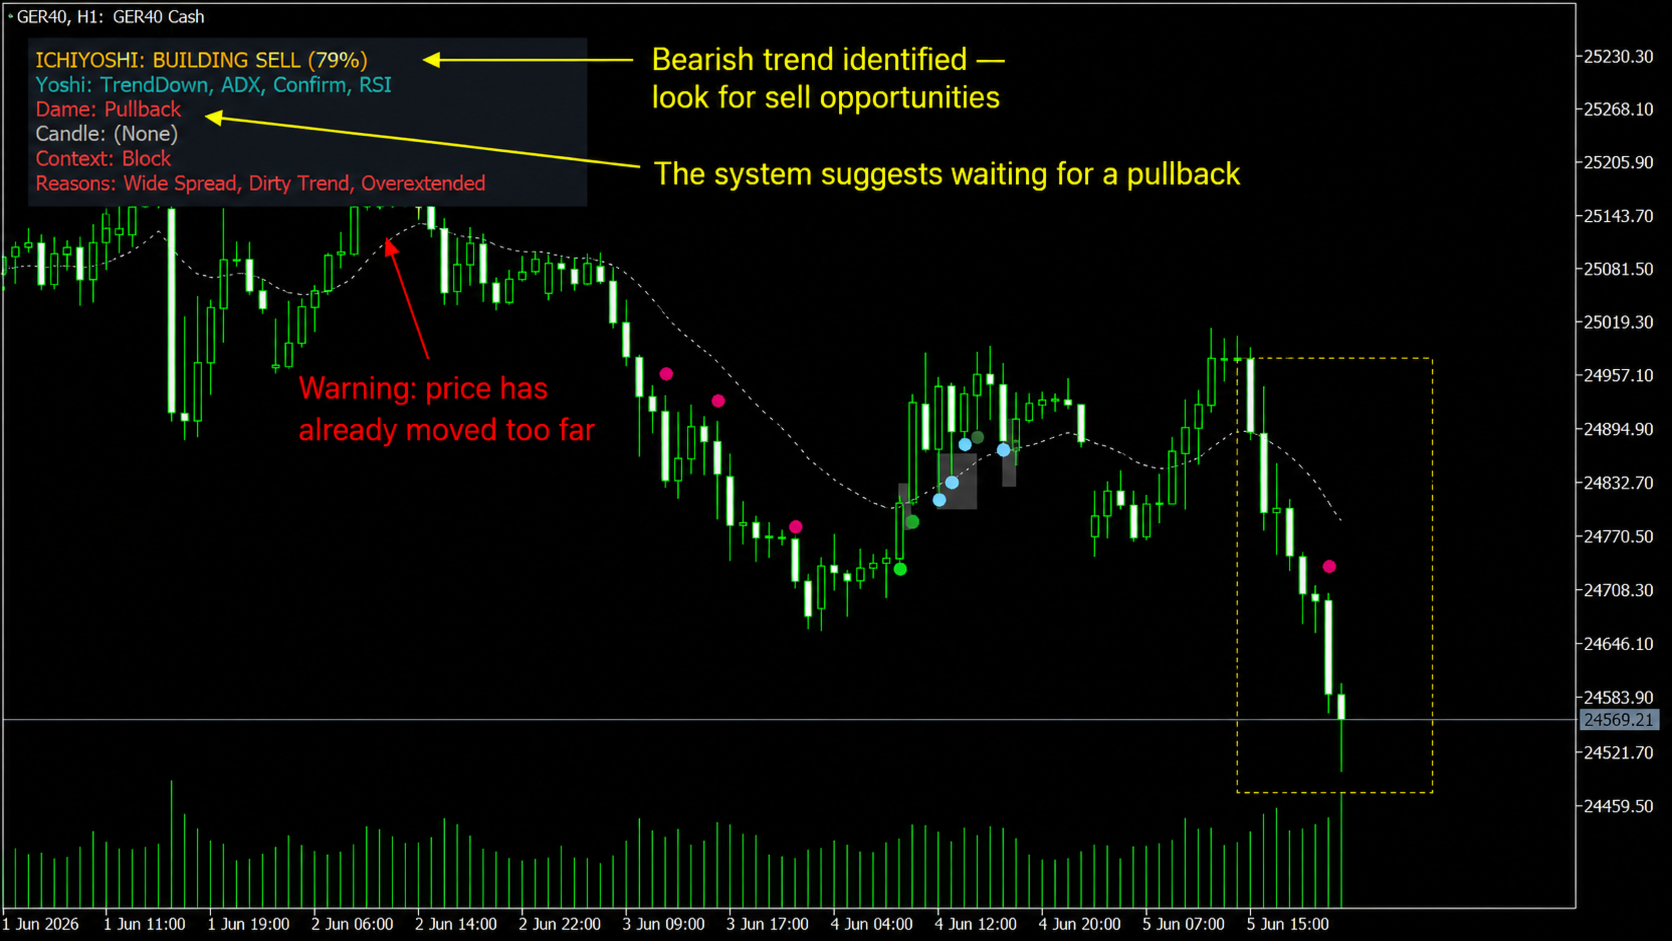
Pullback and Confirmation Logic


A valid trend does not automatically mean a valid entry. One of the most common trading mistakes is chasing price. The Holy Grail approach is built around patience: wait for the pullback, then look for confirmation.

Ichiyoshi helps highlight whether the pullback is present, whether confirmation is strong enough, or whether the setup is still incomplete. WeakConfirm is treated as partial evidence, not full confirmation. This helps avoid false confidence.

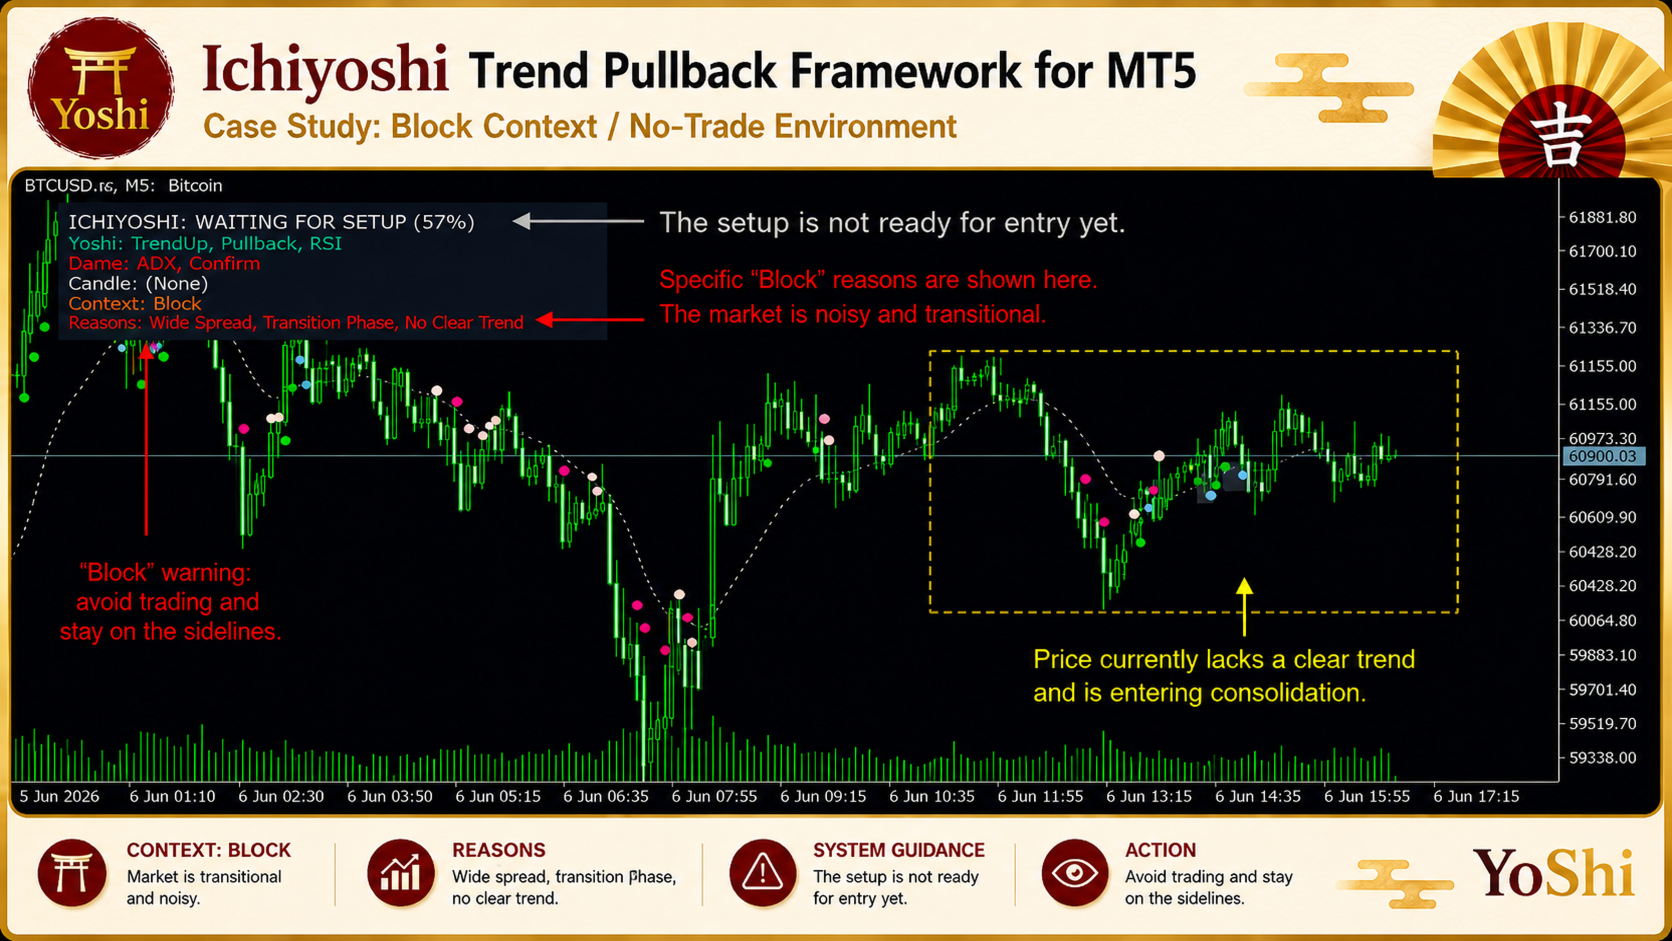
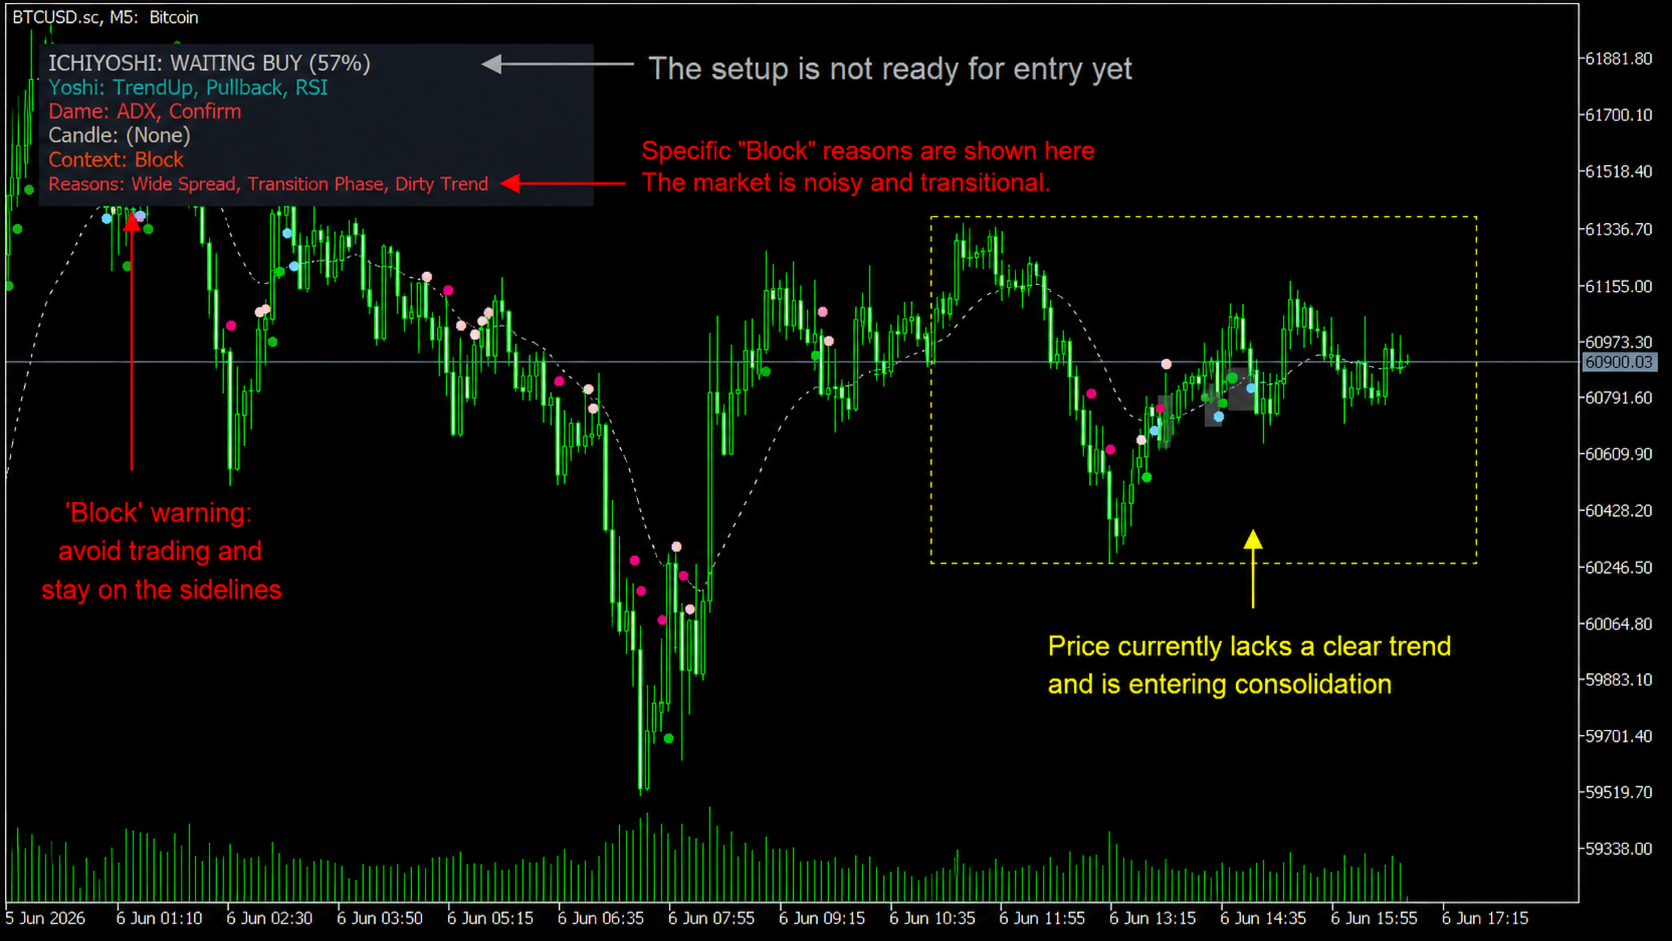
Candle, Context and Reasons


The Candle line adds price-action awareness. The Context line shows whether the market environment is Allow, Caution, or Block. The Reasons line explains why.

Examples include:


Wide Spread

Dirty Trend

Transition Phase

Overextended

Weak Signal

Choppy Market

This is one of the most practical strengths of the indicator. It does not only show signals. It also explains when the market may be too noisy, too extended, or not worth trading.

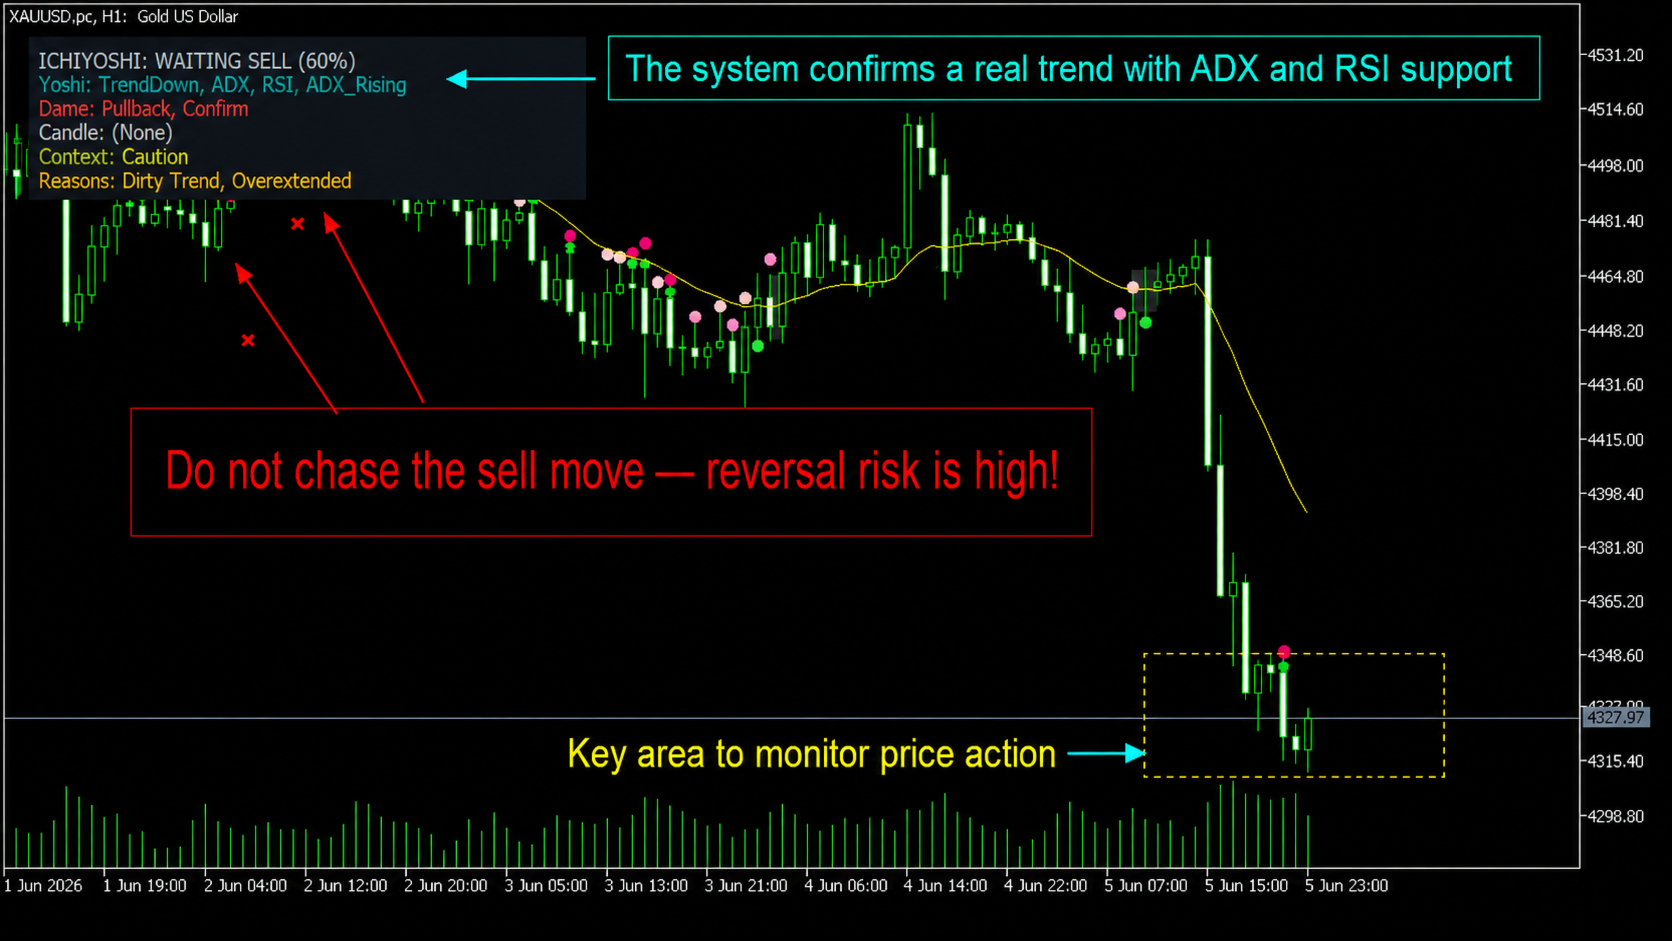
The 6-Line Dashboard


The 6-line dashboard is the core of Ichiyoshi Version 2.3. It gives traders a fast but structured view of the setup.

1. ICHIYOSHI


This is the main status line.

WAITING means the setup is not ready.

BUILDING means the setup is forming.

READY means the technical checklist has reached the strongest state according to the framework.

READY is not a guarantee and not a command to trade. It means the trader should now review risk, spread, session, volatility and personal trading rules.

2. Yoshi


Yoshi shows what is currently supporting the setup.

Example:

TrendDown, ADX, RSI, ADX_Rising

This tells the trader which conditions are already aligned.

3. Dame


Dame shows what is still missing.

Example:

Pullback, Confirm, RSI_Slope

This is extremely valuable because many traders only look for reasons to enter. Dame forces discipline. It shows why the setup may not yet be ready.

4. Candle


Candle gives price-action context and helps the trader understand whether the current candle behavior supports the setup.

5. Context


Context shows the broader market condition: Allow, Caution, or Block.

Sometimes the best decision is not to trade. A Block condition can help the trader avoid poor environments.

6. Reasons


Reasons explains the Context line. Instead of giving a vague warning, the framework tells the trader what is wrong: wide spread, dirty trend, transition phase, overextension or weak signal.

Weighted Scoring

Version 2.3 uses a refined scoring model. Not every condition has the same practical value. Trend, ADX, Pullback, Confirm, RSI and ADX Rising are weighted to reflect setup quality more realistically.

The score is not a win-rate prediction. It is a readiness score. It shows how complete the setup is according to the framework.

A setup with trend, ADX, pullback, confirmation, RSI support and rising strength is very different from a setup with only trend and momentum but no pullback or confirmation. The scoring model helps traders see that difference quickly.

Chart Signals and Visual Guidance

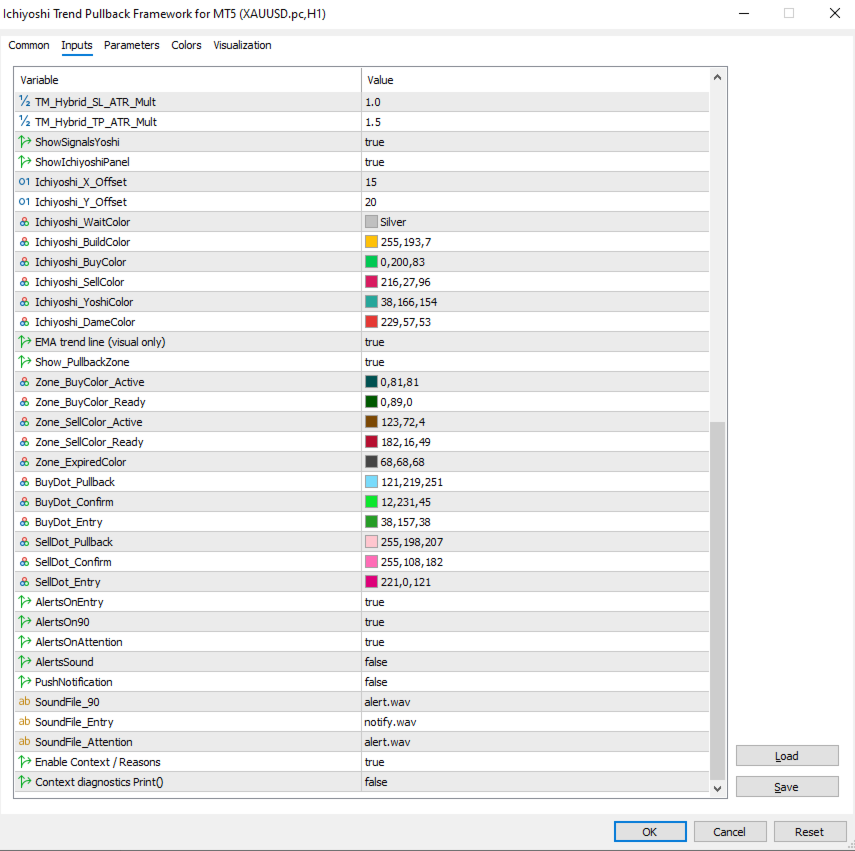
Ichiyoshi can display pullback dots, confirmation signals, entry-ready states, ADX Rising markers, observation zones and trade management references.

A dot is not a blind entry command. It represents a state in the setup-development process. The real value comes from reading the dot together with the dashboard, context, reasons and chart structure.

The observation zone helps traders focus on areas where price action should be monitored instead of chasing the market emotionally.

For New and Experienced Traders

For newer traders, Ichiyoshi provides structure and reduces confusion. Instead of guessing, the trader can read the dashboard and ask:

Is the trend clear?

Is ADX supporting the move?

Is RSI aligned?

Is the pullback valid?

Is confirmation present?

Is the market context safe?

What is still missing?

For experienced traders, the indicator can work as a professional confirmation layer. It can support price action, market structure, session analysis, ORB logic or an existing discretionary strategy.

It does not force one trading style. It organizes the decision process.

Used with ORB Trading

Trend-pullback logic and Opening Range Breakout logic can complement each other well. ORB can help identify early directional expansion, while Ichiyoshi helps evaluate continuation quality after the move begins.

For traders interested in a professional ORB framework, you may also review:

https://www.mql5.com/en/market/product/179631?source=Site+Profile+Seller

Together, ORB structure and Ichiyoshi trend-pullback confirmation may help traders build a more complete workflow.

Trading Mindset

Ichiyoshi is built around a practical professional mindset:

Do not trade every move.

Do not chase price.

Do not ignore missing conditions.

Do not ignore market context.

Wait for structure.

Wait for confirmation.

Respect momentum.

Protect capital.

This is the spirit of Holy Grail trend-pullback trading. The trader is not looking for excitement. The trader is looking for a clean opportunity.

Important Risk Notice

No indicator can guarantee profits. No trading framework can remove uncertainty from the market. Past examples do not guarantee future results.

Ichiyoshi Trend Pullback Framework for MT5 is designed to support analysis, structure and discipline. The final trading decision always belongs to the trader.

Conclusion

Ichiyoshi Trend Pullback Framework for MT5 — Version 2.3 is a structured Holy Grail inspired trend-pullback decision framework.

By combining EMA trend reference, ADX strength, RSI momentum, pullback detection, confirmation, candle behavior, context, reasons, alerts, observation zones and a powerful 6-line dashboard, it helps traders read the market with more clarity and discipline.

Its strength is not in replacing the trader. Its strength is in helping the trader think more professionally: identify the trend, wait for the pullback, confirm momentum, respect context, manage risk and decide with discipline.


Recensioni 1
Irfan
1632
Irfan 2026.06.05 09:14 
 

This indicator teaches you discipline and when not to enter a trade. The developer is a very nice person and answers your queries in details.

Prodotti consigliati
Follow The Line MT5
Oliver Gideon Amofa Appiah
4.6 (35)
This indicator obeys the popular maxim that: "THE TREND IS YOUR FRIEND" It paints a GREEN line for BUY and also paints a RED line for SELL. (you can change the colors). It gives alarms and alerts of all kinds. IT DOES NOT REPAINT and can be used for all currency pairs and timeframes. Yes, as easy and simple as that. Even a newbie can use it to make great and reliable trades. NB: For best results, get my other premium indicators for more powerful and reliable signals. Get them here: https://www.m
FREE
SPECIAL LAUNCH OFFER: $30 (1-Month Rent) Limited time offer to build our community and gather feedback! AmbM GOLD Institutional Scalper A high-precision M5 algorithm for XAUUSD (Gold) , engineered to trade exclusively at Institutional Liquidity Levels ($5/$10 psychological marks). PERFORMANCE DATA (BUY ONLY) • Win Rate: 87.09%. • Safe Growth: +$4,113 profit on $10k (13.75% Max Drawdown). • Extreme Stress Test: Successfully generated +$22,997 in a 5-year stress test (2020-2026), proving
Donchian Breakout And Rsi
Mattia Impicciatore
4.5 (2)
Descrizione generale Questo indicatore è una versione avanzata del classico Donchian Channel , arricchita con funzioni operative per il trading reale. Oltre alle tre linee tipiche (massimo, minimo e linea centrale), il sistema rileva i breakout e li segnala graficamente con frecce sul grafico, mostrando solo la linea opposta alla direzione del trend per semplificare la lettura. L’indicatore include: Segnali visivi : frecce colorate al breakout Notifiche automatiche : popup, push e email Filtro R
FREE
PROMETHEUS TECHNICAN VERSION Free | By THE SONS A gift from The Sons — no strings, no trial, no expiry. Every trader deserves access to professional-grade market intelligence. That belief is why Prometheus Technical Version exists, and why it costs nothing. Consider it our handshake to the trading community. What You're Getting This is not a simplified tool dressed up as a gift. Prometheus Technican Version is a fully built, institutional-quality technical analysis indicator running a dual-model
FREE
High Low Open Close
Alexandre Borela
4.98 (44)
Se ti piace questo progetto, lascia una recensione a 5 stelle. Questo indicatore disegna i prezzi aperti, alti, bassi e di chiusura per i specificati periodo e può essere regolato per un determinato fuso orario. Questi sono livelli importanti guardati da molti istituzionali e professionali commercianti e può essere utile per voi per conoscere i luoghi dove potrebbero essere più attivo. I periodi disponibili sono: Giorno precedente. Settimana precedente. Mese precedente. Precedente trimestre. A
FREE
RBreaker
Zhong Long Wu
RBreaker Gold Indicators is a short-term intraday trading strategy for gold futures that combines trend following and intraday reversal approaches. It not only captures profits during trending markets but also enables timely profit-taking and counter-trend trading during market reversals. This strategy has been ranked among the top ten most profitable trading strategies by the American magazine   Futures Truth   for 15 consecutive years. It boasts a long lifecycle and remains widely used and st
Caicai L&S Yield Histogram Important Notice: This indicator is an integral tool of the automated EA Caicai Long and Short Pair Trading . This indicator visually displays the percentage deviation (Yield %) of a pair's current spread relative to its own historical mean. It is an excellent tool for quickly visualizing the gross financial potential of a market distortion in Long & Short operations. Main Features: Percentage Visualization: Understand the size of the distortion in palpable percentage
Value Chart Candlesticks
Flavio Javier Jarabeck
4.57 (14)
The idea of a Value Chart indicator was presented in the very good book I read back in 2020 , " Dynamic Trading Indicators: Winning with Value Charts and Price Action Profile ", from the authors Mark Helweg and David Stendahl. The idea is simple and the result is pure genius: Present candlestick Price analysis in a detrended way! HOW TO READ THIS INDICATOR Look for Overbought and Oversold levels. Of course, you will need to test the settings a lot to find the "correct" one for your approach. It
FREE
Moving line
Jun Chao Jiang
The one minute chart has a bug, but the one-day chart can still be used after deleting the bug and reloading the indicators, This indicator can be used to determine how far the indicator goes up to place an order to buy, how far it goes down to place an order to sell, and not placing an order until it reaches this distance, which is considered oscillation, open an account gift index
FREE
Are you tired of drawing trendlines every time you're analyzing charts? Or perhaps you would like more consistency in your technical analysis. Then this is for you. This indicator will draw trend lines automatically when dropped on a chart. How it works Works similar to standard deviation channel found on mt4 and mt5. It has 2 parameters: 1. Starting Bar 2. Number of bars for calculation The   starting bar   is the bar which drawing of the trend lines will begin, while the   number of bars for c
FREE
FlatBreakout MT5
Aleksei Vorontsov
3 (1)
FlatBreakout MT5 (Free Version) Flat Range Detector and Breakout Panel for MT5 — GBPUSD Only FlatBreakout MT5   is the free version of the professional FlatBreakoutPro MT5 indicator, specially designed for flat (range) detection and breakout signals on the   GBPUSD   pair only. Perfect for traders who want to experience the unique fractal logic of FlatBreakout MT5 and test breakout signals on a live market without limitations. Who Is This Product For? For traders who prefer to trade breakout of
FREE
Free automatic Fibonacci is an indicator that automatically plots a Fibonacci retracement based on the number of bars you select on the BarsToScan setting in the indicator. The Fibonacci is automatically updated in real time as new highest and lowest values appears amongst the selected bars. You can select which level values to be displayed in the indicator settings. You can also select the color of the levels thus enabling the trader to be able to attach the indicator several times with differe
FREE
Girassol Sunflower MT5 Indicator
Saullo De Oliveira Pacheco
3.86 (7)
This is the famous Sunflower indicator for Metatrader5. This indicator marks possible tops and bottoms on price charts. The indicator identifies tops and bottoms in the asset's price history, keep in mind that the current sunflower of the last candle repaints, as it is not possible to identify a top until the market reverses and it is also not possible to identify a bottom without the market stop falling and start rising. If you are looking for a professional programmer for Metatrader5, please
FREE
This indicator is a zero-lag indicator and displays  strength of trend change . True Trend  Oscillator Pro works best in combination with True Trend Moving Average Pro that displays exact trend as is. Oscillator value is exact price change in given direction of the trend. True Trend Moving Average Pro: https://www.mql5.com/en/market/product/103586 If you set PERIOD input parameter to 1 this indicator becomes a sharpshooter for binary options. Developers can use True Trend Oscillator in Exper
FREE
Best SAR MT5
Ashkan Hazegh Nikrou
4.33 (3)
Descrizione:  siamo felici di presentare il nostro nuovo indicatore gratuito basato su uno degli indicatori professionali e popolari nel mercato forex (PSAR) questo indicatore è una nuova modifica sull'indicatore SAR parabolico originale, nell'indicatore pro SAR puoi vedere l'incrocio tra i punti e il grafico dei prezzi, questo il crossover non è un segnale ma parla del potenziale di fine movimento, puoi iniziare a comprare con un nuovo punto blu e posizionare lo stop loss un atr prima del pri
FREE
Volume Proxy
Giorgi Abuladze
Volume Proxy A synthetic order flow indicator for CFD traders on XAUUSD, NAS100, and US30. --- What It Does CFD and synthetic markets on MetaTrader 5 do not provide real volume data. The standard tick volume that most traders rely on only counts price updates — it reveals nothing about the actual buying and selling pressure behind a move. This leaves retail traders unable to distinguish genuine institutional activity from ordinary market noise. Volume Proxy addresses this directly. It synthesi
FREE
MACD Enhanced
Nikita Berdnikov
4 (4)
Introducing the MACD  Enhanced – an advanced MACD (Moving Average Convergence Divergence) indicator that provides traders with extended capabilities for trend and momentum analysis in financial markets. The indicator uses the difference between the fast and slow exponential moving averages to determine momentum, direction, and strength of the trend, creating clear visual signals for potential entry and exit points. Attention! To achieve the best results, it is recommended to adapt the indicator
FREE
Friend of the Trend: Your Trend Tracker Master the market with Friend of the Trend , the indicator that simplifies trend analysis and helps you identify the best moments to buy, sell, or wait. With an intuitive and visually striking design, Friend of the Trend analyzes price movements and delivers signals through a colorful histogram: Green Bars : Signal an uptrend, indicating buying opportunities. Red Bars : Alert to a downtrend, suggesting potential selling points. Orange Bars : Represent cons
FREE
The indicator highlights the points that a professional trader sees in ordinary indicators. VisualVol visually displays different volatility indicators on a single scale and a common align. Highlights the excess of volume indicators in color. At the same time, Tick and Real Volume, Actual range, ATR, candle size and return (open-close difference) can be displayed. Thanks to VisualVol, you will see the market periods and the right time for different trading operations. This version is intended f
FREE
PZ Penta O MT5
PZ TRADING SLU
3.8 (5)
The Penta-O is a 6-point retracement harmonacci pattern which usually precedes big market movements. Penta-O patterns can expand and repaint quite a bit. To make things easier this indicator implements a twist: it waits for a donchian breakout in the right direction before signaling the trade. The end result is an otherwise repainting indicator with a very reliable trading signal. The donchian breakout period is entered as an input. [ Installation Guide | Update Guide | Troubleshooting | FAQ | A
FREE
LT Donchian Channel
Thiago Duarte
4.86 (7)
Donchian Channel is an indicator created by Richard Donchian. It is formed by taking the highest high and the lowest low of the last specified period in candles. The area between high and low is the channel for the chosen period. Its configuration is simple. It is possible to have the average between the upper and lower lines, plus you have alerts when price hits one side. If you have any questions or find any bugs, please contact me. Enjoy!
FREE
VFI Quantum
Nikita Berdnikov
5 (1)
Introducing VFI (Volume Flow Indicator) – a trading indicator that analyzes the relationship between volume and price movement to identify key trading opportunities. The indicator displays the strength and direction of volume flow, providing clear signals about potential entry and exit points. Signals are formed based on zero line crossovers, crossovers between the VFI line and its exponential moving average (EMA), and when the indicator exits overbought and oversold zones. Attention! This stra
FREE
Scalper Indicator MT5
Mangesh Popat Ubale
5 (2)
SCALPER INDICATOR MT5 (IntraScalper)   IntraScalper Indicator Free Version is a simple and lightweight trading indicator designed for intraday traders who want clear visual signals and clean chart analysis.  This free version introduces traders to the core logic of the IntraScalper system using a single internal strategy. The indicator highlights potential buy and sell opportunities directly on the chart while keeping the interface simple and easy to read. It is ideal for traders who want quick
FREE
Spike Catch Pro
Amani Fungo
4.14 (7)
Spike Catch Pro 22:03 release updates Advanced engine for searching trade entries in all Boom and Crash pairs (300,500 and 1000) Programmed strategies improvements Mx_Spikes (to combine Mxd,Mxc and Mxe), Tx_Spikes,   RegularSpikes,   Litho_System,   Dx_System,   Md_System,   MaCross,   Omx_Entry(OP),  Atx1_Spikes(OP),   Oxc_Retracement (AT),M_PullBack(AT) we have added an arrow on strategy identification, this will help also in the visual manual backtesting of the included strategies and see ho
FREE
1. Overview The Scalping PullBack Signal indicator is a powerful technical analysis tool designed to help traders identify scalping opportunities based on potential pullback and reversal signals. This tool is particularly useful on lower timeframes (below 15 minutes) but can also be applied on higher timeframes for longer-term trades. This indicator integrates several key analytical components, providing a comprehensive view of trends and potential entry/exit points, helping you make quick and e
FREE
Noize Absorption Index - is the manual trading system that measures the difference of pressure between bears forces and bulls forces. Green line - is a noize free index that showing curent situation. Zero value of index shows totally choppy/flat market.Values above zero level shows how powerfull bullish wave is and values below zero measures bearish forces.Up arrow appears on bearish market when it's ready to reverse, dn arrow appears on weak bullish market, as a result of reverse expectation.
Our offer also includes a free panel — Indicator Panel — which allows you to show or hide indicators created by BOToBRACIA. High and Low Points is a practical technical analysis indicator that plots levels corresponding to the highs and lows from previous periods (day / week / month) — levels that, in the Smart Money Concepts (SMC) and ICT approach, are treated as liquidity zones, while in classical technical analysis they serve as potential support and resistance levels. Indicator settings: •
FREE
Mini Charts MTF EMA Mini Charts MTF EMA is a MetaTrader 5 indicator that displays multiple mini charts from selected timeframes directly on the main chart. It helps traders monitor multi-timeframe price movement and EMA direction in one clean visual layout. Main Features Multiple mini charts on the main chart Custom timeframe selection for each mini chart Up to 4 EMA lines for every mini chart Custom EMA period, shift, method, applied price, color, style, and width Custom mini chart width, heigh
FREE
Price Magnet — Price Density and Attraction Levels Indicator Price Magnet is a professional analytical tool designed to identify key support and resistance levels based on statistical Price Density. The indicator analyzes a specified historical period and detects price levels where the market spent the most time. These zones act as “magnets,” attracting price action or forming a structural base for potential reversals. Unlike traditional Volume Profile tools, Price Magnet focuses on price-time d
L'indicateur SMC Venom Model BPR est un outil professionnel pour les traders travaillant dans le concept Smart Money (SMC). Il identifie automatiquement deux modèles clés sur le graphique des prix: FVG   (Fair Value Gap) est une combinaison de trois bougies, dans laquelle il y a un écart entre la première et la troisième bougie. Forme une zone entre les niveaux où il n'y a pas de support de volume, ce qui conduit souvent à une correction des prix. BPR   (Balanced Price Range) est une combinaiso
Gli utenti di questo prodotto hanno anche acquistato
Neuro Poseidon MT5
Daria Rezueva
4.8 (54)
Neuro Poseidon is a new indicator by Daria Rezueva. It combines precise trading signals with adaptive TP/SL levels - creating best possible trades as a result! Message me and get  Neuro Poseidon Assistant  as a gift to automize your trading process! What makes it stand out? 1. Proven profitability on all assets and timeframes 2. Only confirmed BUY and SELL signals present on the chart 3. Adaptive TP & SL levels generated by the software for each trade 4. Easy to understand - suitable for al
M1 Quantum MT5
Hamed Dehgani
5 (5)
Segnali di Trading Live con M1 Quantum: Segnale Piano prezzi: Prezzo attuale: $149 (Offerta per i primi utenti) Prossimo prezzo previsto: $169 Prezzo al dettaglio previsto: $299 Nota dello sviluppatore: Dopo l’acquisto, contattami per ricevere il file di configurazione più recente (Set File) , consigli operativi e l’invito al gruppo VIP di supporto , dove potrai interagire con altri utenti di M1 Quantum. M1 Quantum è un sistema di trading p rofessionale per M1 che fornisce segnali di trading ra
Divergence Bomber
Ihor Otkydach
4.9 (92)
Ogni acquirente dell’indicatore riceverà inoltre gratuitamente: L’utilità esclusiva “Bomber Utility”, che gestisce automaticamente ogni operazione, imposta i livelli di Stop Loss e Take Profit e chiude le posizioni secondo le regole della strategia I file di configurazione (set file) per adattare l’indicatore a diversi asset I set file per configurare il Bomber Utility in tre modalità: “Rischio Minimo”, “Rischio Bilanciato” e “Strategia di Attesa” Una guida video passo-passo per installare, conf
L'indicatore UZFX {SSS} Scalping Smart Signals v4.0 MT5 è un indicatore di trading ad alte prestazioni che non subisce ripaint, progettato per scalper, day trader e swing trader che necessitano di segnali accurati e in tempo reale in mercati in rapida evoluzione. Sviluppato da (UZFX-LABS), questo indicatore combina l’analisi dell’azione dei prezzi, la conferma del trend e il filtraggio intelligente per generare segnali di acquisto e vendita ad alta probabilità, segnali di allerta e opportunità d
L’indicatore evidenzia le zone in cui viene dichiarato interesse sul mercato , per poi mostrare la zona di accumulo degli ordini . Funziona come un book degli ordini su larga scala . Questo è l’indicatore per i grandi capitali . Le sue prestazioni sono eccezionali. Qualsiasi interesse ci sia nel mercato, lo vedrai chiaramente . (Questa è una versione completamente riscritta e automatizzata – non è più necessaria un’analisi manuale.) La velocità di transazione è un indicatore concettualmente nuo
Gem SIGNAL
Shengzu Zhong
5 (1)
GEM Signal Pro GEM Signal Pro è un indicatore trend-following per MetaTrader 5, progettato per i trader che desiderano segnali più chiari, configurazioni operative più strutturate e una gestione del rischio più pratica direttamente sul grafico. Invece di mostrare solo una semplice freccia, GEM Signal Pro aiuta a presentare l’intera idea di trading in modo più chiaro e leggibile. Quando le condizioni sono confermate, l’indicatore può mostrare sul grafico il prezzo di ingresso, lo stop loss e gli
Presentazione       Quantum Breakout PRO   , l'innovativo indicatore MQL5 che sta trasformando il modo in cui scambi le zone di breakout! Sviluppato da un team di trader esperti con un'esperienza di trading di oltre 13 anni,       Quantum Breakout PRO       è progettato per spingere il tuo viaggio di trading a nuovi livelli con la sua strategia innovativa e dinamica della zona di breakout. Quantum Breakout Indicator ti fornirà frecce di segnalazione sulle zone di breakout con 5 zone target di
ARIPoint
Temirlan Kdyrkhan
1 (1)
ARIPoint is a powerful trading companion designed to generate high-probability entry signals with dynamic TP/SL/DP levels based on volatility. Built-in performance tracking shows win/loss stats, PP1/PP2 hits, and success rates all updated live. Key Features: Buy/Sell signals with adaptive volatility bands Real-time TP/SL/DP levels based on ATR Built-in MA Filter with optional ATR/StdDev volatility Performance stats panel (Success, Profit/Loss, PP1/PP2) Alerts via popup, sound, push, or email Cu
The Oracle Pro
Ottaviano De Cicco
The Oracle Pro: Synthetic Multi-Timeframe Bias Engine for MT5 ️ Summer Launch Offer — Get The Oracle Pro for USD 199 (early buyers). Price rises with traction; final price USD 399. The Oracle Pro is a premium multi-timeframe bias engine for MetaTrader 5, built for demanding and professional traders. It answers one question with discipline: what is the directional bias on each timeframe right now, how strong is it, and how much do the timeframes agree? Everything is computed on closed bars only
Quantum TrendPulse
Bogdan Ion Puscasu
5 (25)
Ecco   Quantum TrendPulse   , lo strumento di trading definitivo che combina la potenza di   SuperTrend   ,   RSI   e   Stocastico   in un unico indicatore completo per massimizzare il tuo potenziale di trading. Progettato per i trader che cercano precisione ed efficienza, questo indicatore ti aiuta a identificare con sicurezza le tendenze di mercato, i cambiamenti di momentum e i punti di entrata e uscita ottimali. Caratteristiche principali: Integrazione SuperTrend:   segui facilmente l'andame
Current event:  https://c.mql5.com/1/326/A2SR2025_NoMusic.gif A2SR per MT5 Indicatore: Domanda e Offerta Effettive Automatizzate (S/R). + Strumenti di Trading. Product description in English here. --   Guidance   : -- at   https://www.mql5.com/en/blogs/post/734748/page4#comment_16532516 -- and  https://www.mql5.com/en/users/yohana/blog Potente, Autentico e Risparmio di Tempo per Decisioni di Trading più Intelligenti + Oggetti compatibili con EA. Vantaggi Principali Livelli di SR Effettivi
Azimuth Pro
Ottaviano De Cicco
5 (7)
Azimuth Pro V2: Synthetic Fractal Structure and Confirmed Entries for MT5 Overview Azimuth Pro is a multi-level swing structure indicator by Merkava Labs . Four nested swing layers, swing-anchored VWAP, ABC pattern detection, three-timeframe structural filtering, and closed-bar confirmed entries — one chart, one workflow from micro-swings to macro-cycles. This is not a blind signal product. It is a structure-first workflow for traders who care about location, context, and timing. ️ Summer Sale
Btmm state engine pro
Garry James Goodchild
5 (4)
BTMM State Engine Pro is a MetaTrader 5 indicator for traders who use the Beat The Market Maker approach: Asian session context, kill zone timing, level progression, peak formation detection, and a multi-pair scanner from a single chart. It combines cycle state logic with a built-in scanner dashboard so you do not need the same tool on many charts at once. What it does Draws the Asian session range; session times can follow broker server offset or be set in inputs. Tracks level progression (L
Quant Direction MT5
Georgios Kalomoiropoulos
Quant Direction è uno strumento di analisi di mercato 3D. Offre un'analisi di mercato perfettamente oggettiva, basata su algoritmi, calcolando con precisione le deviazioni percentuali su diversi parametri. Sviluppato utilizzando strumenti di modellazione avanzati basati sull'intelligenza artificiale e rigorosamente testato, questo algoritmo analizza il mercato con una precisione senza pari. È possibile analizzare qualsiasi coppia di valute o strumento finanziario sulla piattaforma. Che si pratic
Trend Forecaster
Alexey Minkov
5 (8)
Trend Forecaster is a MetaTrader 5 indicator that combines breakout signals, possible reversal area analysis, market range data and a visual statistics panel in one chart workspace. It shows Buy and Sell signals, tracks Average Range and Current Range, and can automatically adjust Sensitivity for the current symbol and timeframe. Manual Sensitivity control is also available. The indicator can be used on Forex pairs, metals, stocks, indices and cryptocurrencies. Different timeframes are supported
KURAMA GOLD SIGNAL PRO (MT5) — Filtro a 7 livelli · TP/SL automatico · Punteggio di qualità · Salvataggio dello storico dei segnali | Sistema di trading completo per XAUUSD Nessun ridisegno (repaint) in tempo reale. Nell'istante in cui appare un segnale, freccia, ingresso, TP e SL vengono bloccati sul posto e non si spostano mai più. Ciò che fai tradare è proprio questo segnale in tempo reale. E nella v7.20, ogni segnale realmente inviato viene salvato automaticamente e ripristinato con esattez
CGE Trading Suite
Carl Gustav Johan Ekstrom
5 (2)
Institutional-Grade Analytics for MT5 One indicator. The full analytical edge of a professional trading desk, built into your MT5 chart. CGE Trading Suite unifies everything a serious trader reads in a market — structure, momentum, timing, and capital flow — into one seamless MT5 workspace. 17 integrated modules act as a single system: ICT sessions and killzones, order-block and liquidity mapping, MIDAS volume curves, automated trend lines and channels, the Economic Confidence Model, and a live
Top indicator for MT5   providing accurate signals to enter a trade without repainting! It can be applied to any financial assets:   forex, cryptocurrencies, metals, stocks, indices .  Watch  the video  (6:22) with an example of processing only one signal that paid off the indicator! MT4 version is here It will provide pretty accurate trading signals and tell you when it's best to open a trade and close it. Most traders improve their trading results during the first trading week with the help of
Shock Pullback
Suleiman Alhawamdah
5 (1)
Semplicemente, puoi iniziare a fare trading quando il movimento dei numeri bianchi — noti come "pips" — inizia ad apparire accanto alla candela corrente. I "pips" bianchi indicano che un'operazione di acquisto o vendita è attualmente attiva e si sta muovendo nella direzione corretta, come indicato dal colore bianco. Quando il movimento dei pips bianchi si interrompe e diventa di colore verde statico, questo segnala la fine della spinta attuale. Il colore verde dei numeri rappresenta il profitto
Grabber System MT5
Ihor Otkydach
4.83 (24)
Ti presento un eccellente indicatore tecnico: Grabber, che funziona come una strategia di trading "tutto incluso", pronta all’uso. In un solo codice sono integrati strumenti potenti per l’analisi tecnica del mercato, segnali di trading (frecce), funzioni di allerta e notifiche push. Ogni acquirente di questo indicatore riceve anche gratuitamente: L’utility Grabber: per la gestione automatica degli ordini aperti Video tutorial passo dopo passo: per imparare a installare, configurare e utilizzare
Backtesting Simulator MT5
Diego Arribas Lopez
4 (1)
[ MT4 Version ] Are you tired of spending months on demo or live accounts to test your trading strategies? The Backtesting Simulator is the ultimate tool designed to elevate your backtesting experience to new heights. Utilizing Metatrader historical symbol information, it offers an unparalleled simulation of real market conditions. Take control of your testing speed, test ideas quickly or at a slower pace, and witness remarkable improvements in your testing performance. Forget about wasting tim
Price & Time Market Structure Indicator A professional market structure tool that analyzes waves through both price and time — not price alone. Main Description NeoWave PRO   is a professional market structure indicator for MetaTrader 4 designed for traders who want to move beyond traditional one-dimensional wave tools such as ZigZag, swing indicators, and basic high/low systems. Most wave indicators analyze only one thing: Price. But a real market wave is not only a price movement. A true wave
Weltrade Spike Sentinel
Batsirayi L Marango
5 (1)
Introducing Indicator for PainX and GainX Indices Traders on Weltrade Get ready to experience the power of trading with our indicator, specifically designed for Weltrade   broker's PainX and GainX Indices.  Advanced Strategies for Unbeatable Insights Our indicator employs sophisticated strategies to analyze market trends, pinpointing optimal entry and exit points.  Optimized for Maximum Performance To ensure optimal results, our indicator is carefully calibrated for 5-minute timeframe charts on
RelicusRoad Pro MT5
Relicus LLC
4.96 (24)
RelicusRoad Pro: Sistema Operativo Quantitativo di Mercato 70% DI SCONTO ACCESSO A VITA (TEMPO LIMITATO) - UNISCITI A 2.000+ TRADER Perché la maggior parte dei trader fallisce anche con indicatori "perfetti"? Perché operano su Singoli Concetti isolati. Un segnale senza contesto è una scommessa. Per vincere serve CONFLUENZA . RelicusRoad Pro non è un semplice indicatore. È un Ecosistema Quantitativo completo . Mappa la "Fair Value Road", distinguendo tra rumore e rotture strutturali. Smetti di in
Meravith MT5
Ivan Stefanov
5 (1)
Strumento per market maker. Meravith: Analizzerà tutti i timeframe e mostrerà il trend attualmente in corso. Evidenzierà le zone di liquidità (equilibrio dei volumi) dove i volumi rialzisti e ribassisti sono uguali. Mostrerà tutti i livelli di liquidità dei diversi timeframe direttamente sul grafico. Genererà e presenterà un’analisi di mercato testuale a scopo di riferimento. Calcolerà obiettivi, livelli di supporto e punti di stop-loss in base al trend attuale. Calcolerà il rapporto rischio/ren
PrimeScalping
Temirlan Kdyrkhan
PrimeScalping is a powerful trading companion designed to generate high-probability entry signals with dynamic TP/SL/DP levels based on volatility. Built-in performance tracking shows win/loss stats, PP1/PP2 hits, and success rates — all updated live. Key Features: Buy/Sell signals with adaptive volatility bands Real-time TP/SL/DP levels based on ATR Built-in MA Filter with optional ATR/StdDev volatility Performance stats panel (Success, Profit/Loss, PP1/PP2) Alerts via popup, sound, push, or e
Royal Wave Pro M5
Vahidreza Heidar Gholami
3.5 (4)
Royal Wave is a Trend-Power oscillator which has been programmed to locate and signal low-risk entry and exit zones. Its core algorithm statistically analyzes the market and generates trading signals for overbought, oversold and low volatile areas. By using a well-designed alerting system, this indicator makes it easier to make proper decisions regarding where to enter and where to exit trades. Features Trend-Power Algorithm Low risk Entry Zones and Exit Zones Predictions for Overbought and Over
Presenting one-of-a-kind Gann Indicator for XAUUSD IQ Gold Gann Levels is a non-repainting, precision tool designed exclusively for XAUUSD intraday trading. It uses W.D. Gann’s square root method to plot real-time support and resistance levels, helping traders spot high-probability entries with confidence and clarity. William Delbert Gann (W.D. Gann) was an exceptional market analyst whose trading technique was based on a complex blend of mathematics, geometry, astrology, and ancient calculation
OmniSync Projection
Antonio-alin Teculescu
5 (1)
Chronos Fractal Engine is an innovative price projection indicator for MetaTrader 5, designed to transform your technical analysis by intelligently identifying and projecting historical price patterns. Built upon an advanced correlation algorithm and the fractal principles of the market, this powerful tool visualizes potential future price movements, giving you a unique edge in your trading decisions. What is Chronos Fractal Engine? At its core, the Chronos Fractal Engine employs a sophisticat
ACB Breakout Arrows MT5
KEENBASE SOFTWARE SOLUTIONS
3.5 (2)
L’indicatore ACB Breakout Arrows fornisce un segnale di ingresso fondamentale nel mercato rilevando uno specifico pattern di breakout. L’indicatore analizza costantemente il grafico per individuare un momentum stabile in una direzione e fornisce un segnale preciso subito prima del movimento principale. Ottieni lo scanner multi-simbolo e multi-timeframe da qui - Scanner per ACB Breakout Arrows MT5 Caratteristiche principali I livelli di Stop Loss e Take Profit sono forniti automaticamente dall’
Altri dall’autore
Yoshi Pro Rejection Zones: A Smarter Way to Read Support, Resistance and Price Rejection on MetaTrader 5 In trading, one of the most important skills is knowing where the market is likely to react. Whether a trader focuses on forex, gold, indices, crypto, or CFDs, price often responds around meaningful support and resistance areas. These areas can become turning points, breakout zones, retest levels, or simply locations where traders should pay closer attention. The challenge is that most charts
FREE
UT Bot Yoshi Trend ATR MT5 – Professional ATR Trailing Stop Trend Indicator for MetaTrader 5 UT Bot Yoshi Trend ATR MT5 is a professional trend-following indicator for MetaTrader 5, designed to help traders read market direction, follow volatility-based trailing stop behavior, and organize Buy/Sell trading ideas with a clean visual structure. The indicator is built around a practical and well-known trading concept: ATR trailing stop logic . Instead of trying to predict the market or identify per
FREE
Pinbar Yoshi Pro – Clean Multi-Timeframe Pin Bar Detection for MetaTrader 5 Pinbar Yoshi Pro is a clean and practical MT5 indicator designed for traders who use price action, candlestick rejection, support and resistance, market structure and multi-timeframe analysis in their daily trading routine. The purpose of this tool is simple: to help traders detect bullish and bearish Pin Bar candles more clearly, more consistently and with less manual chart scanning. In real trading, a Pin Bar is not
ORBYoshi V1.26 – Professional Opening Range Breakout Framework for MetaTrader 5 The Opening Range Breakout (ORB) is one of the most respected intraday trading concepts in modern market history. Popularized through the research and trading work of renowned traders such as Toby Crabel , Larry Williams , and Mark Fisher , the ORB methodology focuses on identifying directional opportunities that emerge after the market establishes its initial opening range. ORBYoshi was developed to bring this timel
Price Action Structure Yoshi for MetaTrader 5 Introduction Price Action Structure Yoshi is a professional Price Action and Market Structure Indicator designed for MetaTrader 5. This MT5 Indicator helps traders visualize market structure, liquidity areas, order blocks, liquidity sweeps, and trendline relationships directly on the chart in a clear and organized manner. Inspired by widely recognized Price Action Analysis and Market Structure concepts, the indicator focuses on helping traders unders
ATR-based trend signals, structured trade planning and higher-timeframe price-action context in one MetaTrader 5 indicator. LTYoshi_Pro is a decision-support indicator built around an ATR trailing-stop engine. It is designed to help traders organize trend signals, risk levels and market context without mixing every chart element into a single automatic decision. The indicator separates its work into independent layers. The core engine produces raw Buy/Sell events when the selected price source
Filtro:
Irfan
1632
Irfan 2026.06.05 09:14 
 

This indicator teaches you discipline and when not to enter a trade. The developer is a very nice person and answers your queries in details.

Le Quang Thanh
1150
Risposta dello sviluppatore Le Quang Thanh 2026.06.06 19:09
Thank you very much for your review, Irfan. I am glad the framework is helping you focus on discipline and trade selection. Those principles are at the heart of the strategy. I truly appreciate your support and wish you all the best in your trading journey.
Rispondi alla recensione