• Panoramica
  • Recensioni (16)
  • Commenti (31)
  • Novità

FX Volume MT5

4.8

Ricevi il tuo aggiornamento quotidiano sul mercato con dettagli e schermate tramite il nostro Morning Briefing qui su mql5 e su Telegram!

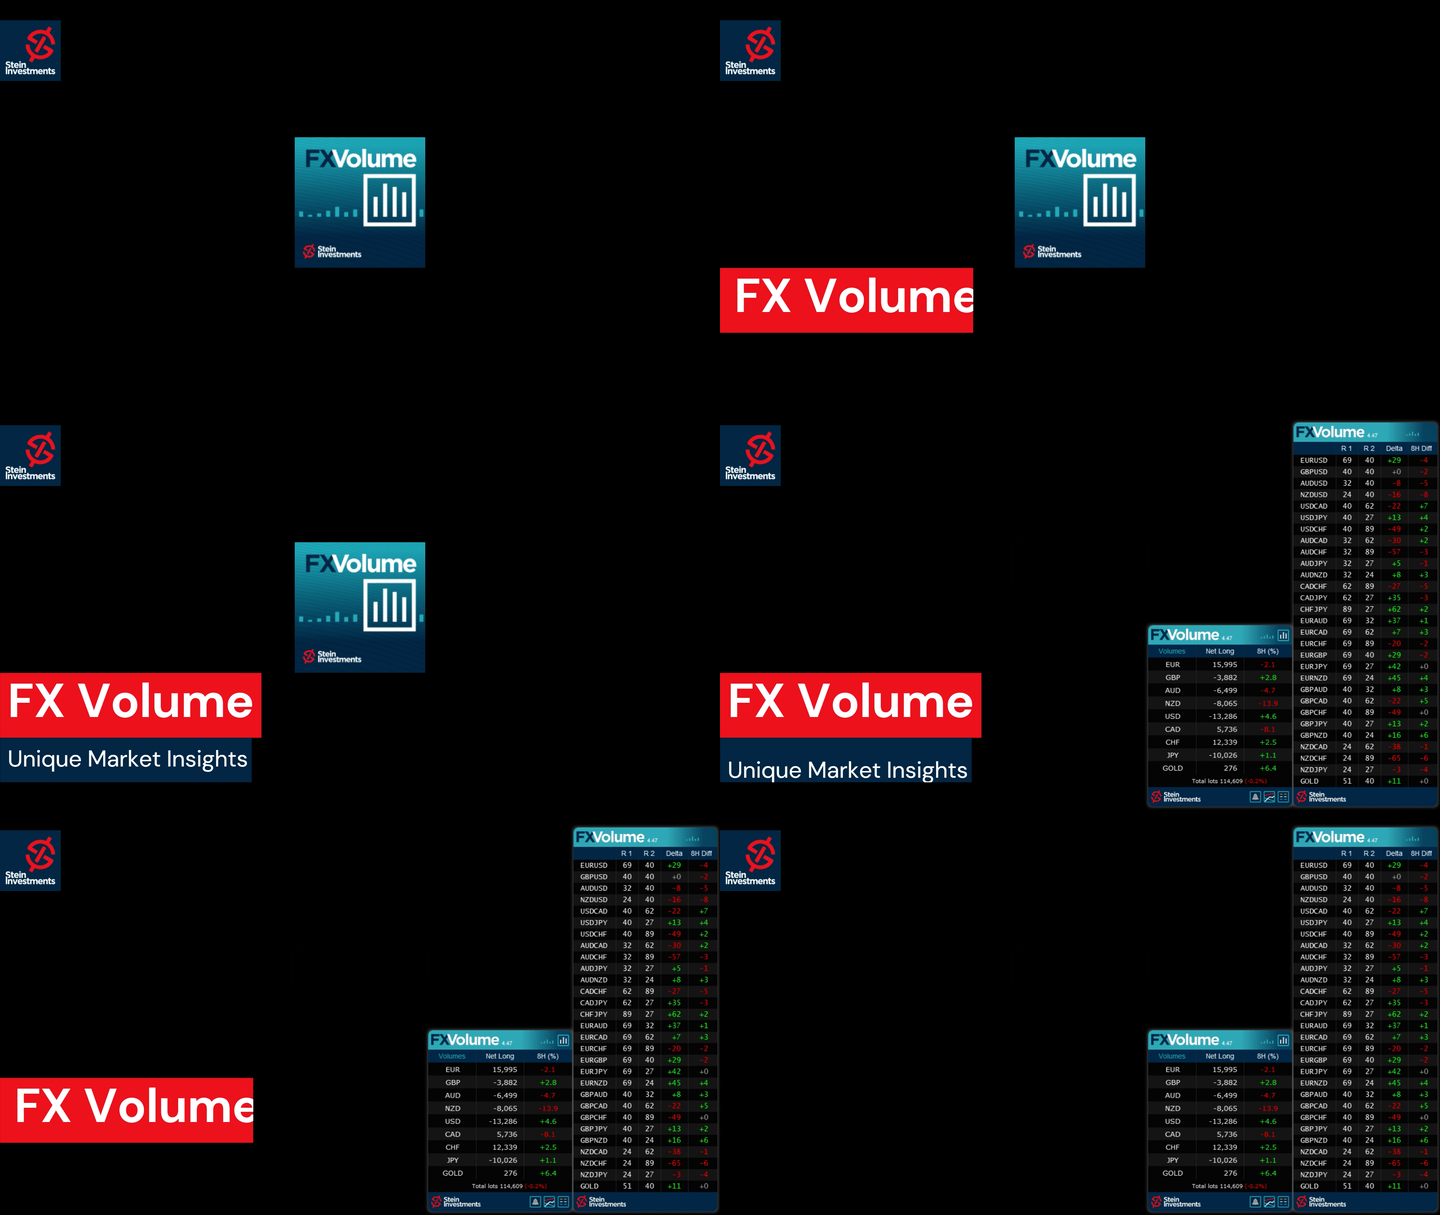
FX Volume è il PRIMO e UNICO indicatore di volume che fornisce una visione REALE del sentiment del mercato dal punto di vista del broker.

Fornisce informazioni straordinarie su come gli operatori di mercato istituzionali, come i broker, sono posizionati sul mercato Forex, molto più velocemente dei rapporti COT.
Vedere queste informazioni direttamente sul vostro grafico è la vera soluzione innovativa per il vostro trading.

Approfittate di dati di mercato unici come

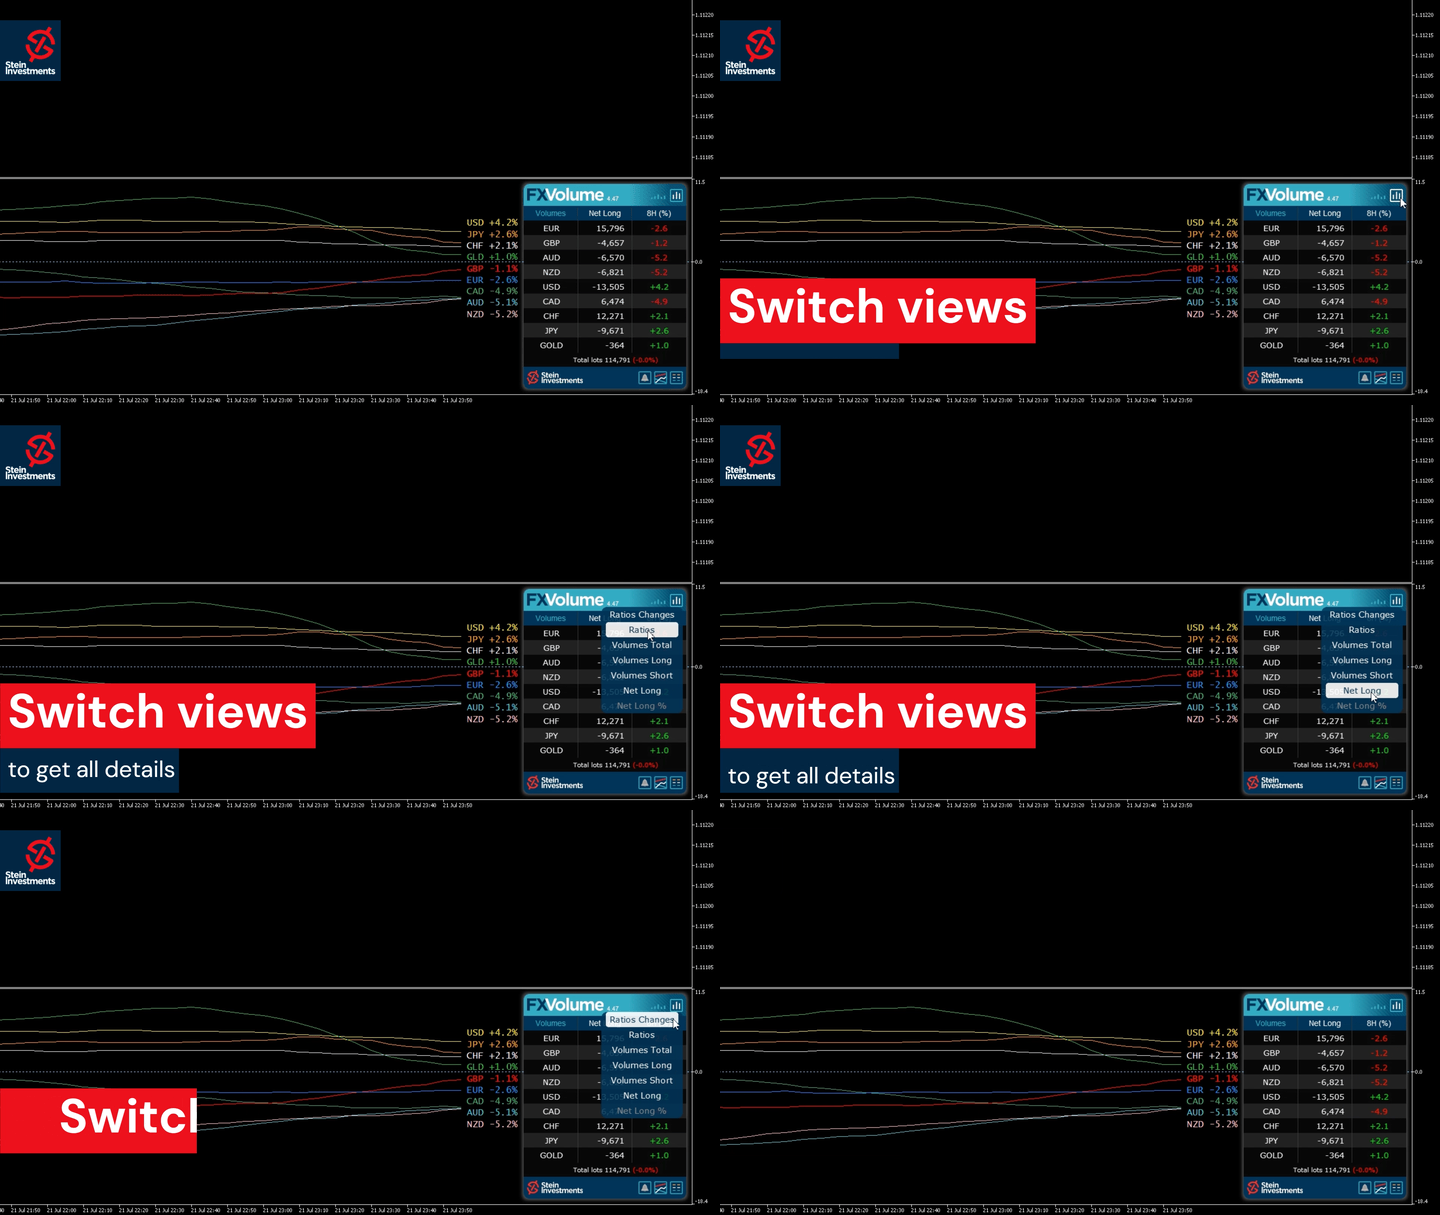
  • I rapporti mostrano il rapporto tra posizione lunga e corta delle valute in percentuale.
  • Ratios Changes mostra i rapporti lunghi e la loro variazione percentuale nel periodo di tempo selezionato
  • Volumi totali mostra il volume totale negoziato (lungo e corto) delle valute in lotti
  • Volumi Long mostra il volume negoziato di tutte le posizioni long delle valute
  • Volumi Short mostra il volume negoziato di tutte le posizioni short delle valute
  • Net Long mostra il volume netto long, ossia tutte le posizioni long meno tutte le posizioni short in lotti
  • Net Long Percent mostra la variazione del volume netto long delle valute

Leggete il nostro tutorial di base -> "Come fare trading con il volume FX ".

Per ulteriori informazioni, come FAQ, consigli di trading e video tutorial, consultate il nostro canale informativo pubblico FX Volume.

installare ed eseguire SI Connect per stabilire una connessione costante al nostro centro dati.


Informazioni di base

Sappiamo tutti che il Forex è un mercato decentralizzato. Ecco perché abbiamo dovuto pensare fuori dagli schemi, sviluppare una soluzione unica e codificare il progetto più complesso a cui abbiamo mai lavorato per ottenere queste informazioni inestimabili nei nostri grafici. Da ottobre 2018 i nostri server analizzano e registrano i dati del volume di trading reale provenienti da diverse fonti in tutto il mondo. Raccogliamo i dati, analizziamo le variazioni del volume di trading e calcoliamo un indice per le più importanti valute di trading sul Forex, ma questo è solo l'inizio. In seguito, forniremo tali informazioni anche per altri strumenti di trading come l'oro e il petrolio.


Qual è il vantaggio di utilizzare i dati sui volumi reali forniti da Stein Investments?

1. Grazie al punto di vista dei nostri broker, è possibile operare facilmente con i soldi intelligenti
2. Ottenete questo tipo di dati di mercato sul sentiment in tempo reale, direttamente sul vostro grafico
3. Grazie al nostro database storico registrato in tempo reale, potete facilmente verificare il valore di queste informazioni.

FX Volume è assolutamente unico perché è l'unico strumento in grado di stampare questi dati direttamente sul vostro grafico!


Perché è disponibile solo a noleggio?

Come descritto in precedenza, FX Volume è un servizio continuo con un'infrastruttura di backend in funzione che costa, così come gli amministratori e i codificatori che monitorano e migliorano l'intera struttura, come il database in background e il front-end grafico che si carica sui grafici.

Per questo motivo siamo costretti ad addebitare un costo ricorrente, ma FX Volume si ripaga facilmente da solo.
Inoltre, offriamo grandi sconti per gli abbonamenti a medio e lungo termine.


Impostazioni dell'indicatore FX Volume

  • Zona DST del broker e spostamento GMT - Cercate su Google o chiedete all'assistenza del vostro broker i valori corretti.
  • Confronta con X ore indietro - Impostare un valore orario per il confronto del Rapporto e del Delta. Il valore predefinito è 24 ore indietro.
  • Visualizza tutte le righe della cronologia - Impostare su "false" per visualizzare solo le righe della cronologia delle valute relative ai simboli.
  • Visualizzazione predefinita - Scegliere tra la visualizzazione del Rapporto e quella delle Variazioni.
  • Mostra elenco simboli - Impostare su "false" per nascondere l'elenco dei 28 simboli nel grafico principale.
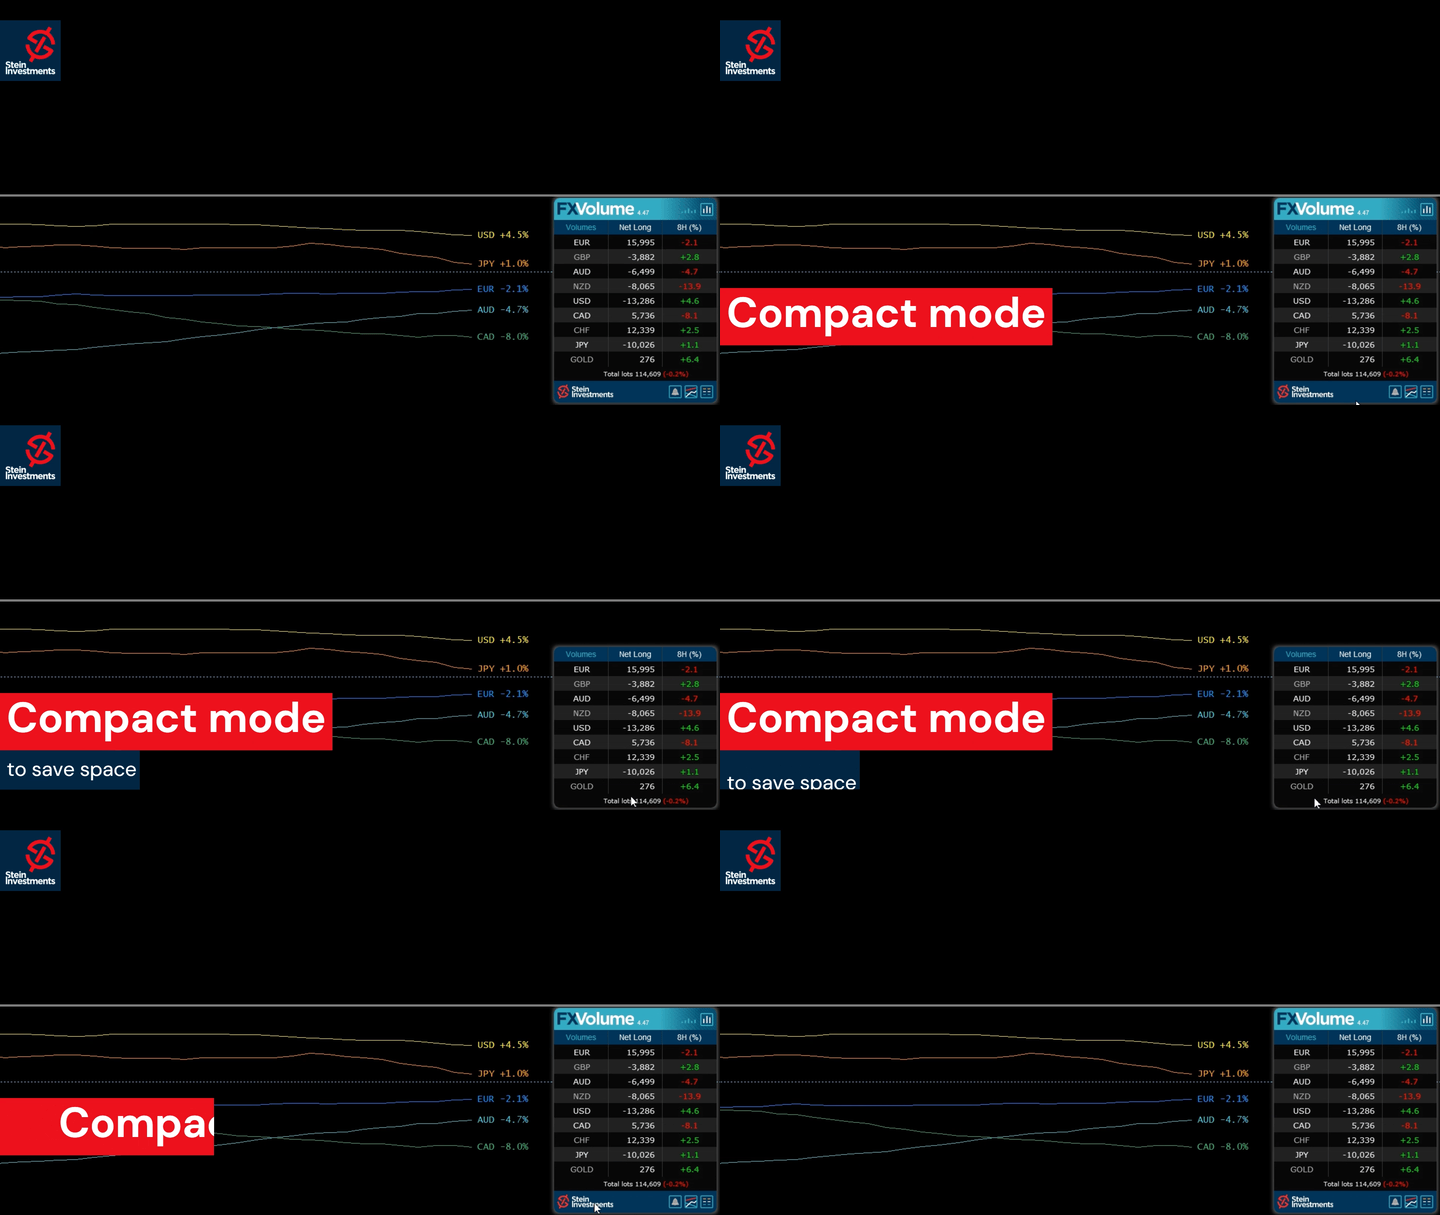
  • Fattore di zoom - Aumenta o diminuisce la dimensione di tutti gli elementi grafici.


Volete diventare un trader forex a 5 stelle sempre redditizio?

Allora procuratevi i nostri strumenti di trading Stein Investments e inviateci uno screenshot per ricevere il vostro invito personale alla nostra esclusiva chat di trading con 500 membri.


Recensioni 16
Oliver Henry
585
Oliver Henry 2023.07.24 22:20 
 

Very good indicator and totally unique on the retail forex market. The insight a trader can get from this is a real edge for trading. The support is also very good as are the daily updates that are published on the chat group.

bandelero
354
bandelero 2023.06.16 16:15 
 

I have now closed the second week of trading with FX Power and FX Volume with net gain of 2.7%. I am really pleased how the indicators gives me a quick overview of the market and help me to choose the relevant currency to trade for the day.

Khuman Bakhramirad
8827
Khuman Bakhramirad 2023.05.18 13:15 
 

its an amazing indicator, once you combine it with other tools its very good.

Prodotti consigliati
Simple Weis Wave
Jean Jacques Huve Ribeiro
4 (4)
One of the best tools for analyzing volume, Weis Wave was idelized by David Weis, to facilitate the reading of directional flow. For the VSA method disciples it is an evolution of the practices created by Richard Wycoff, facilitating a predictive reading of the market, always seeking an accumulation and distribution of the negotiated contracts. Cumulative wave volume  Range of wave ( removed) Average Wave volume Ref "Tim Ord lectures" ( removed)
FREE
The Volume Weighted ATR indicator is a helpful tool for measuring market activity. It is based on the idea of the Volume-Weighted ATR. Combining these two elements helps identify potential turning points or breakout opportunities. The indicator for the classification of the activity of the market uses the moving average and its multiples. Accordingly, where the VWATR bar is located (relative to the moving average), it is labelled as ultra-low, low, average, high, very high or ultra high. The Vo
FREE
White Weis Volume Ticks
Ricardo Almeida Branco
5 (3)
White Weis Volume This indicator shows the sum of the volume in each wave, bulish or bearish, as idealized by David Weis , but it brings an important addition , which is the marking of the bar with the highest volume of the wave (White Bar)! In coding the indicator, it was sought to optimize the code to require minimal processing during use and not to overload mt5. The indicator can be used for pre-trading analysis and study, where the trader analyzes possible points of support and resi
30 USD
A countdown timer for the  Volume bar chart generator  and  Tick chart generator  products, which are available for download from the MQL5 Market: Tick chart generator: https://www.mql5.com/en/market/product/29215 Volume bar chart generator: https://www.mql5.com/en/market/product/47197 The counter conveniently displays the number of ticks or transactions (depending on the chart) that need to pass for a new bar to start printing. The user can set the following indicator inputs. Volume type
FREE
Sweet VWAP MT5
Francisco Gomes Da Silva
4.1 (10)
Scopri dove le grandi istituzioni stanno negoziando e ottimizza i tuoi investimenti con l'Indicatore VWAP Ancorata Gratuito Scopri il prezzo in cui le grandi istituzioni stanno negoziando con il nostro Indicatore VWAP Ancorata Gratuito ! Ora puoi risparmiare il tuo tempo prezioso automatizzando la tracciatura delle tue VWAP ancorate ai massimi e minimi del mercato. La nostra versione gratuita ti consente di visualizzare facilmente la VWAP in tempo reale, seguendo il movimento del cursore del mou
FREE
Automatic Vwap Midas
Ricardo Almeida Branco
5 (1)
The 3 Automatic Vwap (Midas) Indicator can be used for Price and Volume studyers to map the movement of market drivers. It automatically plots 3 Vwaps, two of which are dynamic and will be updated throughout the day if new highs or new lows emerge. The third Vwap is daily and can help if the trend is up or down. Also, an auxiliary indicator that plots (also dynamic) points of interest with OHLC prices (Open, High and Low of the current day and Close of the previous day) was inserted. Success and
40 USD
VWAP Indicator
LUC JACOBUS A VERHEECKE
4.19 (16)
Volume Weighted Average Price (VWAP) The volume weighted average price (VWAP) is a   trading   benchmark   used by traders that gives the average price a security has traded at throughout the day, based on both volume and price. It is important because it provides traders with insight into both the trend and value of a security. This indicator VWAP V2 is free and is the manual version of the extended Easy VWAP indicator (30 Euro), where the date and time properties are automatically entered. Wit
FREE
Value Chart Candlesticks
Flavio Javier Jarabeck
4.8 (5)
The idea of a Value Chart indicator was presented in the very good book I read back in 2020 , " Dynamic Trading Indicators: Winning with Value Charts and Price Action Profile ", from the authors Mark Helweg and David Stendahl. The idea is simple and the result is pure genius: Present candlestick Price analysis in a detrended way! HOW TO READ THIS INDICATOR Look for Overbought and Oversold levels. Of course, you will need to test the settings a lot to find the "correct" one for your approach.
FREE
MIDAS Super VWAP
Flavio Javier Jarabeck
4.23 (13)
Imagine VWAP, MVWAP and MIDAS in one place... Well, you found it! Now you can track the movement of Big Players in various ways, as they in general pursue the benchmarks related to this measuring, gauging if they had good execution or poor execution on their orders. Traders and analysts use the VWAP to eliminate the noise that occurs throughout the day, so they can measure what prices buyers and sellers are really trading. VWAP gives traders insight into how a stock trades for that day and deter
FREE
VWAP and MVWAP
Flavio Javier Jarabeck
4.29 (7)
Volume Weighted Average Price (VWAP) is a trading benchmark commonly used by Big Players that gives the average price a Symbol has traded throughout the day. It is based on both Volume and price. Additionally we put in this indicator the MVWAP (Moving Volume Weighted Average Price). For those who do not know the usage and the importance od this indicator I recommend a great article about this subject at Investopedia ( https://www.investopedia.com/articles/trading/11/trading-with-vwap-mvwap.asp )
FREE
Weis Waves
Flavio Javier Jarabeck
3.24 (25)
The original author is David Weis, an expert in the Wyckoff Method. The Weis Wave is a modern adaptation of the 1930's Wyckoff Method, another expert in Tape Reading techniques and Chart Analysis. Weis Waves takes market volume and stacks it into waves according to price conditions giving the trader valuable insights about the market conditions. If you want to learn more about this subject you can find tons of videos in YouTube. Just look for "The Wickoff Method", "Weis Wave" and "Volume Spread
FREE
Aggression Volume
Flavio Javier Jarabeck
3.79 (19)
Aggression Volume Indicator is the kind of indicator that is rarely found in the MQL5 community because it is not based on the standard Volume data provided by the Metatrader 5 platform. It requires the scrutiny of all traffic Ticks requested on the platform... That said, Aggression Volume indicator requests all Tick Data from your Broker and processes it to build a very special version of a Volume Indicator, where Buyers and Sellers aggressions are plotted in a form of Histogram. Additionally,
FREE
Cybertrade Keltner Channels
Emanuel Andriato
4.67 (3)
Cybertrade Keltner Channels - MT5 Created by Chester Keltner, this is a volatility indicator used by technical analysis. It is possible to follow the trend of financial asset prices and generate support and resistance patterns. In addition, envelopes are a way of tracking volatility in order to identify opportunities to buy and sell these assets. It works on periods longer than the period visible on the chart. All values ​​are available in the form of buffers to simplify possible automations.
FREE
Weis Wave Double Side Alert
Eduardo Da Costa Custodio Santos
L'indicatore laterale Weis Wave Bouble per MT5 fa parte del toolkit (Wyckoff Academy Wave Market) L'indicatore laterale Weis Wave Bouble per MT5 è stato creato sulla base della già consolidata Weis Wave creata da David Weis. L'indicatore Weis Wave Double Side legge il mercato a ondate come fece R. Wyckoff nel 1900. Aiuta a identificare sforzo x risultato, causa ed effetto e domanda e offerta Il suo differenziale è che può essere utilizzato sotto l'asse zero e mostra un avviso di breakout Chi è f
60 USD
This z-score indicator shows the correct z-score of an asset, as it uses the normalized price data for calculation, which is the only correct way. Z-score is only applicable for normal distributed data, therefore not the actual price is considered, but the normalised returns, which were assumed to follow a normal distribution. Returns are mean reverting and assumed to follow a normal distribution, therefore z-score calculation of returns is more reliable than z-score on price, as price is NOT m
99 USD
This indicator is stand alone version from  MP Pivot Levels  (All in one) containing Demark's Pivots. Calculations:     PP = X / 4     R1 = X / 2 - LOWprev     S1 = X / 2 - HIGHprev Uses: When the pair currency price may change the direction of movement. Possible constraints of support and resistance that creates plateaus for the currency pair prices. Tendency identification by comparing the present prices according to current day's pivot point and also the prior day's pivot points. ___________
FREE
Wave Box Market Frenquency
Jean Jacques Huve Ribeiro
4.75 (4)
Totally linked to the result of a movement and the duration he had. Its height records how many ticks the asset walked during a given movement, its width shows us the duration that movement had. Its configuration must be in line with the Weis Wave Indicator configuration to observe the movement force and can indicate a possible accumulation or distribution of the movement;
FREE
Stackable VWAP
Flavio Javier Jarabeck
3.8 (5)
Volume Weighted Average Price (VWAP) is a trading benchmark commonly used by Big Players that gives the average price a Symbol has traded throughout the day. It is based on both Volume and price. Additionally we put in this indicator the MVWAP (Moving Volume Weighted Average Price). For those who do not know the usage and the importance od this indicator I recommend a great article about this subject at Investopedia ( https://www.investopedia.com/articles/trading/11/trading-with-vwap-mvwap.asp
FREE
MW Volume
Martin Bittencourt
3.75 (4)
The Martinware Volume indicator plots a colored moving average over volume bars. The coloring uses three colors and can be done in different ways choosable by the user and is applied both to the average as to the volume bars. Three types of coloring are possible: None: no coloring is done Increasing or decreasing: changes the color depending on the current value being bigger or lesser than the previous one Volume relative to average: colors vary if the current volume is bigger or lesser then
FREE
This indicator sums up the difference between the sells aggression and the buys aggression that occurred in each Candle, graphically plotting the waves of accumulation of the aggression volumes.   Through these waves an exponential average is calculated that indicates the direction of the business flow. Note: This indicator DOES NOT WORK for Brokers and/or Markets WITHOUT the type of aggression (BUY or SELL).   Be sure to try our Professional version with configurable features and alerts:  Agr
FREE
Waves Sizer
Flavio Javier Jarabeck
3.67 (3)
Wyckoff fans, enjoy! Ideally to be used with the Weis Waves indicator, but it can be easily used alone, the Waves Sizer puts the range (in resulting Price movement) done by the Price on its market swings. You can control how accurate or loose will be the swings. This tool is very helpful for visually know how much the Price has traveled in your Timeframe. This way you can confront this level of effort with the resulting Volume, etc... Weis Waves indicator: https://www.mql5.com/en/market/pro
FREE
Santa Donchian
Marco Aurelio Cestari
4.2 (5)
Santa Donchian Indicator  is an efficient way to detect support, resistence and break outs in any market. The Donchian channel measures the high and the low of a previously defined range.  Typically, a trader would look for a well-defined range and then wait for the price to break out to either one side for a trade entry trigger. Advantages Never repaints, never backpaints, never recalculates. Works in all symbols and all timeframes. Perfect trend filter for any strategy or expert advisor. Fu
FREE
Weis Wave Double Side
Eduardo Da Costa Custodio Santos
L'indicatore laterale Weis Wave Bouble per MT5 fa parte del toolkit (Wyckoff Academy Wave Market) L'indicatore laterale Weis Wave Bouble per MT5 è stato creato sulla base della già consolidata Weis Wave creata da David Weis. L'indicatore Weis Wave Double Side legge il mercato a ondate come è stato fatto da R. Wyckoff nel 1900. Aiuta a identificare sforzo x risultato, causa ed effetto e domanda e offerta Il suo differenziale è che può essere utilizzato sotto l'asse zero, migliorando ulteriormente
30 USD
LT Weis Waves
Thiago Duarte
5 (11)
The Weis Wave first takes the market volume and then organizes it with the price into Wave charts. It is the only software that will present the true picture of the market before you. If anyone of you, has watched an intraday price movement then you must know that it unfolds in a series of selling as well as buying waves-a procedures tearing down and building up. Wave analysis is an integral part of the trading method. The indicator helps to deal with today’s volatile market. Moreover, it works
FREE
Ultimate Retest
Nguyen Thanh Cong
5 (1)
Introduction The "Ultimate Retest" Indicator stands as the pinnacle of technical analysis made specially for support/resistance or supply/demand traders. By utilizing advanced mathematical computations, this indicator can swiftly and accurately identify the most powerful support and resistance levels where the big players are putting their huge orders and give traders a chance to enter the on the level retest with impeccable timing, thereby enhancing their decision-making and trading outcomes.
FREE
Volume Weighted Average Price or VWAP is an indicator wich shows different average prices on chart. This is very useful to find strong negotiation price areas and as trend following. Configurations: Day, Week and Month - Show different VWAPs according to the period. You can change each line style on "colors" tab. Any doubt or suggestion please contact us. Enjoy! This is a free indicator, but it took hours to develop. If you want to pay me a coffee, I appreciate a lot   <3 PayPal, Skrill, Ne
FREE
Donchian Pro
Paulo Henrique Faquineli Garcia
5 (1)
The Donchian Channel Channels are among the most popular tools of technical analysis, as they visually convey to the analyst the limits within which most price movement tends to occur. Channel users know that valuable information can be obtained at any time, whether prices are in the central region of a band or close to one of the border lines. One of the best known techniques to explore these concepts is Bollinger Bands. However, John Bollinger was not the only one to research the applicatio
FREE
AvgVolumes
Marco Montemari
5 (1)
This indicator is based on Volumes standard indicator, calculates the average of Volumes based on the last N bars set by users, and if the value of the volume is bigger then a set % respect the average a different color will be used. The indicator is shown in a separate indicator window. This version has now a limitation in setting the % about the threshold. If you are interested to set threshold consider to buy the PRO version ( https://www.mql5.com/en/market/product/35925 ) If you want to use
FREE
My Candle Patterns
Francisco Gomes Da Silva
Questo indicatore è una versione demo di My candle completa che può essere scaricata qui: Candle Patterns Creator Con la versione completa, è possibile creare le proprie regole di candle e modificare un pattern di candle tradizionale per renderlo più preciso in base alla propria strategia. Nell'indicatore sono presenti diverse regole di candle di esempio, ma qui ne mostrerò solo alcune: Pattern Rule Candle Green C > O Candle Red C < O Doji C = O Hammer (C > O and (C-O) *2 < O-L and (C-O) *0.5 >
FREE
Description The indicator uses market profile theory to show the most relevant trading zones, on a daily basis. The zones to be shown are LVN (low volume nodes) and POC (point of control). An LVN zone is one which represents price areas with the least time or volume throughout the day. Typically, these areas indicate a supply or demand initiative, and in the future, they can turn into important breakout or retracement zones. A POC zone is one which represents price areas with the most time or vo
FREE
Gli utenti di questo prodotto hanno anche acquistato
Top indicator for MT5   providing accurate signals to enter a trade without repainting! It can be applied to any financial assets: forex, cryptocurrencies, metals, stocks, indices .  MT4 version is here It will provide pretty accurate trading signals and tell you when it's best to open a trade and close it. Watch  the video  (6:22) with an example of processing only one signal that paid off the indicator! Most traders improve their trading results during the first trading week with the help of
125 USD
Price action trading, Trend trading strategies, Trend following indicators, Trend detection, Range identification, Smart Trend Trading System Indicator, Comprehensive trading system, Multi-indicator approach, Trend following strategy, Range reversal strategy, Smart Trend Cloud, Smart Reversal Zones, Trend Breakout Catcher, Smart Trailing Stop, Multi-timeframe trend finder, Complete trading toolkit, Market trend analysis, Range-bound market signals, Confident trading decisions, Price movement in
100 USD
Blahtech Supply Demand MT5
Blahtech Limited
4.54 (13)
Was: $299    Now: $149   Supply Demand uses previous price action to identify potential imbalances between buyers and sellers. The key is to identify the better odds zones, not just the untouched ones. Blahtech Supply Demand indicator delivers functionality previously unavailable on any trading platform. This 4-in-1 indicator not only highlights the higher probability zones using a multi-criteria strength engine, but also combines it with multi-timeframe trend analysis, previously confirmed swi
149 USD
Robos
Namu Makwembo
5 (2)
Big promotion on the Robos, Get yours now Robos Indicator The   ROBOS   indicator is a multi timeframe oscillator that targets the   overbought   and   oversold  regions of a price chart, a signal is indicated by the two lines crossing, compatible with all tradable instruments Latest Release The latest release is the version 4.0 #What's new in version 4.0 ? Features Extreme oversold and overbought levels ROBOS version  4.0  comes with cool new feature , the ability to target on
255 USD
IVISTscalp5
Vadym Zhukovskyi
5 (1)
We present you the iVISTscalp5 indicator, which is not only unique, but also effective in the analysis of trading operations. This indicator is based on time data and is the result of many years of experience and deep analysis of financial markets. The iVISTscalp5 indicator is an excellent assistant for manual trading. Convenience, simplicity and visualization. All the most difficult is hidden inside. We have simplified the settings and use of the iVISTscalp5 indicator as much as possible. The i
500 USD
ICT Analysis, SMC Trading Strategies, Smart Money Concepts, Smart Money Insights,   Institutional Perspective,     Banks and Institutions Liquidity,   Liquidity Analysis, Institutional Trading, Market Predictions, Price Movement Analysis,   Trading with Institutions,  Trend Analysis Tool, Price Action Indicator, Market Structure Analysis, Order Block Detection,   Support and Resistance Levels,   BOS and CHoCH Patterns,  Momentum Shift Indicator, Supply and Demand Zones Locator, Strong Imbalance
100 USD
Advanced Supply Demand MT5
Bernhard Schweigert
4.36 (11)
La migliore soluzione per qualsiasi principiante o trader esperto! Questo indicatore è uno strumento di trading unico, di alta qualità e conveniente perché abbiamo incorporato una serie di funzionalità proprietarie e una nuova formula. Con questo aggiornamento, sarai in grado di mostrare fusi orari doppi. Non solo potrai mostrare una TF più alta, ma anche entrambe, la TF del grafico, PIÙ la TF più alta: SHOWING NESTED ZONES. Tutti i trader di domanda di offerta lo adoreranno. :) Informazioni imp
199 USD
Support and Resistance, Trading System, Indicator, Candlestick Patterns, VWAP, Trend Catcher, Multi-Timeframe Trend, Support Levels, Resistance Levels, Trading Strategies, Complete Trading System, Technical Analysis, Forex Trading, Price Action, Market Trends, Trading Signals, Trend Identification, Swing Trading, Day Trading, Swing Trading Strategies, Technical Indicators, Trading Tools, Trend Confirmation, Entry and Exit Points, Trading Panel, Forex Signals, Trend Reversals, Trading Algorithms
100 USD
XQ Indicator MT5
Marzena Maria Szmit
3.25 (4)
The signal conditions are a combination of three indicators, and XQ Forex Indicators only display  medium and long-term trends . The indicator's efficacy has been improved with the addition of a filter that blocks out false signals. The XQ Forex Indicator can be used on  FX pairs, CFDs, and Cryptocurrencies . There are two type of signals:  Buy or Sell and Big Long or Big Short It is possible to enable sending emails when a major trend-change signal is detected, as well as to display the alerts
179 USD
This is arguably the most complete harmonic price formation auto-recognition indicator you can find for the MetaTrader Platform. It detects 19 different patterns, takes fibonacci projections as seriously as you do, displays the Potential Reversal Zone (PRZ) and finds suitable stop-loss and take-profit levels. [ Installation Guide | Update Guide | Troubleshooting | FAQ | All Products ] It detects 19 different harmonic price formations It plots primary, derived and complementary Fibonacci p
299 USD
The Price Action Finder Multi indicator is a multi-currency and multi-timeframe indicator. It searches for patterns of the Price Action system on all standard time frames at once and on a large (up to 60) number of instruments (currencies, stocks, metals, etc.). The resulting patterns are placed by the indicator in a table at the bottom of the screen. Patterns: At the moment, the indicator contains the following patterns: Outside bar , Inside bar , Pin bar , Force bar , PPR , as well as the In
149 USD
TPA True Price Action indicator reveals the true price action of the market makers through 100% non-repainting signals strictly at the close of a candle! TPA shows entries and re-entries, every time the bulls are definitely stronger than the bears and vice versa. Not to confuse with red/green candles. The shift of power gets confirmed at the earliest stage and is ONE exit strategy of several. There are available now two free parts of the TPA User Guide for our customers. The first "The Basics"
168 USD
Was: $249    Now: $149   Market Profile defines a number of day types that can help the trader to determine market behaviour. A key feature is the Value Area, representing the range of price action where 70% of trading took place. Understanding the Value Area can give traders valuable insight into market direction and establish the higher odds trade. It is an excellent addition to any system you may be using. Blahtech Limited presents their Market Profile indicator for the MetaTrader community.
149 USD
Volume by Price MT5
Brian Collard
5 (2)
The Volume by Price Indicator for MetaTrader 5 features Volume Profile and Market Profile TPO (Time Price Opportunity). Get valuable insights out of currencies, equities and commodities data. Gain an edge trading financial markets. Volume and TPO histogram bar, line and metric charts. TPO letter and block marker charts including split structures. Positioning and styling options to suit the user's needs and context. Volume Profile and Market Profile TPO Point of Control (VPOC and TPOC), Imbalanc
129 USD
Introduction to X3 Chart Pattern Scanner X3 Cherart Pattern Scanner is the non-repainting and non-lagging indicator detecting X3 chart patterns including Harmonic pattern, Elliott Wave pattern, X3 patterns, and Japanese Candlestick patterns. Historical patterns match with signal patterns. Hence, you can readily develop the solid trading strategy in your chart. More importantly, this superb pattern scanner can detect the optimal pattern of its kind. In addition, you can switch on and off individu
250 USD
Tired of plotting support and resistance lines? This is a multi-timeframe indicator that detects and plots supports and resistance lines in the chart with the same precision as a human eye would. As price levels are tested over time and its importance increases, the lines become thicker and darker, making price leves easy to glance and evaluate. [ Installation Guide | Update Guide | Troubleshooting | FAQ | All Products ] Boost your technical analysis Customizable timeframe selection Read pri
149 USD
RubdFx Perfect Reversal , The reversal indicator is used to determine areas of support and resistance by Drawing an arrow with a level of supply and demand ( ReversalZones ). - You will catch more swings by reducing the period, and less swings if you increase period - Mobile, computer and email alerts available . it is not pushed by price which means the arrow will stay in one place,suitable for scalping and long term trading  Also Compatible with all forex paris , BUY RULES;  open a buy positio
159 USD
Introduction to Fractal Pattern Scanner Fractal Indicator refers to the technical indicator that makes use of the fractal geometry found in the financial market. Fractal Pattern Scanner is the advanced Fractal Indicator that brings the latest trading technology after the extensive research and development work in the fractal geometry in the financial market. The most important feature in Fractal Pattern Scanner is the ability to measure the turning point probability as well as the trend probabil
185 USD
"The Squeeze indicator attempts to identify periods of consolidation in a market. In general the market is either in a period of quiet consolidation or vertical price discovery. By identifying these calm periods, we have a better opportunity of getting into trades with the potential for larger moves. Once a market enters into a "squeeze," we watch the overall market momentum to help forecast the market direction and await a release of market energy." The Modified TTM Squeeze Indicator is a modi
149 USD
Gartley Hunter MT5
Siarhei Vashchylka
5 (11)
Gartley Hunter - Indicator for finding harmonic patterns (Gartley patterns) and their projections. The indicator is equipped with an alert system. List of patterns At the moment, the indicator contains patterns:     Alternative bat     Bat     Butterfly     Crab     Cypher     Deep crab     Gartley Indicator control panel The pattern control panel is located in the lower left corner of the screen. See the picture below for a description of the panel. There are Russian and English version
149 USD
This indicator is a perfect wave automatic analysis indicator for practical trading! 黄金实战 案例... The standardized definition of the band is no longer a wave of different people, and the art of man-made interference is eliminated, which plays a key role in strict analysis of the approach.=》Increase the choice of international style mode, (red fall green rise style) The  purchase discount is currently in progress! Index content: 1.Basic wave: First, we found the inflection point of the ba
188 USD
PZ Divergence Trading MT5
PZ TRADING SLU
3.67 (3)
Tricky to find and scarce in frequency, divergences are one of the most reliable trading scenarios. This indicator finds and scans for regular and hidden divergences automatically using your favourite oscillator. [ Installation Guide | Update Guide | Troubleshooting | FAQ | All Products ] Easy to trade Finds regular and hidden divergences Supports many well known oscillators Implements trading signals based on breakouts Displays suitable stop-loss and take-profit levels Configurable oscilla
249 USD
ACB Breakout Arrows MT5
KEENBASE SOFTWARE SOLUTIONS
5 (1)
The ACB Breakout Arrows indicator provides a crucial entry signal in the market by detecting a special breakout pattern. The indicator constantly scans the chart for a settling momentum in one direction and provide the accurate entry signal right before the major move. Get multi-symbol and multi-timeframe scanner from here - Scanner for ACB Breakout Arrows MT 5 Key features Stoploss   and Take Profit levels are provided by the indicator. Comes with a MTF Scanner dashboard which tracks the br
145 USD
Golden Spikes Detector
Batsirayi L Marango
5 (1)
Golden Spikes Detector This indicator is based on an advanced strategy primarily for trading spikes on Boom and Crash Indices. Complex algorithms were implanted to detect high probability entries only. It alerts on potential Buy and Sell entries. To trade spikes on the Deriv or Binary broker, only take Buy Boom and Sell Cash alerts. It was optimised for 5-minute timeframe. Features ·          Sends push notifications to mobile phone ·          Pop up and sound alerts on computer or laptop ·     
150 USD
KT Renko Patterns MT5
KEENBASE SOFTWARE SOLUTIONS
KT Renko Patterns scans the Renko chart brick by brick to find some famous chart patterns that are frequently used by traders across the various financial markets. Compared to the time-based charts, patterns based trading is easier and more evident on Renko charts due to their uncluttered appearance. KT Renko Patterns features multiple Renko patterns, and many of these patterns are extensively explained in the book titled Profitable Trading with Renko Charts by Prashant Shah. A 100% automate
145 USD
Bill Williams Advanced
Siarhei Vashchylka
5 (1)
Bill Williams Advanced is designed to analyze the chart according to Bill Williams' Profitunity system. The indicator analyzes the signals of the AO, AC indicators and places them in the panel in the upper left corner of the chart. In addition, using hot keys, the indicator instantly displays / hides the AO and AC indicators (for more details, see the video instructions). Description Each line of the indicator table represents the signals of the Profitunity system that are valid on the last fi
199 USD
Ace Supply Demand Zone Indicator The concept of supply demand relies on the quantity mismatching between buying and selling volumes in the financial market. Supply and demand zone can provide the good entry and exit. A zone is easier to trade than a line. The supply demand zone can provide the detailed trading plan and the risk management. Its ability to predict market direction is high. There are two distinctive points about Ace Supply Demand Zone Indicator. Ace Supply Demand Zone indicator was
100 USD
Introduction to Fibonacci Volatility Indicator Volatility indicator can help you to detect any statistical advantage for your trading. Especially, if you are trading with Price Action and Price Patterns, then we recommend to use the Volatility indicator together with your strategy. Especically, Fibonacci Volatility indicator combines the market volatiltiy with Fibonacci Analysis to provide you more advanced volatiltiy indicator. Main Features Fibonacci Volatility in Z score Configuration Mode Fi
100 USD
VTrende Pro
Andrii Diachenko
VTrende Pro - MTF indicator for trend trading with a display panel for MT5 *** Videos can be translated into any language using subtitles (video language - Russian) Although the signals of the VTrende Pro indicator can be used as signals of a full-fledged trading system, it is recommended to use them in conjunction with the Bill Williams TS. VTrende Pro is an extended version of the VTrende indicator. Difference between Pro version and VTrende: - Time zones - Signal V - signal 1-2 waves
697 USD
EFW Pattern Trader is a powerful pattern scanner for Forex and Stock trading. The pattern detection in EFW Pattern Trader uses the Fractal Wave Theory, which captures the endless up and down movement of the market. Therefore, EFW Pattern Trader can be considered as the robust price action indicator. Any patterns in EFW Pattern Trader can be backtested visually in your strategy tester. Visual backtesting with pattern will show you how pattern will likely behave in the live trading. Therefore, you
100 USD
Altri dall’autore
FX Volume
Daniel Stein
4.59 (34)
Ricevi il tuo aggiornamento quotidiano sul mercato con dettagli e schermate tramite il nostro Morning Briefing qui su mql5 e su Telegram ! FX Volume è il PRIMO e UNICO indicatore di volume che fornisce una visione REALE del sentiment del mercato dal punto di vista del broker. Fornisce informazioni straordinarie su come gli operatori di mercato istituzionali, come i broker, sono posizionati sul mercato Forex, molto più velocemente dei rapporti COT. Vedere queste informazioni direttamente sul vo
99 USD
FX Power MT5 NG
Daniel Stein
5 (1)
Ricevi il tuo aggiornamento quotidiano sul mercato con dettagli e schermate tramite il nostro Morning Briefing qui su mql5 e su Telegram ! FX Power MT5 NG è la nuova generazione del nostro popolare misuratore di forza delle valute, FX Power. Cosa offre questo misuratore di forza di nuova generazione? Tutto ciò che avete amato dell'FX Power originale IN PIÙ Analisi della forza di ORO/XAU Risultati di calcolo ancora più precisi Periodi di analisi configurabili individualmente Limite di calcolo pe
99 USD
Ricevi il tuo aggiornamento quotidiano sul mercato con dettagli e schermate tramite il nostro Morning Briefing qui su mql5 e su Telegram ! FX Power MT4 NG è la nuova generazione del nostro popolare misuratore di forza delle valute, FX Power. Cosa offre questo misuratore di forza di nuova generazione? Tutto ciò che avete amato dell'FX Power originale IN PIÙ Analisi della forza di ORO/XAU Risultati di calcolo ancora più precisi Periodi di analisi configurabili individualmente Limite di calcolo pe
99 USD
FX Trend MT5
Daniel Stein
4.62 (34)
Vuoi diventare un trader forex a 5 stelle costantemente redditizio? 1.   Leggi la descrizione di base del nostro semplice   sistema di   trading   e il  suo importante aggiornamento della strategia nel 2020 2.   Invia uno screenshot del tuo acquisto per ottenere il tuo invito personale alla nostra esclusiva chat di trading FX Trend   mostra la direzione della tendenza, la durata, l'intensità e la valutazione della tendenza risultante per tutti i time frame in tempo reale. Vedrai a colpo d'occ
66 USD
FX Trend
Daniel Stein
4.84 (94)
Vuoi diventare un trader forex a 5 stelle costantemente redditizio? 1. Leggi la descrizione di base del nostro semplice sistema di trading   e il  suo importante aggiornamento della strategia nel 2020 2. Invia uno screenshot del tuo acquisto per ottenere il tuo invito personale alla nostra esclusiva chat di trading FX Trend mostra la direzione della tendenza, la durata, l'intensità e la valutazione della tendenza risultante per tutti i time frame in tempo reale. Vedrai a colpo d'occhio in qu
66 USD
Lighthouse MT5
Daniel Stein
5 (17)
Vuoi diventare un trader forex a 5 stelle costantemente redditizio? 1.   Leggi la descrizione di base del nostro semplice   sistema di   trading   e il  suo importante aggiornamento della strategia nel 2020 2.   Invia uno screenshot del tuo acquisto per ottenere il tuo invito personale alla nostra esclusiva chat di trading Lighthouse   è un sorprendente indicatore di supporto e resistenza preciso e affidabile. Mostra i livelli di trading più importanti e li disegna in base alla loro rileva
66 USD
Trade Manager MT5
Daniel Stein
4.33 (3)
Vuoi diventare un trader forex a 5 stelle costantemente redditizio? 1.   Leggi la descrizione di base del nostro semplice   sistema di   trading   e  il  suo importante aggiornamento della strategia nel 2020 2.   Invia uno screenshot del tuo acquisto per ottenere il tuo invito personale alla nostra esclusiva chat di trading Questo Trade Manager   è l'aggiunta ideale per tutti gli utenti   FX Trend   che amano utilizzare una gestione completamente automatizzata delle operazioni. Rileva immed
66 USD
SIEA Zen MT4
Daniel Stein
SIEA ZEN - major update Default risk live signal   Dynamic risk live signal The keys to success   in trading Forex are discipline, patience and a clear edge, as we have with our unique real trading volume analysis. That's our experience of 10 years of trading Forex, and  all these key factors are summarized in the   S tein   Investments   E xpert   A dvisor ( SIEA ) series. SIEA ZEN  provides a very balanced risk-reward ratio and survives all market circumstances easily - even the m
599 USD
SIEA Zen
Daniel Stein
4 (4)
SIEA ZEN - major update   Default risk live signal     Dynamic risk live signal The keys to success   in trading Forex are discipline, patience and a clear edge, as we have with our unique real trading volume analysis. That's our experience of 10 years of trading Forex, and  all these key factors are summarized in the S tein   Investments E xpert A dvisor ( SIEA ) series. SIEA ZEN  provides a very balanced risk-reward ratio and survives all market circumstances easily - even th
599 USD
Crosshair è uno strumento fantastico che semplifica la nostra analisi del grafico portando le candele dei prezzi perfettamente in linea con i valori degli indicatori nelle sottofinestre. È possibile attivarlo e disattivarlo tramite una singola pressione della "C" della vostra tastiera, e fornisce una modalità righello per misurazioni precise che può essere attivata e disattivata tramite il tasto "R" della vostra tastiera. Guardate il nostro breve video tutorial incorporato qui sotto per ved
66 USD
Vuoi diventare un trader forex a 5 stelle costantemente redditizio? 1. Leggi la descrizione di base del nostro semplice sistema di trading e  il  suo importante aggiornamento della strategia nel 2020 2. Invia uno screenshot del tuo acquisto per ottenere il tuo invito personale alla nostra esclusiva chat di trading Questo Trade Manager è l'aggiunta ideale per tutti gli utenti FX Trend che amano utilizzare una gestione completamente automatizzata delle operazioni. Rileva immediatamente le tu
66 USD
Lighthouse
Daniel Stein
4.85 (93)
Vuoi diventare un trader forex a 5 stelle costantemente redditizio? 1. Leggi la descrizione di base del nostro semplice sistema di trading   e il  suo importante aggiornamento della strategia nel 2020 2. Invia uno screenshot del tuo acquisto per ottenere il tuo invito personale alla nostra esclusiva chat di trading Lighthouse è un sorprendente indicatore di supporto e resistenza preciso e affidabile. Mostra i livelli di trading più importanti e li disegna in base alla loro rilevanza. Se u
66 USD
SI Connect MT5
Daniel Stein
5 (3)
SI Connect è un'utility che stabilisce la connessione ai nostri server per utilizzare FX Volume o i sistemi di trading SIEA. Istruzioni tecniche per preparare il vostro terminale all'uso di SI Connect Consentire le richieste web e inserire https://stein.investments nell'elenco degli URL consentiti in Opzioni terminale -> Sottocategoria Expert Advisors . Hai bisogno di una sola istanza EA in esecuzione per ogni terminale, ma deve funzionare costantemente in background per prendere gli ultimi da
FREE
SI Connect
Daniel Stein
5 (2)
SI Connect è un'utility che stabilisce la connessione ai nostri server per utilizzare FX Volume o i sistemi di trading SIEA. Istruzioni tecniche per preparare il vostro terminale all'uso di SI Connect Consentire le richieste web e inserire https://stein.investments nell'elenco degli URL consentiti in Opzioni terminale -> Sottocategoria Expert Advisors . Hai bisogno di una sola istanza EA in esecuzione per ogni terminale, ma deve funzionare costantemente in background per prendere gli ultimi da
FREE
SIEA Pro MT4
Daniel Stein
3.67 (3)
Get more information, like FAQs, backtest reports and tips for the right DST/GMT settings in  our SIEA FAQ Send a screenshot of your purchase, and you'll get the set files for   SIEA ZEN   and   SIEA MAX .  So you'll have  3 SIEAs in 1. MT4 can't execute multi-symbol strategies in its strategy tester. Please use the  SIEA MT5 versions  to run realistic real-tick multi-symbol backtest. The keys to success   in trading Forex are discipline, patience and a clear edge, as we have with our unique
499 USD
SIEA Max MT4
Daniel Stein
SIEA MAX  provides a balanced risk-reward ratio and survives all market circumstances easily - even the most critical ones like Corona, Brexit, etc. The system's patience and discipline are rewarded with great profits for its users. That's why we called it MAX. MT4 isn't capable of executing multi-symbol strategies in its strategy tester .  We recommend using the   SIEA MT5 versions   to run realistic real-tick multi-symbol backtest. Get more information, like FAQs, backtest reports and tips fo
299 USD
Crosshair
Daniel Stein
Crosshair è uno strumento fantastico che semplifica la nostra analisi del grafico portando le candele dei prezzi perfettamente in linea con i valori degli indicatori nelle sottofinestre. È possibile attivarlo e disattivarlo tramite una singola pressione della "C" della vostra tastiera, e fornisce una modalità righello per misurazioni precise che può essere attivata e disattivata tramite il tasto "R" della vostra tastiera. Guardate il nostro breve video tutorial incorporato qui sotto per ved
66 USD
SIEA Max
Daniel Stein
1 (2)
The keys to success in trading Forex are discipline, patience and a clear edge, as we have with our unique real trading volume analysis. That's our experience of 10 years of trading Forex, and all these key factors are summarized in the Stein I nvestments Expert Advisor (SIEA) series. SIEA MAX   provides a balanced risk-reward ratio and survives all market circumstances easily - even the most critical ones like Corona, Brexit, etc. The system's patience and discipline are rewarded with great
299 USD
SIEA Pro
Daniel Stein
4.46 (13)
Get more information, like FAQs, backtest reports and tips for the right DST/GMT settings in  our  SIEA FAQ Send a screenshot of your purchase, and you'll get the set files for   SIEA ZEN   and   SIEA MAX .  So you'll have  3 SIEAs in 1. The keys to success   in trading Forex are discipline, patience and a clear edge, as we have with our unique real trading volume analysis. That's our experience of 10 years of trading Forex, and  all these key factors are summarized in the   S tein   Invest
499 USD
Filtro:
Oliver Henry
585
Oliver Henry 2023.07.24 22:20 
 

Very good indicator and totally unique on the retail forex market. The insight a trader can get from this is a real edge for trading. The support is also very good as are the daily updates that are published on the chat group.

Daniel Stein
119598
Risposta dello sviluppatore Daniel Stein 2023.07.24 22:28
Thank you so much for your positive feedback. It's highly appreciated. 🙏
bandelero
354
bandelero 2023.06.16 16:15 
 

I have now closed the second week of trading with FX Power and FX Volume with net gain of 2.7%. I am really pleased how the indicators gives me a quick overview of the market and help me to choose the relevant currency to trade for the day.

Daniel Stein
119598
Risposta dello sviluppatore Daniel Stein 2023.06.17 12:54
Thank you so much for your wonderful feedback. 🙏
Khuman Bakhramirad
8827
Khuman Bakhramirad 2023.05.18 13:15 
 

its an amazing indicator, once you combine it with other tools its very good.

Daniel Stein
119598
Risposta dello sviluppatore Daniel Stein 2023.05.18 13:23
Thank you so much for your positive feedback. It's highly appreciated. 🙏
Oliver Hesse
1021
Oliver Hesse 2022.09.22 21:26 
 

I am writing this review as an overall review of the FX Trend, FX Power and Lighthouse indicators, as the authors have combined them into the STS strategy as a whole set-up. I will not write the review as text, but will list the advantages and disadvantages. + good way to get the trend of different time frames at a glance (FXT) various visualized SL setting options (FXT) great opportunities to display the currency pair strengths based on freely selectable time periods and therefore also to place good entries (delta crosses/FXP) unique insight into the volume of individual currency pairs (FXV) - none of the Stein tools can be saved as a template in such a way that the panels of the various tools look the same or are in the same place after closing and reopening the template (all FX) Buttons remain objectively on the chart, although the respective indicator has been deleted (LH) if you use these tools on different screen sizes, it can happen that the font of the panel exceeds the frame of the panel (FXT and LH) If the authors decide to no longer provide the data for the volume indicator, all volume-based indicators and EAs by Stein will become unusable, no matter what promises are made on the official site (FXV) In principle, the LH indicator has 3 different display levels. However, these only give the trader a rough indication of where there might be significant SR levels. These levels are broken as often as they are resisted. They give the user a maximum 50/50 rating. Many users, including me, also complain about the inaccuracy of the SR lines. Drawn SR zones would also make more sense than delicate lines. No SR level focuses within a 1 pip line. In addition, it is also disturbing that the lines cross the entire chart and SR lines are visualized that are several hundred pips away from the current price (LH) there is a telegram chat where the functions and the interaction of the tools mentioned can be discussed. This chat is made up of 600 people, never more than the same 10 people posting (with slight fluctuation). In the meantime, the library is so full of images from past conversations that every question from newcomers is answered with: "look at the library". As a new chat member, you have to be prepared to no longer receive personal help, but to browse through tons of image and text material. Unfortunately, the chat rules are also strangely regulated by the author. On the one hand, masses of third-party tools can be found in the library, on the other hand, the author does not want any products linked that do not do justice to the purpose of the group... discussing the Stein Tools. This is strange in many respects, since, as I said, it has happened a thousand times before that foreign tools have been uploaded and, secondly, every new interested party should be absolutely clear that you definitely don't get a setup with the compilation of Stein tools, which one enough to get rich. Unfortunately, this is completely absent in the group. To work out a setup together (from Stein Tools and others) that can ultimately lead to success. The fact is that no money can be made with the STS strategy shown on the blueball side. That's simply not enough that you have to consider as a retailer (fundamentals, MM...) The biggest minus point for me, however, is that I addressed various things regarding object-related errors (template capability) several months ago. Unfortunately, the statement was already a year ago that this is known, but no more changes are made to these tools. All should be redisgned once, but without time limits. So it could be weeks or years. Anyone who would like to know more about what I mean is welcome to contact me personally. Finally, I can say that I have been using all the tools for 3 years and can live with the bugs. What I can't live with is that the authors have known these for several years, but they are not turned off and that the author basically assumes that I'm the only one with these problems.

Daniel Stein
119598
Risposta dello sviluppatore Daniel Stein 2022.09.23 09:15
Oh, Oliver, I'm so tired of your childish attitude, but you force me to clarify some things for the public. You bought some tools and NOT us or our company. This means we do NOT have to code anything you think is an improvement. Of course, we take care of bugs if we can reproduce them. Try it yourself by opening a blank new chart and try to reproduce the issue you think of it's a bug. If everything works on this new chart, it's a problem with the setup you created. That's what we explained so often.
And then there are technical limitations of our current product series, which hundreds of other users can easily live with but not you. We know them and designed a new panel technique already available at FX Volume and will be available with the next generation of our other tools. You ignore that there are hundreds of other users besides you. A fundamental redesign of a productive tool is too risky, and that's why every creator, author and software company provides an entirely new version every now and then. So the "old" users are happy, and the new generation users are pleased with the new features. And everyone can switch or use both as they want. I doubt you'll ever understand that, but we honestly don't care. We had endless chats with you, and it's simply hopeless, so please accept that we, as a company, have our own plans for our customers and products. Our chat rules are fair and transparent, and doing marketing for other publishers is simply unacceptable. Besides that, everyone gets the help he needs, but it's clear that we don't have the time to offer individual coaching; hence we have the central Link Library with useful basic information for all users. If there are questions, users can drop them in the group, and other more experienced users or we answer. We're happy to have constantly profitable traders taking their trades solely based on our tools and sharing their knowledge with the crowd. If this isn't enough for you to get rich, we can't help you. Getting rich is a question of attitude and posting your "review" on all 4 product pages makes it even more evident that this is something personal because you don't get your will. Enjoy the audience. We're done with you.
Robert Torres Jr
1541
Robert Torres Jr 2022.06.15 07:07 
 

I am beyond impressed with the pre-purchase support that I have received thus far from Daniel. I've reviewed the telegram groups and I bought the Lighthouse, Powerplay Trade Manager, SIEA Pro, FX Power, FX Trend, and FX Volume (Did I miss any necessary tool?) I am excited to start learning to trade according to this strategy. I'll give more feedback as I start my trading journey with the Stein Investment Group of Traders.

Lester David Saldana Reyes
338
Lester David Saldana Reyes 2021.12.20 16:55 
 

Muy bueno, hace pocas horas lo instalé y está dando buenos resultados, espero siga así. Estaré actualizando la información y datos. La respuesta del creador de este indicador es rápida.

Nick167
49
Nick167 2021.05.22 00:27 
 

I purchased Stein Investments tools for MT5, also FX Volume. And they make a good impression. I learn to use them effectively. I already have a few questions that I will gladly ask after adding me to the forum :) I know for sure that one more application would be useful, which would give signals on the basis of all the others, connecting them together. I mean calculating the most precise inputs and outputs based on FX Power, FX Volume and FX Trend. Perhaps it will be an improved version of Trade Manager? That's a question for Daniel :)

Daniel Stein
119598
Risposta dello sviluppatore Daniel Stein 2021.05.24 10:43
Hi Nick, I sent you the invitation to our group chat. In the Link Library of this chat, you'll find a link to the STS dashboard, a tool that summarizes the information of the individual indicators and alerts you based on your individual settings. Best regards, Daniel
Alex East
100
Alex East 2021.02.19 17:58 
 

I have been using FX Volume for around 4-5 months and I can not rate it highly enough. Along, with the rest of Stein's tools they were a real gamechanger for me after years of struggling to find an edge in the market and personally I feel that FX Volume is the most powerful of the lot. Customer service is superb - any issues at all and Daniel is always willing to help. Regular updates - the indicator just keeps on getting better. NB: Like with any indicator, Steins suite of tools are best used in conjuction with technical analysis. If used in this way they are extremely powerful.

Luke Perrett
3278
Luke Perrett 2021.02.09 23:05 
 

Amazing tool. Great insight into the market. Continually updating to get a closer edge. No crap telegram group. Great team behind all of Steins products. Find me a better product than this. Good luck. Keep up the amazing work Stein team, we need you!!

Andre Gomes
2475
Andre Gomes 2021.02.06 20:05 
 

Excellent tool. I cannot thank Daniel and Alain enough for building this amazing tool, which truly gives you and edge to trade forex markets.

CaesarX
304
CaesarX 2021.01.10 09:28 
 

FxVolume has become the most important tool at my disposal, I simply couldn't go without it

Boriwan
641
Boriwan 2020.10.26 20:10 
 

Отличная работа! Спасибо!

Joshua Jeffries
123
Joshua Jeffries 2020.10.22 15:31 
 

I have had this indicator now for the best part of 6 months. I find the insights extremely useful and has saved my skin a few times. Trades i would've normally taken nullified by this indicator. I find it great for swing trading as I can see the volume changing in real time and start to move in the direction i am anticipating. Used in conjunction with the other tools in the box you will find great results. The community is top notch and also run community projects for EA's and Dashboards, the subscription alone is worth that. There are several strategies to use the tools and suits every trader. We have low TF traders in the group M1-M5 and also people like me H1 - D1, and we all seem to be getting great results! For what you get, the price alone is absolutely a steal, it will add so much value to your trading i can't even describe. Since starting my account is up over 500% so yeah, speaks for itself. If you are interested in the closed thing you'll get to an institutional tool on MQL, well, this is it.

The most useful info are

LOTS

Percentage of long trades

Once you see these increasing for one pair, it is almost a sure thing the price is going to follow. The subscription is so cheap you can't not try it. I can't thank Daniel and the guys in the group enough!

Stephan Grobler
147
Stephan Grobler 2020.08.29 12:58 
 

Excellent tool!

Aravind Kolanupaka
8495
Aravind Kolanupaka 2020.06.27 18:59 
 

So many ways to use the data and confirm trades.

RDI
1482
RDI 2020.04.01 22:04 
 

Great Indicator . Thanks Daniel!!

Rispondi alla recensione
Versione 4.55 2023.08.30
Fixed bug when symbols alert enabled
Versione 4.53 2023.08.01
Added INSTANCE_ID input parameter

Fixed GOLD bug, shifting all currencies data
Versione 4.52 2023.07.31
Fixed iCustom call, sometimes displaying the panel

Added Gold input parameters, and updated to use last framework changes
Versione 4.50 2023.07.26
Fixed invalid pointer, framework bug when no history lines are displayed

Fixed bug in loading FXV parameters
Versione 4.48 2023.07.24
Fixed minor bugs

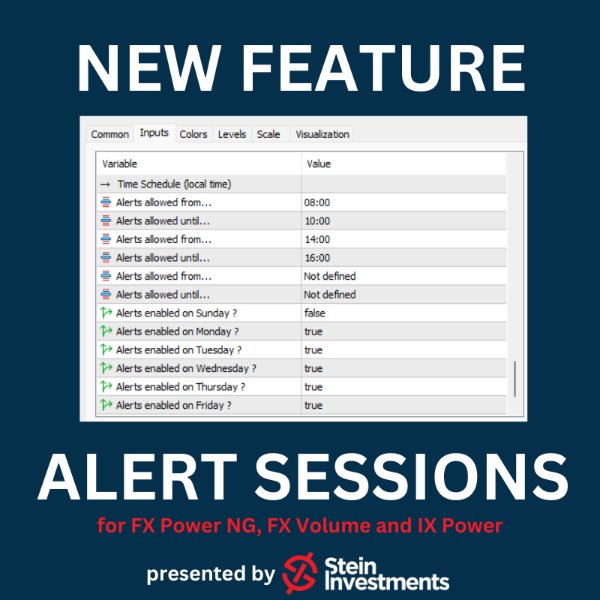
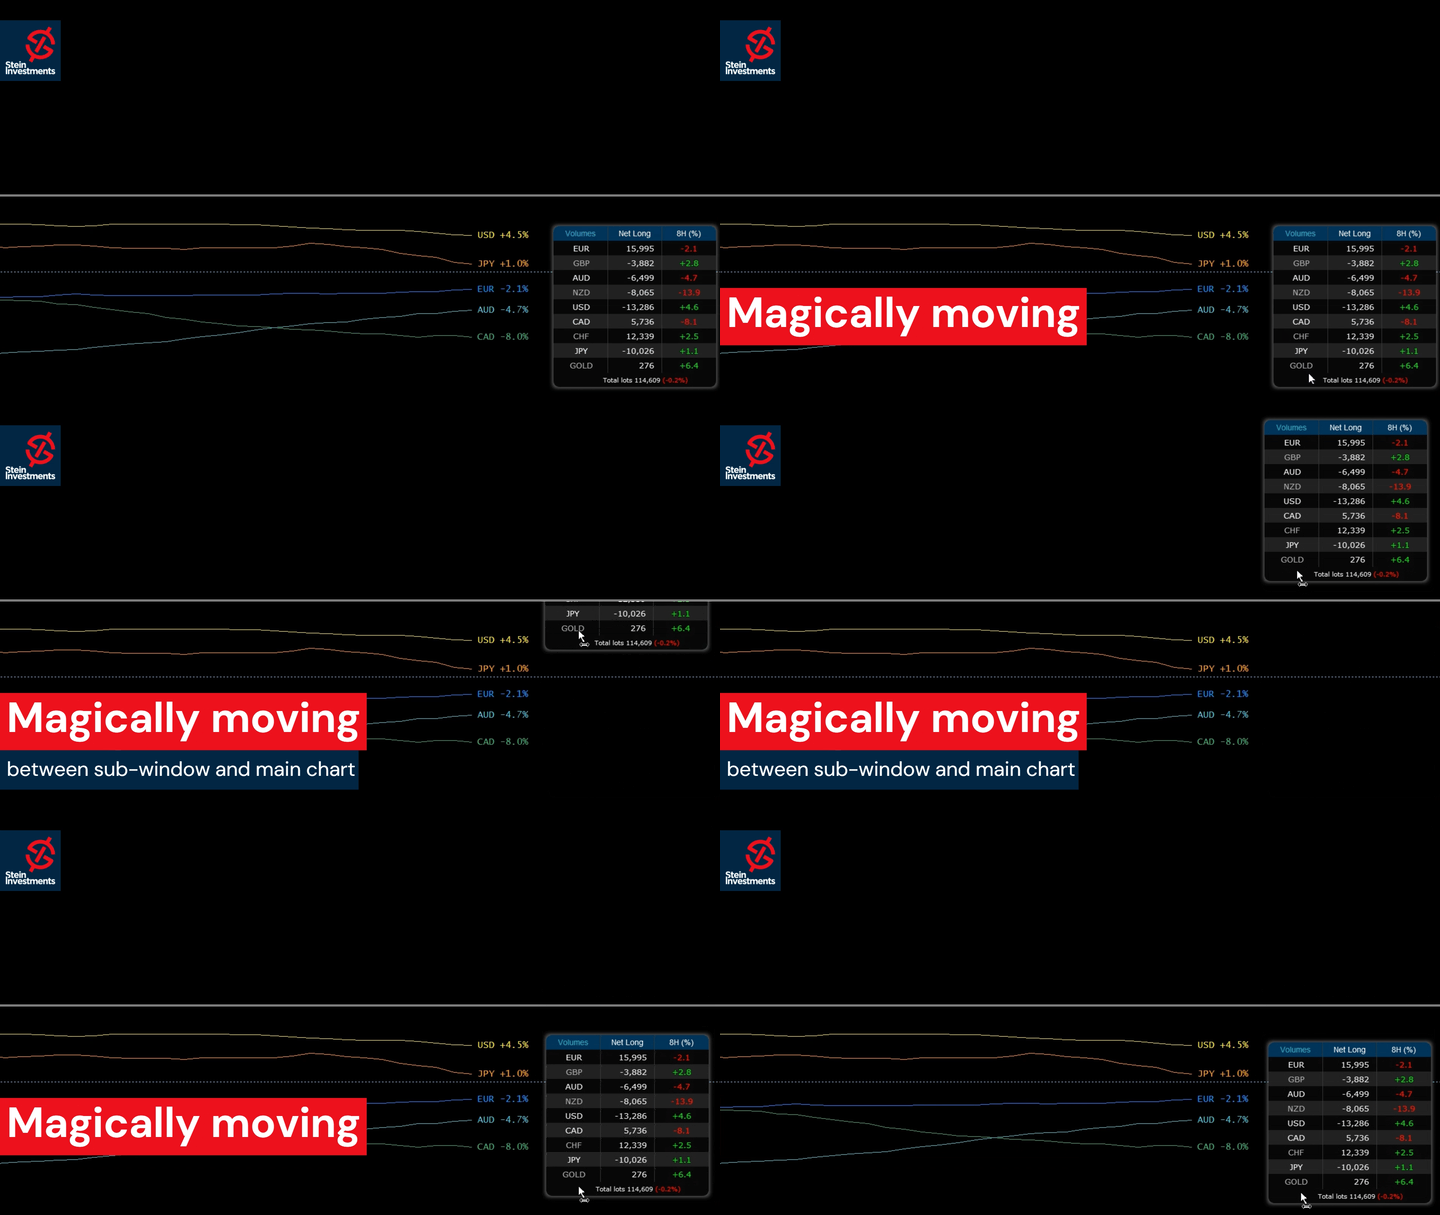
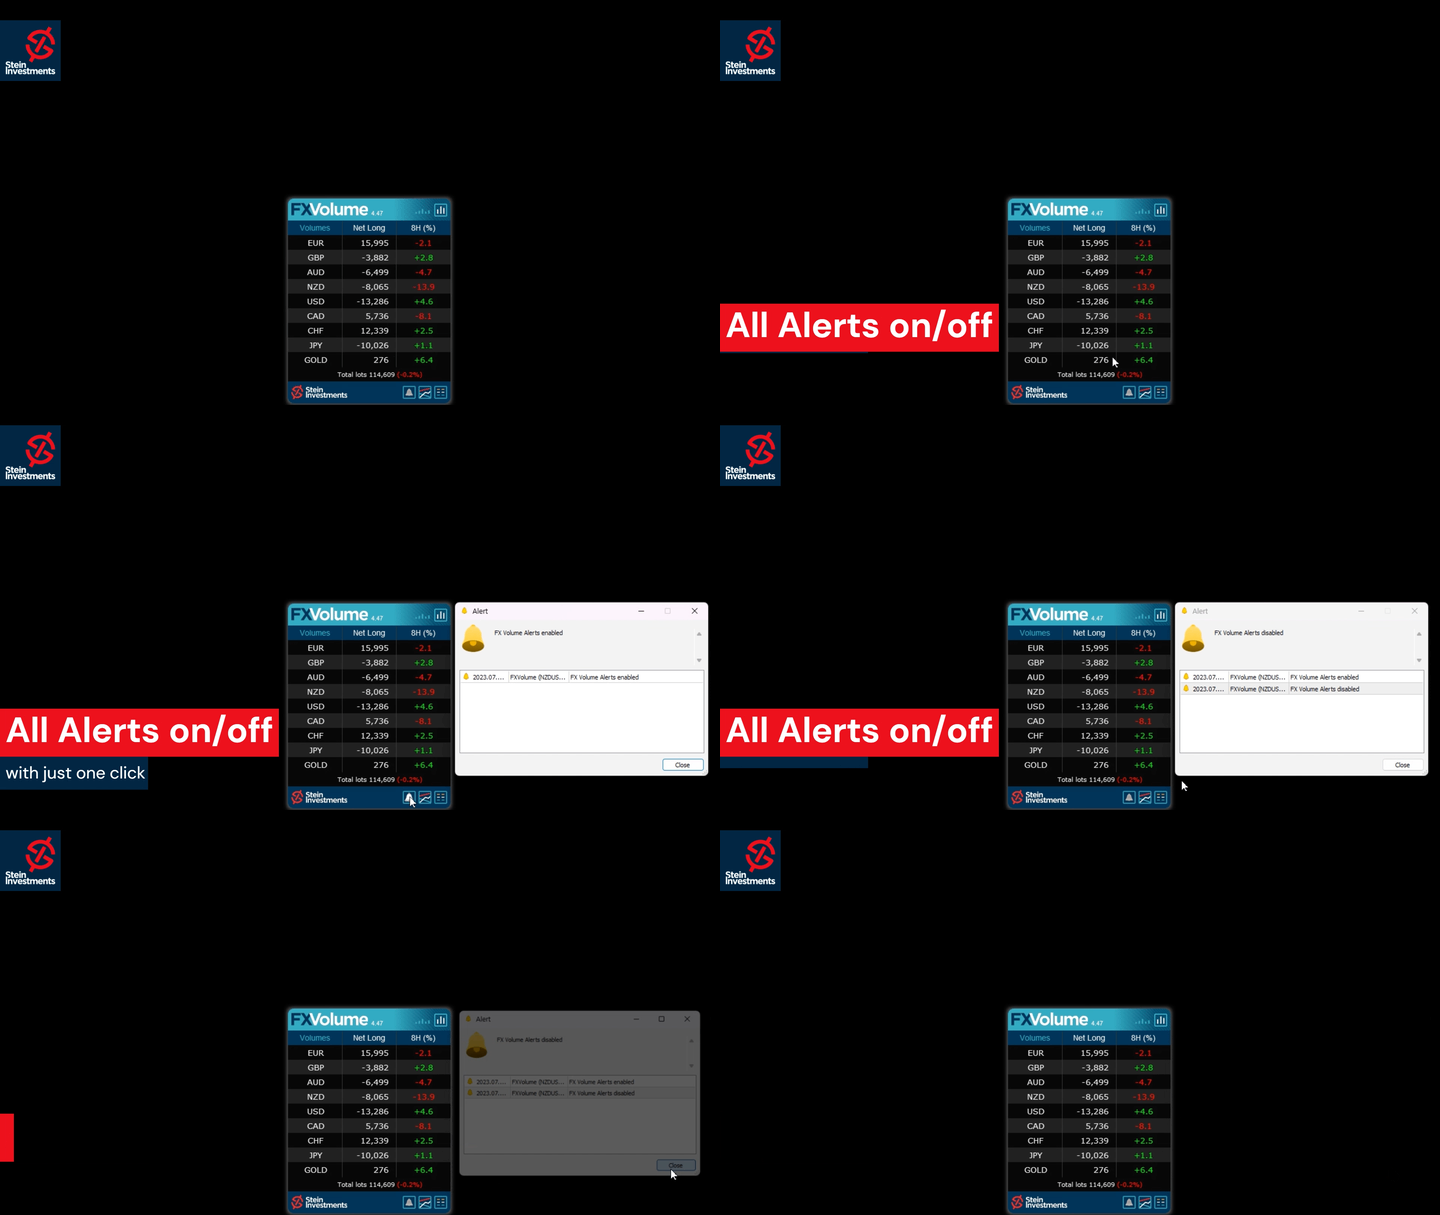
Added an alert button in the panel

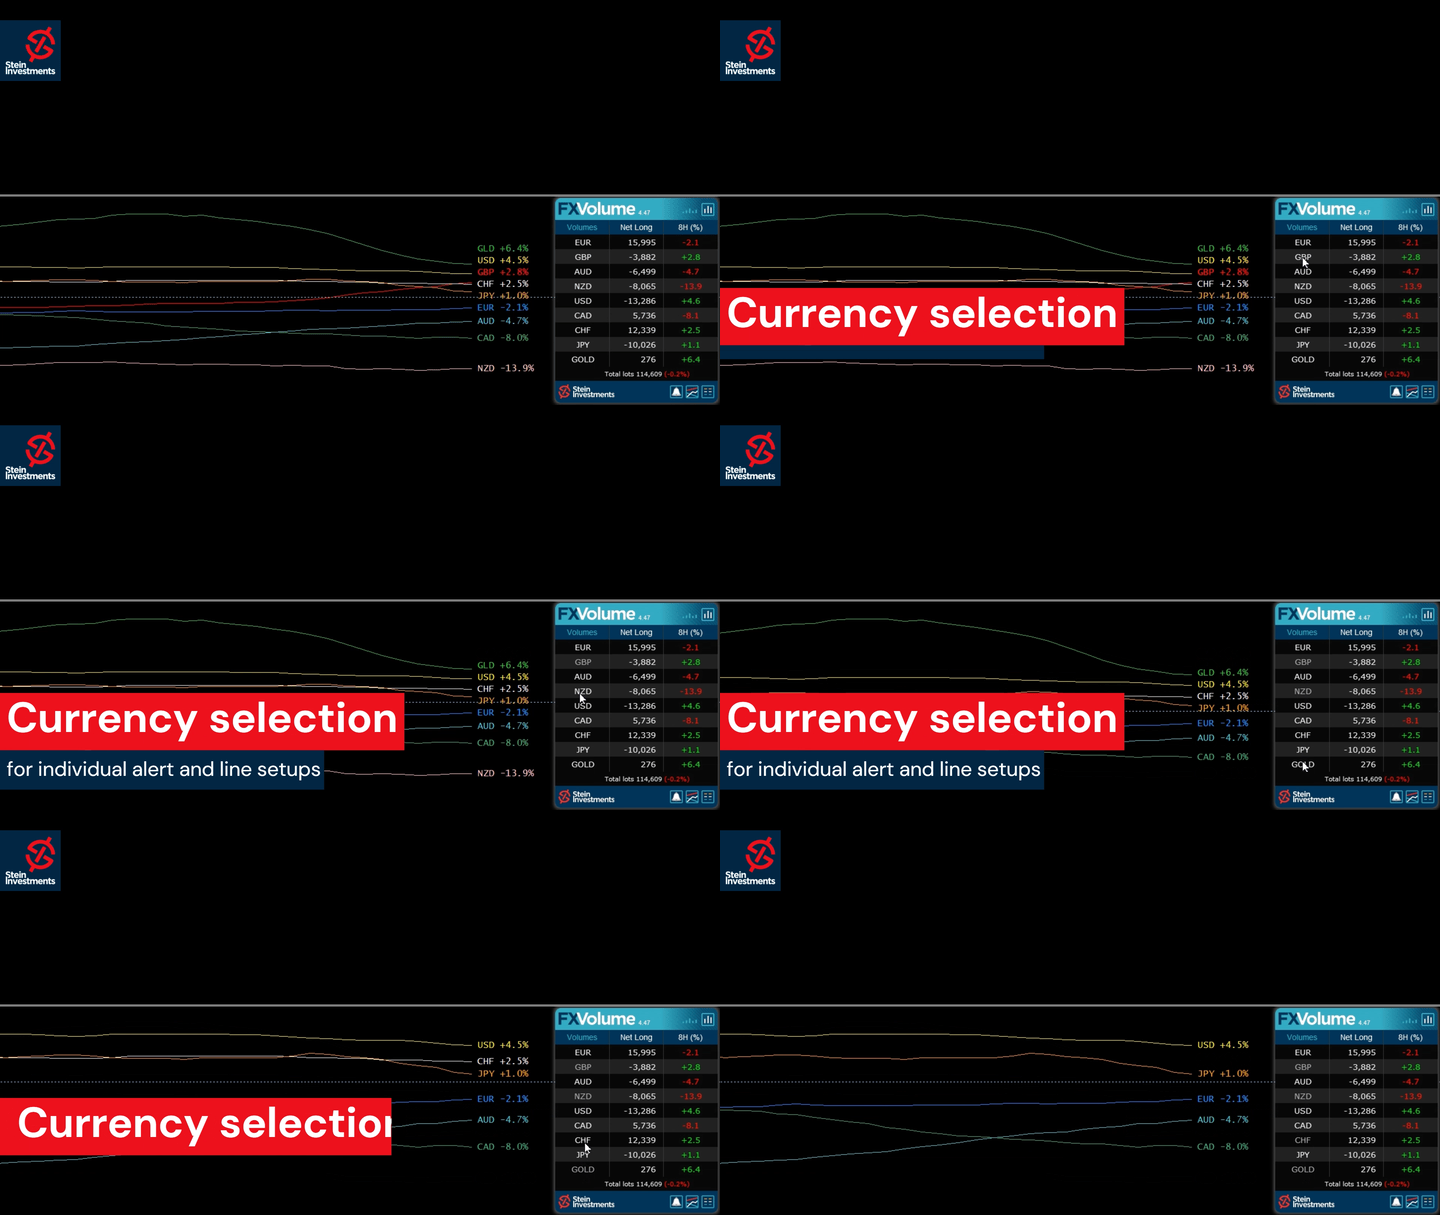
Alerts are now individually configurable according to currencies selected

Update with last framework and generic changes

Changed input parameters (without effect on iCustom requests)

Changed currency sorting in the panel following a logical convention for symbol names
Versione 4.42 2023.06.01
Fixed GUI DPI adjustment bug
Versione 4.41 2023.06.01
⚠️Due to necessary changes in our panel management, you have to reconfigure your charts once after the update⚠️

New Features
Added history mode "Net Long % change"
Added new main panel view "Net long % change"
Added alerts for "Net long % change" drop & rise

Changed indicator label on chart to display one decimal at % values
Changed indicator digits according to history mode
Changed the zoom factor to use % values
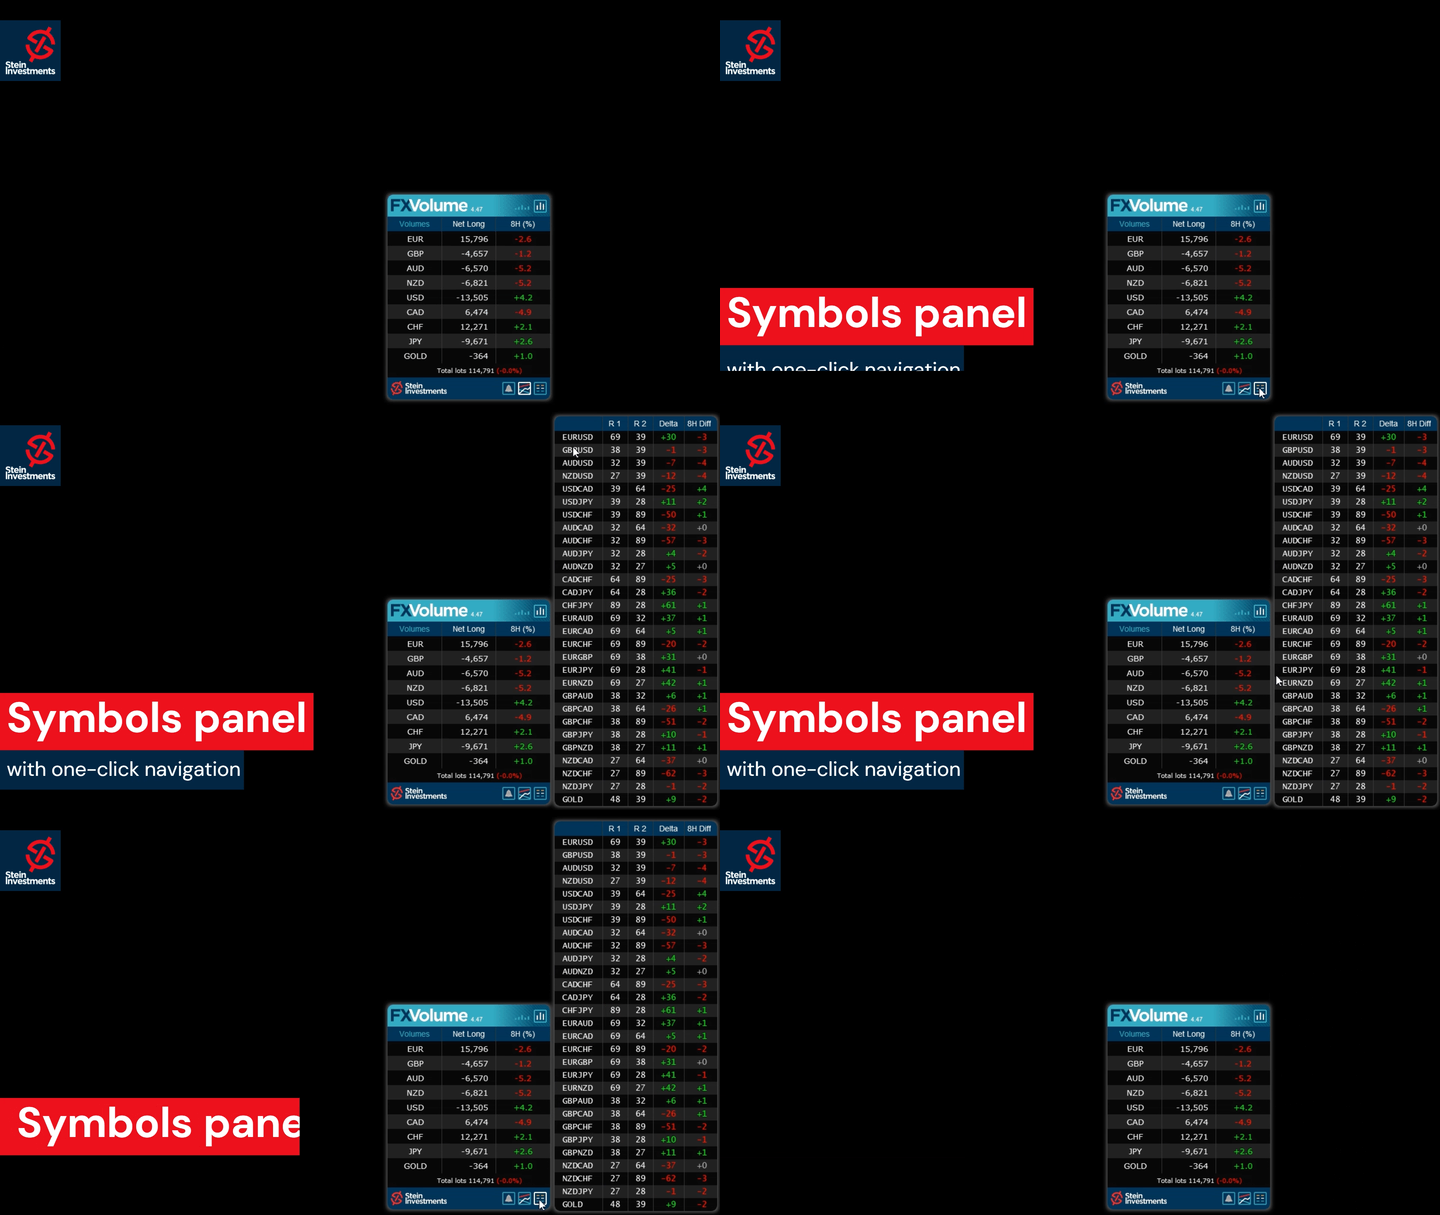
Symbols list refactoring as a new panel


Graphics
New rounded corner panel design.
Added a different color for the "Past" data column.
Added input for panel back color if the auto-scheme is disabled
Improved plot labels display to avoid overlapping. (MT5 only)


Under the hood
Apply complete internal refactoring
Apply the last framework update
Versione 4.10 2022.03.08
Fixed resource loading issue on some Mac/Linux systems

Fixed graphical panel bug when missing past data
Versione 4.0 2022.03.02
FX Volume 4.0 comes with two additional features.

1. The option to use the internal comparison calculation on a minute basis which allows comparison below our previous minimum of 1 hour.

2. Inspired by our fellow trader Luke, we created a Net Long Volume view including history lines to understand better how the Net Long volume correlates with the market moves we see on the chart.

Check our Stein Investments YouTube channel to see a video of the new features.

We're sure you'll like the new features.
Versione 3.58 2021.09.01
Optimized FX Volume to be fully compatible with MT4/MT5 templates
Versione 3.53 2021.05.08
Transition version to use data in common data folder

Fixed bug with GMT when running FX Volume on a weekend for the first time

Optimizations when used as free demo version in the strategy tester


Versione 3.50 2021.04.08
Fixed minor bug when alerts are enabled
Versione 3.49 2021.04.01
This update contains the following changes:

- New Alert options based on Long and Short Volume
- New Alert filters based on the dominance of one side available,
i.e. if Volume Long is bigger than Volume Short, you'll get only alerts for the Volume Long side
- Improved communication with the new SI Connect 2.x
- Optimized settings managements

and these changes are related to the strategy tester usage

- Fixed current candle update bug
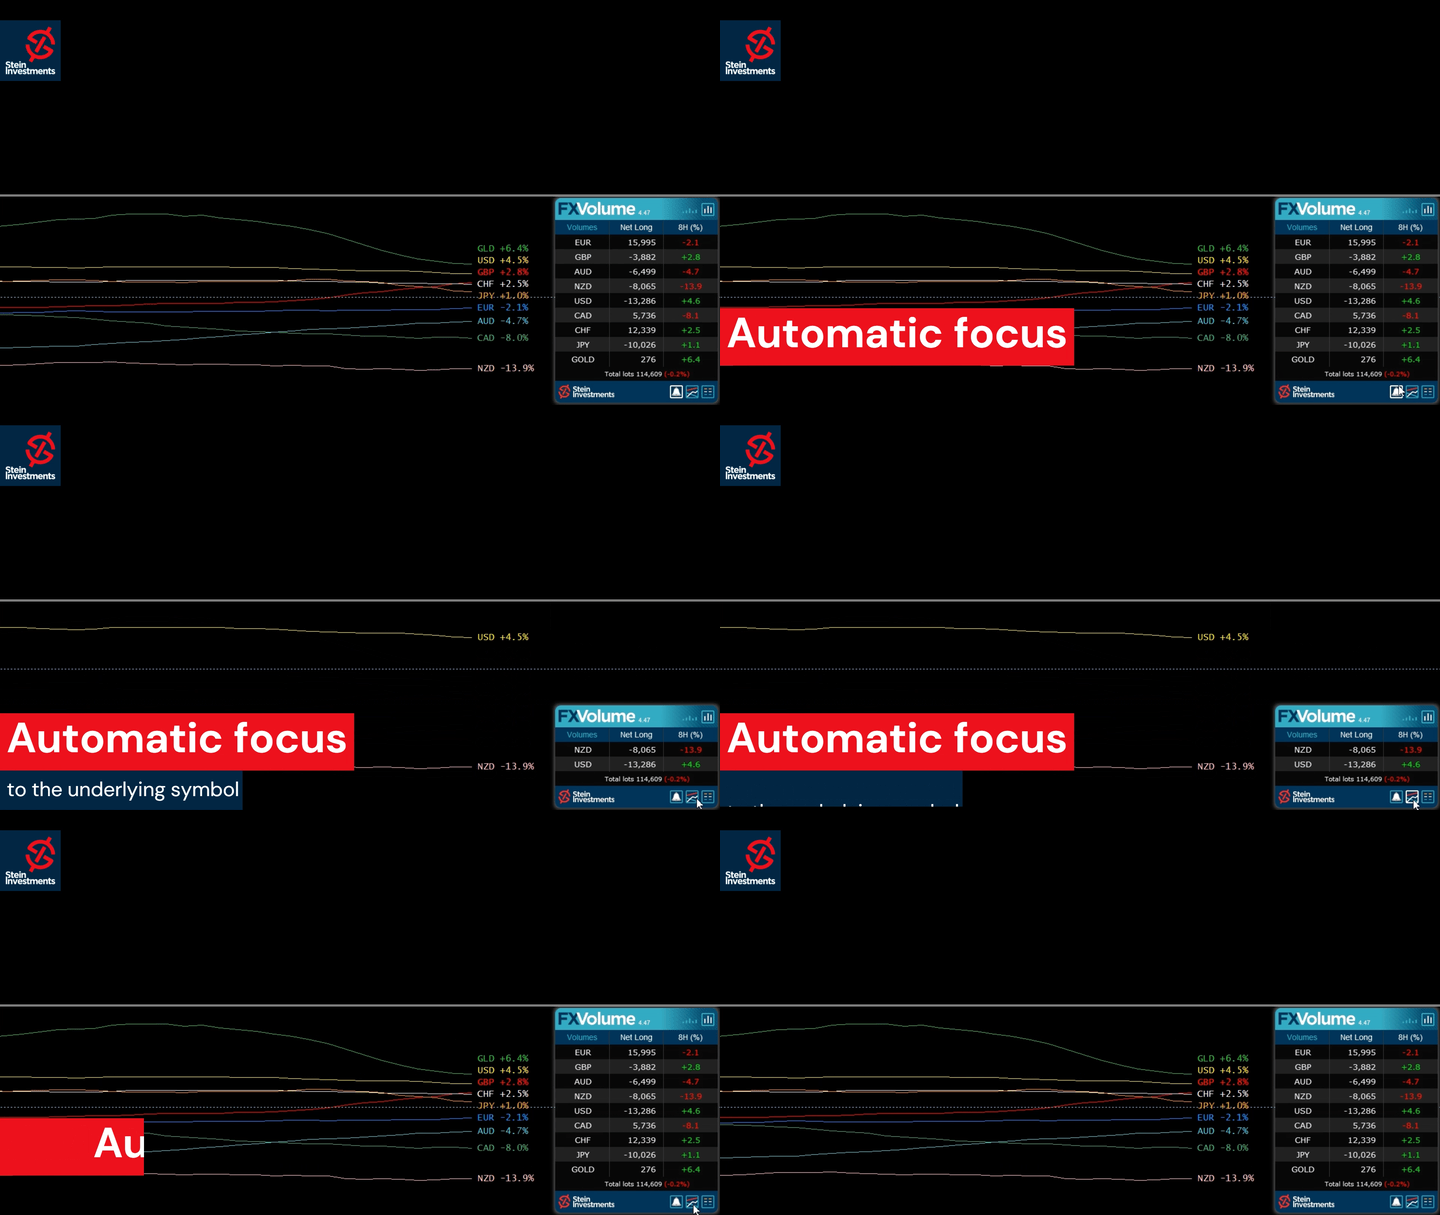
- Added parameter to start with a focus on chart currencies
- Improved backtesting performance
Versione 3.35 2021.03.11
Fixed M1 issue when used in the strategy tester
Versione 3.34 2021.03.10
Fixed row labels in Changes view
Versione 3.33 2021.03.10
Internal refactoring
Changed SI Connect detection method
Improved performance when used in the strategy tester
Versione 3.28 2021.02.26
FX Volume GUI enabled in Strategy Tester visual mode when called via iCustom
Versione 3.27 2021.02.26
Besides various minor fixes and improvements, we made a few specific improvements when using FX Volume inside an EA and in the strategy tester like:

- Improve behaviour when called from iCustom
- Improved data processing (all modes)
- Fix minor display bugs while using the visual mode
- Disabled alerts in tester mode
Versione 3.25 2021.02.22
Optimized SI Connect EA detection in case of heavy usage (more than 20 instances)
Versione 3.24 2021.02.17
Fix symbols list display (top of the list possibly hidden)
Versione 3.23 2021.02.17
With this update, it's finally possible to combine different views AND comparison periods in just one chart.

In this way, you'll easily see if the short term volume is still dynamic and supporting the volume change of a higher period.
This offers an entirely new grade of precision because you now see exactly when to enter when to exit and if it's still worth to hold the position.

We hope you'll enjoy the new flexibility provided by FX Volume.
Versione 3.18 2021.02.10
Fixed bug resulting in orphan objects on the chart

Fixed bug of line style changes when using several instances
Versione 3.17 2021.02.04
This release is another huge step forward and provides the following new features.

- Additional colouration for the positive and negative percentage values

- History lines for Volume Total, Volume Long and Volume short are now available

- All history lines can be hidden completely via parameters in the indicator properties

- Use multiple instances of FX Volume in one chart to create individual comparison views.
Note: Every instance has to use a different "History lines and buffers" mode to manage all instances correctly.

- Volume Total, Volume Long and Volume Short are now available in the indicator buffers

IMPORTANT: Please note that the history lines and the panel information is managed independently!
If you switch to a different panel view, this does NOT change the volume history lines. You have to change them in the indicator properties.

Please note also that the value labels of the history lines differ from the information seen in the panel because the panel displays always the latest available information while the history line buffer provides an OHLC volume data average for the entire candle. Please visit our FX Volume info channel at https://t.me/SI_FX_Volume to get more detailed information
Versione 3.1 2021.02.01
Renamed view labels for a better usability
Versione 3.0 2021.02.01
This major update provides a deeper insight into the real trading market sentiment

Now you can see the total volume of the long and short side separately as well as how it changed during the selected comparison period. With this information, you can easily spot on which side of the market there is an upcoming dynamic in the real trading volume.

And because we are often asked for it we added all this information for GOLD as well.

Enjoy the new amazing features of FX Volume and leave a review if you like it.
Versione 2.26 2020.12.21
Fixed minor bug occurring rarely at a terminal restart
Versione 2.25 2020.12.18
Minor bug fixed causing an empty panel due to unchanged data

Added special section for the alert option in the indicator properties
Versione 2.24 2020.12.16
The following new features have been added:

-Alert on long ratio rise/drop
-Alert on total volume rise/drop
-Alert on delta increase/decrease

We hope you'll enjoy the new alert options.
Versione 2.22 2020.12.02
Disabled DEBUG mode
Versione 2.21 2020.11.23
Fixed empty panel bug
Versione 2.20 2020.09.18
Changed Delta calculation display to provide more accurate results

Added total volume buffer -> ask for the updated code snippets

FX Volume is now ready to be used in the MT4 strategy tester!
Versione 2.16 2020.06.24
The panel uses current and raw data only. OHLC is used only for history lines.

Fixed bug in panel update when data are not directly available.

Added an alert for insufficient Terminal "Max bars" settings.
Versione 2.0 2020.06.20
Dear customers, please welcome our fantastic FX Volume 2.0. We spent weeks of work designing this beautiful panel, adding excellent features, and providing more detailed information to offer you outstanding user experience and a real edge in trading.

To benefit from all improvements it is necessary that you update FX Volume and SI Connect to the latest available version!
Versione 1.26 2020.06.07
Metaquotes provided important fixes in MQL5 and asked us to recompile all our market tools.
So please update your local copy to the latest available to benefit from bug fixes and improvements.
Versione 1.25 2020.05.14
Use updated libraries
Versione 1.24 2020.03.09
Added security to avoid alert flooding

Fixed bug which checks and sends alert continuously if the data file can't be opened