• Übersicht
  • Bewertungen (16)
  • Diskussion (31)
  • Neue Funktionen

FX Volume MT5

4.8

Erhalten Sie Ihr tägliches Marktupdate mit Details und Screenshots über unser Morning Briefing hier auf mql5 und auf Telegram!

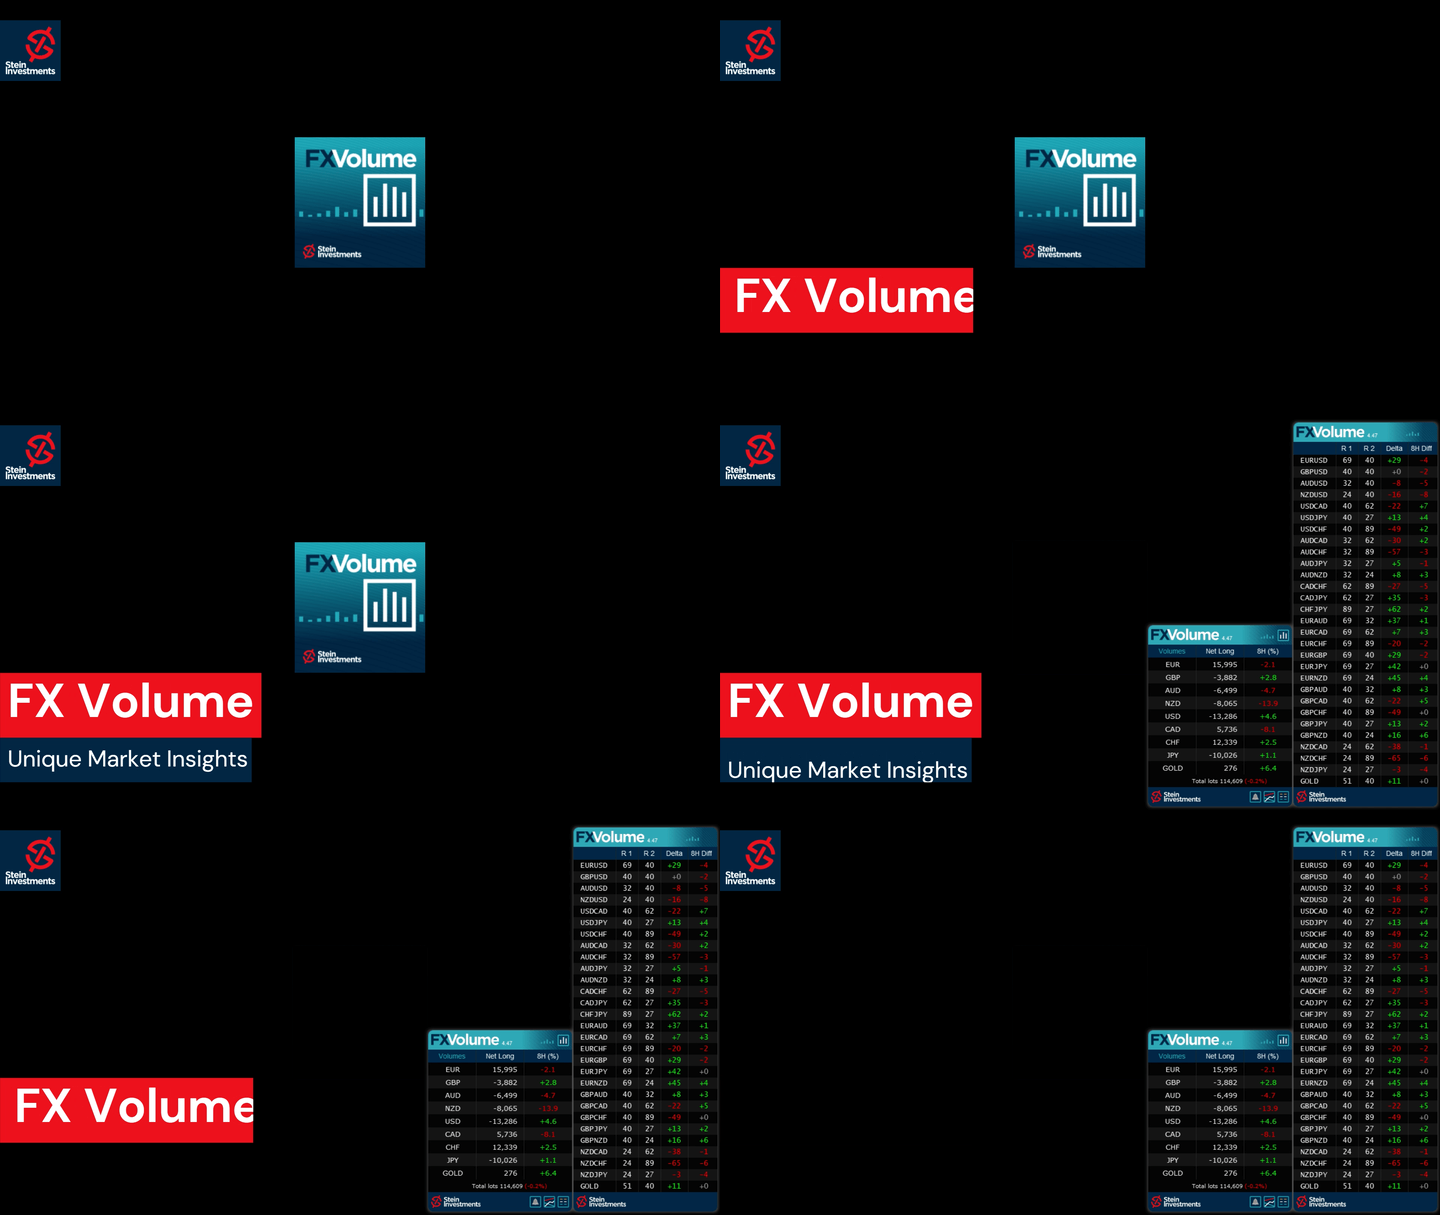
FX Volume ist der ERSTE und EINZIGE Volumenindikator, der einen ECHTEN Einblick in die Marktstimmung aus Sicht eines Brokers bietet.

Es bietet fantastische Einblicke in die Positionierung von institutionellen Marktteilnehmern, wie z.B. Brokern, auf dem Forex-Markt, viel schneller als COT-Berichte.
Diese Informationen direkt auf Ihrem Chart zu sehen, ist der wahre Game-Changer und eine bahnbrechende Lösung für Ihr Trading.

Profitieren Sie von einzigartigen Marktdateneinblicken wie

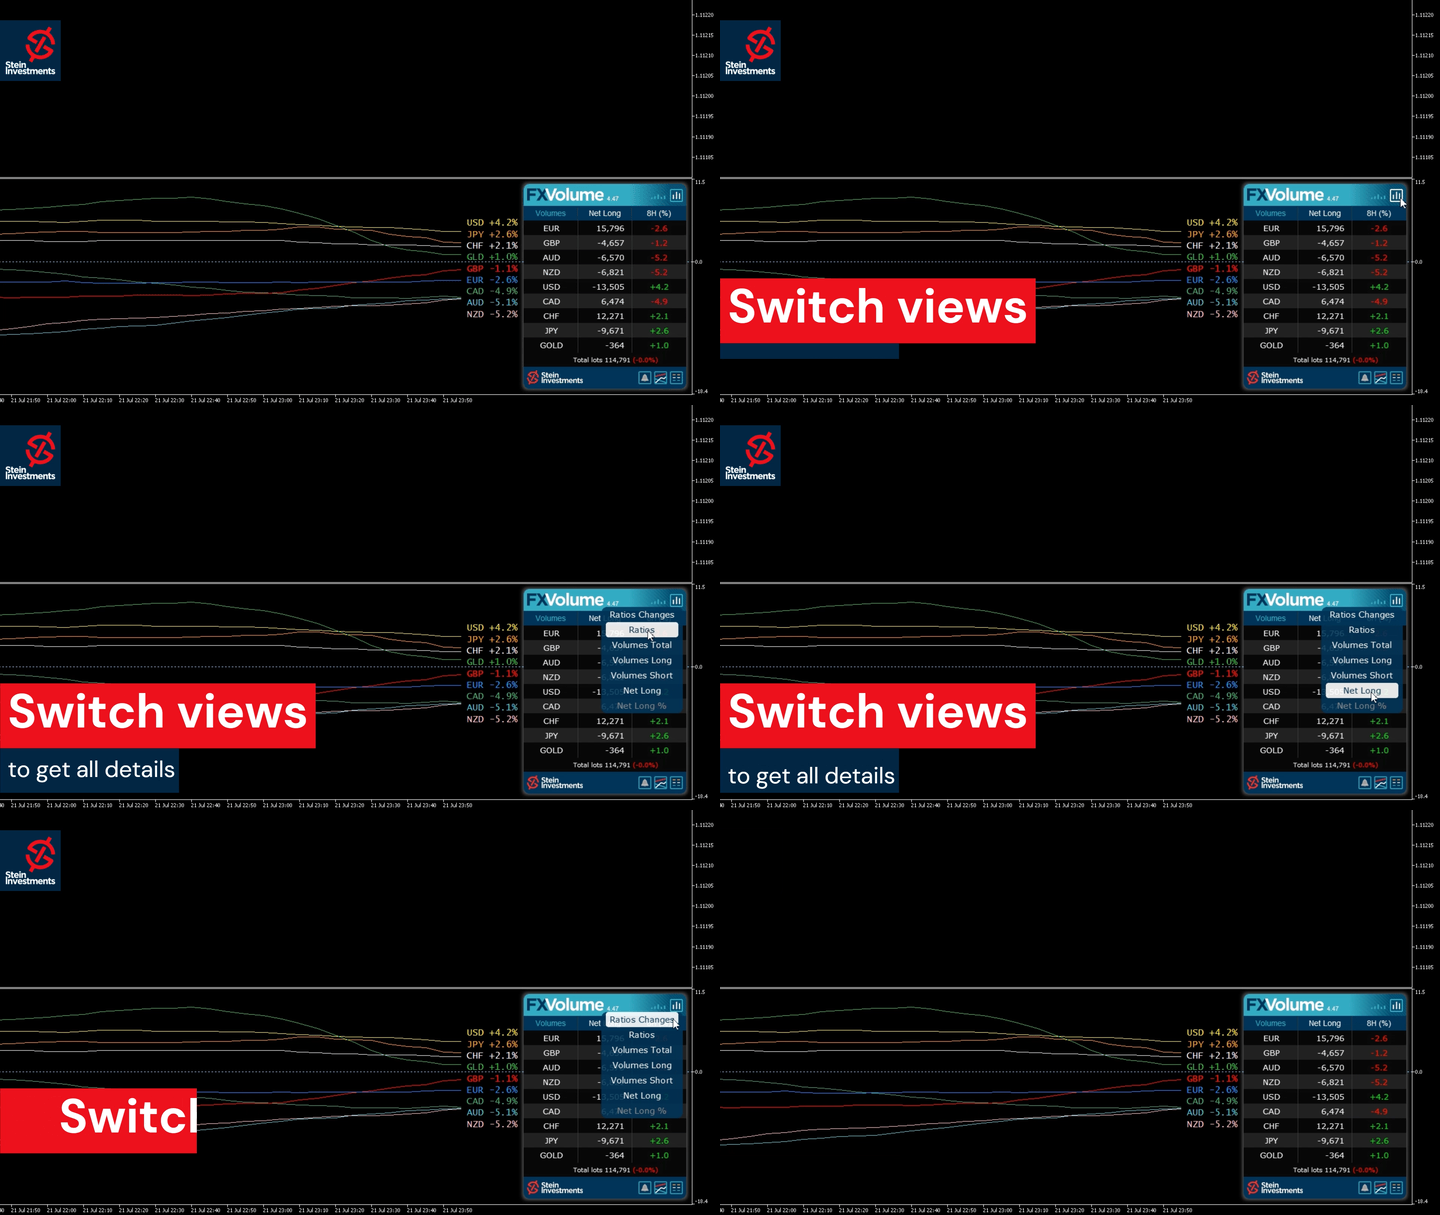
  • Ratios zeigt das Verhältnis von Long- zu Short-Positionen der Währungen in Prozent
  • Ratios Changes zeigt die Long-Ratios und ihre prozentuale Veränderung innerhalb des ausgewählten Zeitraums
  • Volumes Total zeigt das gesamte gehandelte Volumen (Long und Short) der Währungen in Lots
  • Volumina Long zeigt das gehandelte Volumen aller Long-Positionen der Währungen
  • Volumina Short zeigt das gehandelte Volumen aller Short-Positionen der Währungen
  • Net Long zeigt das Netto-Long-Volumen, i.d.h. alle Long-Positionen minus alle Short-Positionen in Lots
  • Net Long Percent zeigt die Veränderung des Netto-Long-Volumens der Währungen

Bitte lesen Sie unser Basis-Tutorial -> "Wie man mit FX-Volumen handelt"

Weitere Informationen, wie FAQs, Trading-Tipps und Tutorial-Videos finden Sie in unserem öffentlichen FX Volume Infokanal

Bitte installieren und starten Sie SI Connect um eine ständige Verbindung zu unserem Rechenzentrum herzustellen


Hintergrundinformationen

Wir alle wissen, dass Forex ein dezentralisierter Markt ist. Deshalb mussten wir über den Tellerrand schauen, eine einzigartige Lösung entwickeln und das komplexeste Projekt programmieren, an dem wir je gearbeitet haben, um diese unbezahlbaren Informationen in unsere Charts zu bekommen. Seit Oktober 2018 analysieren und erfassen unsere Server reale Handelsvolumendaten aus verschiedenen Quellen auf der ganzen Welt. Wir sammeln die Daten, analysieren, wie sich das Handelsvolumen verändert und berechnen einen Index für die wichtigsten Devisenhandelswährungen, aber das ist erst der Anfang. Später werden wir solche Informationen auch für andere Handelsinstrumente wie Gold und Öl zur Verfügung stellen.


Welche Vorteile hat die Nutzung der realen Volumendaten von Stein Investments?

1. Dank der Sichtweise unseres Brokers können Sie ganz einfach mit dem intelligenten Geld handeln
2. Sie erhalten diese Art von Sentiment-Marktdaten in Echtzeit direkt auf Ihrem Chart
3. Dank unserer in Echtzeit aufgezeichneten Historien-Datenbank können Sie leicht überprüfen, wie wertvoll diese Informationen sind

FX Volume ist absolut einzigartig, da es das einzige Tool ist, das diese Daten direkt auf Ihrem Chart ausgeben kann!


Warum ist es nur zur Miete erhältlich?

Wie oben beschrieben ist FX Volume ein laufender Service mit einer laufenden Backend-Infrastruktur, die ebenso Kosten verursacht wie die Admins und Programmierer, die die gesamte Konstruktion überwachen und verbessern, wie die Datenbank im Hintergrund und das grafische Front-End, das Sie auf Ihre Charts laden.

Deshalb müssen wir eine faire wiederkehrende Gebühr erheben, aber FX Volume wird sich schnell amortisieren.
Außerdem bieten wir große Rabatte für mittel- und langfristige Abonnements.


FX Volume Indikator Einstellungen

  • Broker DST Zone und GMT Verschiebung - Bitte googeln Sie oder fragen Sie den Support Ihres Brokers, um die richtigen Werte zu erhalten
  • Compare with X hours back - Legen Sie einen stündlichen Wert für den Ratio und Delta Vergleich fest. Der Standardwert ist 24 Stunden zurück.
  • Alle Verlaufszeilen anzeigen - Setzen Sie auf "false", um nur die Verlaufszeilen der symbolbezogenen Währungen zu sehen
  • Standardansicht - Wählen Sie zwischen der Ratio- und der Changes-Ansicht
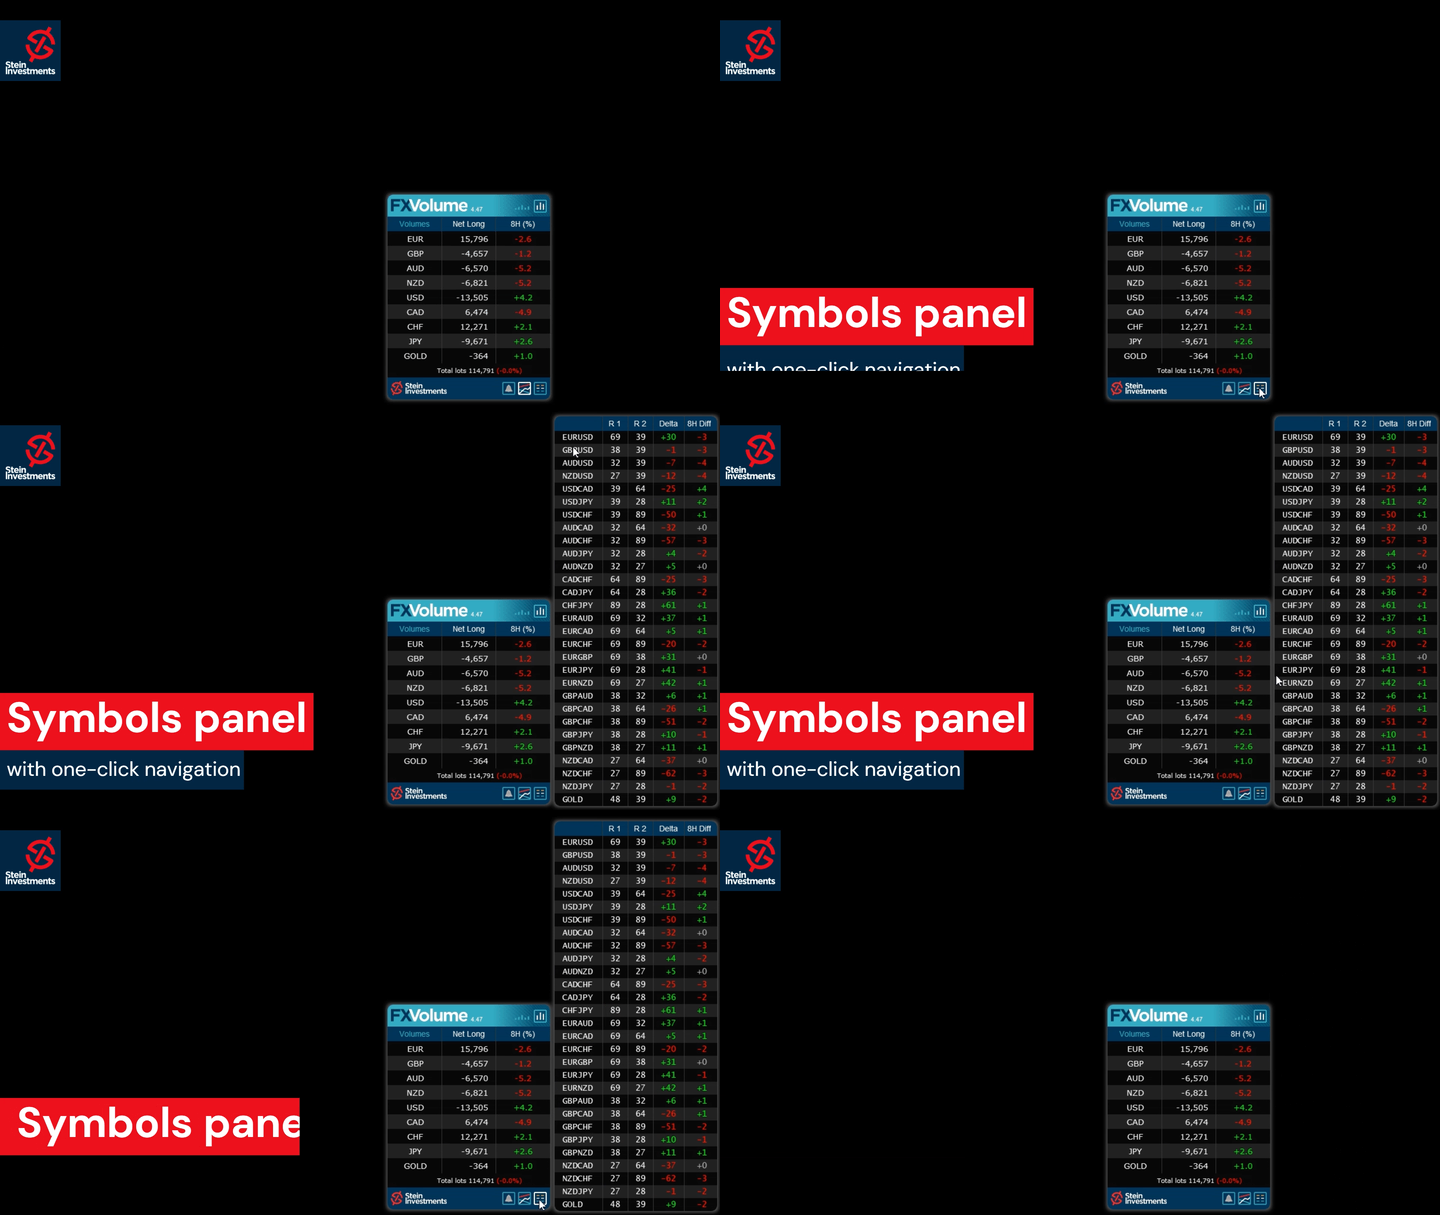
  • Symbol-Liste anzeigen. Stellen Sie "false" ein, um die Liste der 28 Symbole im Hauptchart auszublenden
  • Zoomfaktor - Vergrößern oder verkleinern Sie alle grafischen Elemente


Möchten Sie ein konstant profitabler 5-Sterne-Forex-Händler werden?

Dann holen Sie sich unsere Stein Investments Trading Tools und senden Sie uns einen Screenshot, um Ihre persönliche Einladung zu unserem exklusiven Trading Chat mit 500 Mitgliedern zu erhalten.


Bewertungen 16
Oliver Henry
585
Oliver Henry 2023.07.24 22:20 
 

Very good indicator and totally unique on the retail forex market. The insight a trader can get from this is a real edge for trading. The support is also very good as are the daily updates that are published on the chat group.

bandelero
354
bandelero 2023.06.16 16:15 
 

I have now closed the second week of trading with FX Power and FX Volume with net gain of 2.7%. I am really pleased how the indicators gives me a quick overview of the market and help me to choose the relevant currency to trade for the day.

Khuman Bakhramirad
8827
Khuman Bakhramirad 2023.05.18 13:15 
 

its an amazing indicator, once you combine it with other tools its very good.

Empfohlene Produkte
Simple Weis Wave
Jean Jacques Huve Ribeiro
4 (4)
One of the best tools for analyzing volume, Weis Wave was idelized by David Weis, to facilitate the reading of directional flow. For the VSA method disciples it is an evolution of the practices created by Richard Wycoff, facilitating a predictive reading of the market, always seeking an accumulation and distribution of the negotiated contracts. Cumulative wave volume  Range of wave ( removed) Average Wave volume Ref "Tim Ord lectures" ( removed)
FREE
The Volume Weighted ATR indicator is a helpful tool for measuring market activity. It is based on the idea of the Volume-Weighted ATR. Combining these two elements helps identify potential turning points or breakout opportunities. The indicator for the classification of the activity of the market uses the moving average and its multiples. Accordingly, where the VWATR bar is located (relative to the moving average), it is labelled as ultra-low, low, average, high, very high or ultra high. The Vo
FREE
White Weis Volume Ticks
Ricardo Almeida Branco
5 (3)
White Weis Volume This indicator shows the sum of the volume in each wave, bulish or bearish, as idealized by David Weis , but it brings an important addition , which is the marking of the bar with the highest volume of the wave (White Bar)! In coding the indicator, it was sought to optimize the code to require minimal processing during use and not to overload mt5. The indicator can be used for pre-trading analysis and study, where the trader analyzes possible points of support and resi
30 USD
A countdown timer for the  Volume bar chart generator  and  Tick chart generator  products, which are available for download from the MQL5 Market: Tick chart generator: https://www.mql5.com/en/market/product/29215 Volume bar chart generator: https://www.mql5.com/en/market/product/47197 The counter conveniently displays the number of ticks or transactions (depending on the chart) that need to pass for a new bar to start printing. The user can set the following indicator inputs. Volume type
FREE
Sweet VWAP MT5
Francisco Gomes Da Silva
4.1 (10)
Entdecken Sie, wo große Institutionen handeln und optimieren Sie Ihre Investitionen mit dem kostenlosen Anker-VWAP-Indikator Entdecken Sie den Preis, zu dem große Institutionen handeln, mit unserem kostenlosen Anker-VWAP-Indikator ! Sparen Sie jetzt Ihre wertvolle Zeit, indem Sie die Automatisierung der Ankerung Ihrer VWAPs an den Höchst- und Tiefstständen des Marktes nutzen. Unsere kostenlose Version ermöglicht es Ihnen, die VWAP in Echtzeit leicht zu visualisieren, indem Sie der Bewegung des M
FREE
Automatic Vwap Midas
Ricardo Almeida Branco
5 (1)
The 3 Automatic Vwap (Midas) Indicator can be used for Price and Volume studyers to map the movement of market drivers. It automatically plots 3 Vwaps, two of which are dynamic and will be updated throughout the day if new highs or new lows emerge. The third Vwap is daily and can help if the trend is up or down. Also, an auxiliary indicator that plots (also dynamic) points of interest with OHLC prices (Open, High and Low of the current day and Close of the previous day) was inserted. Success and
40 USD
VWAP Indicator
LUC JACOBUS A VERHEECKE
4.24 (17)
Volume Weighted Average Price (VWAP) The volume weighted average price (VWAP) is a   trading   benchmark   used by traders that gives the average price a security has traded at throughout the day, based on both volume and price. It is important because it provides traders with insight into both the trend and value of a security. This indicator VWAP V2 is free and is the manual version of the extended Easy VWAP indicator (30 Euro), where the date and time properties are automatically entered. Wit
FREE
Value Chart Candlesticks
Flavio Javier Jarabeck
4.8 (5)
The idea of a Value Chart indicator was presented in the very good book I read back in 2020 , " Dynamic Trading Indicators: Winning with Value Charts and Price Action Profile ", from the authors Mark Helweg and David Stendahl. The idea is simple and the result is pure genius: Present candlestick Price analysis in a detrended way! HOW TO READ THIS INDICATOR Look for Overbought and Oversold levels. Of course, you will need to test the settings a lot to find the "correct" one for your approach.
FREE
MIDAS Super VWAP
Flavio Javier Jarabeck
4.23 (13)
Imagine VWAP, MVWAP and MIDAS in one place... Well, you found it! Now you can track the movement of Big Players in various ways, as they in general pursue the benchmarks related to this measuring, gauging if they had good execution or poor execution on their orders. Traders and analysts use the VWAP to eliminate the noise that occurs throughout the day, so they can measure what prices buyers and sellers are really trading. VWAP gives traders insight into how a stock trades for that day and deter
FREE
VWAP and MVWAP
Flavio Javier Jarabeck
4.29 (7)
Volume Weighted Average Price (VWAP) is a trading benchmark commonly used by Big Players that gives the average price a Symbol has traded throughout the day. It is based on both Volume and price. Additionally we put in this indicator the MVWAP (Moving Volume Weighted Average Price). For those who do not know the usage and the importance od this indicator I recommend a great article about this subject at Investopedia ( https://www.investopedia.com/articles/trading/11/trading-with-vwap-mvwap.asp )
FREE
Weis Waves
Flavio Javier Jarabeck
3.24 (25)
The original author is David Weis, an expert in the Wyckoff Method. The Weis Wave is a modern adaptation of the 1930's Wyckoff Method, another expert in Tape Reading techniques and Chart Analysis. Weis Waves takes market volume and stacks it into waves according to price conditions giving the trader valuable insights about the market conditions. If you want to learn more about this subject you can find tons of videos in YouTube. Just look for "The Wickoff Method", "Weis Wave" and "Volume Spread
FREE
Aggression Volume
Flavio Javier Jarabeck
3.79 (19)
Aggression Volume Indicator is the kind of indicator that is rarely found in the MQL5 community because it is not based on the standard Volume data provided by the Metatrader 5 platform. It requires the scrutiny of all traffic Ticks requested on the platform... That said, Aggression Volume indicator requests all Tick Data from your Broker and processes it to build a very special version of a Volume Indicator, where Buyers and Sellers aggressions are plotted in a form of Histogram. Additionally,
FREE
Cybertrade Keltner Channels
Emanuel Andriato
4.67 (3)
Cybertrade Keltner Channels - MT5 Created by Chester Keltner, this is a volatility indicator used by technical analysis. It is possible to follow the trend of financial asset prices and generate support and resistance patterns. In addition, envelopes are a way of tracking volatility in order to identify opportunities to buy and sell these assets. It works on periods longer than the period visible on the chart. All values ​​are available in the form of buffers to simplify possible automations.
FREE
Weis Wave Double Side Alert
Eduardo Da Costa Custodio Santos
Der Weis Wave Bouble Side Indicator für MT5 ist Teil des Toolkits (Wyckoff Academy Wave Market) Der Weis Wave Bouble Side Indicator für MT5 wurde basierend auf dem bereits etablierten Weis Wave von David Weis entwickelt. Der Weis Wave Double Side Indikator liest den Markt in Wellen, wie es R. Wyckoff im Jahr 1900 tat. Es hilft bei der Identifizierung von Aufwand x Ergebnis, Ursache und Wirkung sowie Angebot und Nachfrage Sein Unterschied besteht darin, dass es unterhalb der Nullachse verwendet w
60 USD
Dieser Z-Score Indikator zeigt den korrekten Z-Score eines Assets, da es die normierten (normal-verteilten) Preisdaten benutzt. Das ist der einzige Weg den Z-Score richtig zu berechnen. Der Z-Score darf nur basierend auf normal-verteilten Daten berechnet werden, deshalb wird für die Berechnung die normierten Returns benutzt, als normalverteilt angenommen werden. Die Berechnung des Z-Scores basierend nur auf dem Preis selbst ist nicht zulässig, da der Preis einer eher log-normal Verteilung folgt.
99 USD
This indicator is stand alone version from  MP Pivot Levels  (All in one) containing Demark's Pivots. Calculations:     PP = X / 4     R1 = X / 2 - LOWprev     S1 = X / 2 - HIGHprev Uses: When the pair currency price may change the direction of movement. Possible constraints of support and resistance that creates plateaus for the currency pair prices. Tendency identification by comparing the present prices according to current day's pivot point and also the prior day's pivot points. ___________
FREE
Wave Box Market Frenquency
Jean Jacques Huve Ribeiro
4.75 (4)
Totally linked to the result of a movement and the duration he had. Its height records how many ticks the asset walked during a given movement, its width shows us the duration that movement had. Its configuration must be in line with the Weis Wave Indicator configuration to observe the movement force and can indicate a possible accumulation or distribution of the movement;
FREE
Stackable VWAP
Flavio Javier Jarabeck
3.8 (5)
Volume Weighted Average Price (VWAP) is a trading benchmark commonly used by Big Players that gives the average price a Symbol has traded throughout the day. It is based on both Volume and price. Additionally we put in this indicator the MVWAP (Moving Volume Weighted Average Price). For those who do not know the usage and the importance od this indicator I recommend a great article about this subject at Investopedia ( https://www.investopedia.com/articles/trading/11/trading-with-vwap-mvwap.asp
FREE
MW Volume
Martin Bittencourt
3.75 (4)
Die Martinware Volumenanzeige zeichnet einen farbigen gleitenden Durchschnitt über Volumenbalken auf. Die Färbung verwendet drei Farben und kann auf verschiedene vom Benutzer wählbare Arten erfolgen. Sie wird sowohl auf den Durchschnitt als auch auf die Lautstärkebalken angewendet. Drei Arten der Färbung sind möglich: Keine: Es wird nicht gefärbt Erhöhen oder Verringern: Ändert die Farbe, je nachdem, ob der aktuelle Wert größer oder kleiner als der vorherige ist Volumen im Verhältnis zum Du
FREE
This indicator sums up the difference between the sells aggression and the buys aggression that occurred in each Candle, graphically plotting the waves of accumulation of the aggression volumes.   Through these waves an exponential average is calculated that indicates the direction of the business flow. Note: This indicator DOES NOT WORK for Brokers and/or Markets WITHOUT the type of aggression (BUY or SELL).   Be sure to try our Professional version with configurable features and alerts:  Agr
FREE
Waves Sizer
Flavio Javier Jarabeck
3.67 (3)
Wyckoff fans, enjoy! Ideally to be used with the Weis Waves indicator, but it can be easily used alone, the Waves Sizer puts the range (in resulting Price movement) done by the Price on its market swings. You can control how accurate or loose will be the swings. This tool is very helpful for visually know how much the Price has traveled in your Timeframe. This way you can confront this level of effort with the resulting Volume, etc... Weis Waves indicator: https://www.mql5.com/en/market/pro
FREE
Santa Donchian
Marco Aurelio Cestari
4.2 (5)
Santa Donchian Indicator  is an efficient way to detect support, resistence and break outs in any market. The Donchian channel measures the high and the low of a previously defined range.  Typically, a trader would look for a well-defined range and then wait for the price to break out to either one side for a trade entry trigger. Advantages Never repaints, never backpaints, never recalculates. Works in all symbols and all timeframes. Perfect trend filter for any strategy or expert advisor. Fu
FREE
Weis Wave Double Side
Eduardo Da Costa Custodio Santos
Der Weis Wave Bouble Side Indicator für MT5 ist Teil des Toolkits (Wyckoff Academy Wave Market) Der Weis Wave Bouble Side Indicator für MT5 wurde basierend auf dem bereits etablierten Weis Wave von David Weis entwickelt. Der Weis Wave Double Side Indikator liest den Markt in Wellen, wie er gemacht wurde von R. Wyckoff im Jahr 1900. Es hilft bei der Identifizierung von Aufwand x Ergebnis, Ursache und Wirkung sowie Angebot und Nachfrage Sein Unterschied besteht darin, dass es unterhalb der Nullach
30 USD
LT Weis Waves
Thiago Duarte
5 (11)
The Weis Wave first takes the market volume and then organizes it with the price into Wave charts. It is the only software that will present the true picture of the market before you. If anyone of you, has watched an intraday price movement then you must know that it unfolds in a series of selling as well as buying waves-a procedures tearing down and building up. Wave analysis is an integral part of the trading method. The indicator helps to deal with today’s volatile market. Moreover, it works
FREE
Ultimate Retest
Nguyen Thanh Cong
5 (1)
Introduction The "Ultimate Retest" Indicator stands as the pinnacle of technical analysis made specially for support/resistance or supply/demand traders. By utilizing advanced mathematical computations, this indicator can swiftly and accurately identify the most powerful support and resistance levels where the big players are putting their huge orders and give traders a chance to enter the on the level retest with impeccable timing, thereby enhancing their decision-making and trading outcomes.
FREE
Volume Weighted Average Price or VWAP is an indicator wich shows different average prices on chart. This is very useful to find strong negotiation price areas and as trend following. Configurations: Day, Week and Month - Show different VWAPs according to the period. You can change each line style on "colors" tab. Any doubt or suggestion please contact us. Enjoy! This is a free indicator, but it took hours to develop. If you want to pay me a coffee, I appreciate a lot   <3 PayPal, Skrill, Ne
FREE
Donchian Pro
Paulo Henrique Faquineli Garcia
5 (1)
The Donchian Channel Channels are among the most popular tools of technical analysis, as they visually convey to the analyst the limits within which most price movement tends to occur. Channel users know that valuable information can be obtained at any time, whether prices are in the central region of a band or close to one of the border lines. One of the best known techniques to explore these concepts is Bollinger Bands. However, John Bollinger was not the only one to research the applicatio
FREE
AvgVolumes
Marco Montemari
5 (1)
This indicator is based on Volumes standard indicator, calculates the average of Volumes based on the last N bars set by users, and if the value of the volume is bigger then a set % respect the average a different color will be used. The indicator is shown in a separate indicator window. This version has now a limitation in setting the % about the threshold. If you are interested to set threshold consider to buy the PRO version ( https://www.mql5.com/en/market/product/35925 ) If you want to use
FREE
My Candle Patterns
Francisco Gomes Da Silva
Dieser Indikator ist eine Demo-Version der vollständigen My Candle, die hier heruntergeladen werden kann: Candle Patterns Creator Mit der Vollversion können Sie Ihre eigenen Candle-Regeln erstellen und ein traditionelles Candle-Muster so anpassen, dass es Ihrer Strategie entspricht. Der Indikator enthält mehrere Beispiele für Candle-Regeln, aber hier werde ich nur einige davon demonstrieren: Pattern Rule Candle Green C > O Candle Red C < O Doji C = O Hammer (C > O and (C-O) *2 < O-L and (C-O) *0
FREE
Description The indicator uses market profile theory to show the most relevant trading zones, on a daily basis. The zones to be shown are LVN (low volume nodes) and POC (point of control). An LVN zone is one which represents price areas with the least time or volume throughout the day. Typically, these areas indicate a supply or demand initiative, and in the future, they can turn into important breakout or retracement zones. A POC zone is one which represents price areas with the most time or vo
FREE
Käufer dieses Produkts erwarben auch
Dies ist ein Indikator für MT5, der genaue Signale für den Einstieg in einen Handel ohne Repainting (Neuzeichnen) liefert. Er kann auf alle Finanzwerte angewendet werden: Forex, Kryptowährungen, Metalle, Aktien, Indizes. Er liefert ziemlich genaue Schätzungen und sagt Ihnen, wann es am besten ist, eine Position zu eröffnen und zu schließen. Sehen Sie sich das Video (6:22) mit einem Beispiel für die Verarbeitung nur eines Signals an, das sich für den Indikator gelohnt hat! Die meisten Händler ver
125 USD
Price action trading, Trend trading strategies, Trend following indicators, Trend detection, Range identification, Smart Trend Trading System Indicator, Comprehensive trading system, Multi-indicator approach, Trend following strategy, Range reversal strategy, Smart Trend Cloud, Smart Reversal Zones, Trend Breakout Catcher, Smart Trailing Stop, Multi-timeframe trend finder, Complete trading toolkit, Market trend analysis, Range-bound market signals, Confident trading decisions, Price movement in
100 USD
Blahtech Supply Demand MT5
Blahtech Limited
4.54 (13)
Was: $299    Now: $149   Supply Demand uses previous price action to identify potential imbalances between buyers and sellers. The key is to identify the better odds zones, not just the untouched ones. Blahtech Supply Demand indicator delivers functionality previously unavailable on any trading platform. This 4-in-1 indicator not only highlights the higher probability zones using a multi-criteria strength engine, but also combines it with multi-timeframe trend analysis, previously confirmed swi
149 USD
Robos
Namu Makwembo
5 (2)
Big promotion on the Robos, Get yours now Robos Indicator The   ROBOS   indicator is a multi timeframe oscillator that targets the   overbought   and   oversold  regions of a price chart, a signal is indicated by the two lines crossing, compatible with all tradable instruments Latest Release The latest release is the version 4.0 #What's new in version 4.0 ? Features Extreme oversold and overbought levels ROBOS version  4.0  comes with cool new feature , the ability to target on
255 USD
ICT Analysis, SMC Trading Strategies, Smart Money Concepts, Smart Money Insights,   Institutional Perspective,     Banks and Institutions Liquidity,   Liquidity Analysis, Institutional Trading, Market Predictions, Price Movement Analysis,   Trading with Institutions,  Trend Analysis Tool, Price Action Indicator, Market Structure Analysis, Order Block Detection,   Support and Resistance Levels,   BOS and CHoCH Patterns,  Momentum Shift Indicator, Supply and Demand Zones Locator, Strong Imbalance
100 USD
Was: $249    Now: $149   Market Profile defines a number of day types that can help the trader to determine market behaviour. A key feature is the Value Area, representing the range of price action where 70% of trading took place. Understanding the Value Area can give traders valuable insight into market direction and establish the higher odds trade. It is an excellent addition to any system you may be using. Blahtech Limited presents their Market Profile indicator for the MetaTrader community.
149 USD
Support and Resistance, Trading System, Indicator, Candlestick Patterns, VWAP, Trend Catcher, Multi-Timeframe Trend, Support Levels, Resistance Levels, Trading Strategies, Complete Trading System, Technical Analysis, Forex Trading, Price Action, Market Trends, Trading Signals, Trend Identification, Swing Trading, Day Trading, Swing Trading Strategies, Technical Indicators, Trading Tools, Trend Confirmation, Entry and Exit Points, Trading Panel, Forex Signals, Trend Reversals, Trading Algorithms
100 USD
Advanced Supply Demand MT5
Bernhard Schweigert
4.36 (11)
Derzeit 33% Rabatt! Die beste Lösung für jeden Anfänger oder erfahrenen Händler! Dieser Indikator ist ein einzigartiges, qualitativ hochwertiges und erschwingliches Trading-Tool, da wir eine Reihe von proprietären Funktionen und eine neue Formel integriert haben. Mit diesem Update werden Sie in der Lage sein, doppelte Zeitrahmenzonen anzuzeigen. Sie können nicht nur einen höheren TF (Zeitrahmen) anzeigen, sondern sowohl den Chart-TF als auch den höheren TF: SHOWING NESTED ZONES. Alle Supply Dema
199 USD
IVISTscalp5
Vadym Zhukovskyi
5 (1)
Wir stellen Ihnen den iVISTscalp5-Indikator vor, der nicht nur einzigartig, sondern auch effektiv im Handel ist. Dieser Indikator basiert auf Zeitdaten und ist das Ergebnis jahrelanger Erfahrung und eingehender Analyse der Finanzmärkte. Der iVISTscalp5-Indikator ist ein ausgezeichnetes Werkzeug für manuellen Handel. Bequemlichkeit, Einfachheit und Visualisierung - die gesamte Komplexität ist verborgen. Wir haben die Einstellungen und Verwendung des iVISTscalp5-Indikators auf das Maximum vereinfa
500 USD
Der Forex TPA Indikator deckt die wahren Aktionen der Marktmacher auf, immer dann wenn sie passieren. "Kämpfe nicht gegen die Marktmacher an, sondern folge ihnen", ist wohl der beste Rat, den ein Trader bekommen kann. Der TPA Indikator zeigt jedesmal seine Signale an wenn die Bullen definitiv stärker sind als die Bären und umgekehrt. Dieser Indikator wurde VON Tradern FÜR Trader gemacht und ist 100% NICHT NACHZEICHNEND! Signale werden STRENG am Schluss einer Kerze  generiert. Das sagen unsere Ku
168 USD
The High Way Channel indicator for MetaTrader is a dynamic forex trading tool that identifies and plots price channels on your chart.  Unlike the regular channel indicator, this indicator (Forex Wave Liberator indicator) comes with two different zones where the price is expected to reverse within the channel. The Green and Orange zones are the first and second potential reversal points respectively. This technical indicator is the best channel indicator; it helps you to identify optimal entry/ex
125 USD
Dies ist wahrscheinlich der vollständigste Indikator für die automatische Erkennung der harmonischen Preisbildung, den Sie für die MetaTrader-Plattform finden können. Es erkennt 19 verschiedene Muster, nimmt Fibonacci-Projektionen genauso ernst wie Sie, zeigt die potenzielle Umkehrzone (PRZ) an und findet geeignete Stop-Loss- und Take-Profit-Werte. [ Installationsanleitung | Update-Anleitung | Fehlerbehebung | FAQ | Alle Produkte ] Es erkennt 19 verschiedene harmonische Preisbildungen Dar
299 USD
XQ Indicator MT5
Marzena Maria Szmit
3.25 (4)
The signal conditions are a combination of three indicators, and XQ Forex Indicators only display  medium and long-term trends . The indicator's efficacy has been improved with the addition of a filter that blocks out false signals. The XQ Forex Indicator can be used on  FX pairs, CFDs, and Cryptocurrencies . There are two type of signals:  Buy or Sell and Big Long or Big Short It is possible to enable sending emails when a major trend-change signal is detected, as well as to display the alerts
179 USD
The Volume by Price Indicator for MetaTrader 5 features Volume Profile and Market Profile TPO (Time Price Opportunity). Get valuable insights out of currencies, equities and commodities data. Gain an edge trading financial markets. Volume and TPO histogram bar, line and metric charts. TPO letter and block marker charts including split structures. Positioning and styling options to suit the user's needs and context. Volume Profile and Market Profile TPO Point of Control (VPOC and TPOC), Imbalanc
259 USD
Introduction to X3 Chart Pattern Scanner X3 Cherart Pattern Scanner is the non-repainting and non-lagging indicator detecting X3 chart patterns including Harmonic pattern, Elliott Wave pattern, X3 patterns, and Japanese Candlestick patterns. Historical patterns match with signal patterns. Hence, you can readily develop the solid trading strategy in your chart. More importantly, this superb pattern scanner can detect the optimal pattern of its kind. In addition, you can switch on and off individu
250 USD
Sind Sie es leid, Unterstützungs- und Widerstandslinien zu zeichnen? Der Unterstützungswiderstand ist ein Multi-Zeitrahmen-Indikator, der Unterstützungs- und Widerstandslinien mit einer sehr interessanten Wendung automatisch erkennt und zeichnet: Wenn das Preisniveau im Laufe der Zeit getestet wird und seine Bedeutung zunimmt, werden die Linien dicker und dunkler. [ Installationsanleitung | Update-Anleitung | Fehlerbehebung | FAQ | Alle Produkte ] Steigern Sie Ihre technische Analyse über Nacht
149 USD
RubdFx Perfect Reversal , The reversal indicator is used to determine areas of support and resistance by Drawing an arrow with a level of supply and demand ( ReversalZones ). - You will catch more swings by reducing the period, and less swings if you increase period - Mobile, computer and email alerts available . it is not pushed by price which means the arrow will stay in one place,suitable for scalping and long term trading  Also Compatible with all forex paris , BUY RULES;  open a buy positio
159 USD
Introduction to Fractal Pattern Scanner Fractal Indicator refers to the technical indicator that makes use of the fractal geometry found in the financial market. Fractal Pattern Scanner is the advanced Fractal Indicator that brings the latest trading technology after the extensive research and development work in the fractal geometry in the financial market. The most important feature in Fractal Pattern Scanner is the ability to measure the turning point probability as well as the trend probabil
185 USD
"The Squeeze indicator attempts to identify periods of consolidation in a market. In general the market is either in a period of quiet consolidation or vertical price discovery. By identifying these calm periods, we have a better opportunity of getting into trades with the potential for larger moves. Once a market enters into a "squeeze," we watch the overall market momentum to help forecast the market direction and await a release of market energy." The Modified TTM Squeeze Indicator is a modi
149 USD
Gartley Hunter MT5
Siarhei Vashchylka
5 (11)
Gartley Hunter - Indicator for finding harmonic patterns (Gartley patterns) and their projections. The indicator is equipped with an alert system. List of patterns At the moment, the indicator contains patterns:     Alternative bat     Bat     Butterfly     Crab     Cypher     Deep crab     Gartley Indicator control panel The pattern control panel is located in the lower left corner of the screen. See the picture below for a description of the panel. There are Russian and English version
149 USD
Dieser Indikator ist ein perfekter automatischer Wellenanalyse-Indikator für den praktischen Handel! Die standardisierte Definition des Bandes ist nicht mehr eine Welle von verschiedenen Leuten, und das Ziehen von menschengemachten Interferenzen wird eliminiert, was eine Schlüsselrolle bei der gründlichen Analyse des Ansatzes spielt. =>Increase the choice of international style mode, (red fall green rise style)           Derzeit Kaufrabatt!   Inhalt des Index: 1.       Grundwelle:   Zue
188 USD
Divergenzen sind schwierig zu finden und seltener anzutreffen. Sie sind eines der zuverlässigsten Handelsszenarien. Dieser Indikator sucht automatisch mit Ihrem bevorzugten Oszillator nach regelmäßigen und versteckten Abweichungen. [ Installationsanleitung | Update-Anleitung | Fehlerbehebung | FAQ | Alle Produkte ] Einfach zu handeln Findet regelmäßige und versteckte Abweichungen Unterstützt viele bekannte Oszillatoren Implementiert Handelssignale basierend auf Ausbrüchen Zeigt geeignete
249 USD
Golden Spikes Detector
Batsirayi L Marango
5 (1)
Golden Spikes Detector This indicator is based on an advanced strategy primarily for trading spikes on Boom and Crash Indices. Complex algorithms were implanted to detect high probability entries only. It alerts on potential Buy and Sell entries. To trade spikes on the Deriv or Binary broker, only take Buy Boom and Sell Cash alerts. It was optimised for 5-minute timeframe. Features ·          Sends push notifications to mobile phone ·          Pop up and sound alerts on computer or laptop ·     
150 USD
Offer 249 down from 350 for the next 1 copies. then back to 350 $ Are you tired of using outdated indicators that leave you guessing where to set your profit targets? Look no further than the AK CAP Opening Range Breakout Indicator. This powerful tool is backed by a US patent and has already helped countless traders pass funded challenges like FTMO. We use it daily on our prop traders and internal funds, and now it's available to you as well. The calculation behind the indicator is incredibly
249 USD
The Classic Pivot Points indicator is fully configurable and can be adjusted to work in different ways. If you are a manual trader and prefer a clean chart, you can configure the indicator so that it only draws pivot points for the current session. Otherwise if you are developing an expert advisor that uses pivot points, you can configure the indicator to show historical pivot points as well. Another unique feature of this indicator is that, when calculating daily pivots, it is possible to set a
125 USD
KT Renko Patterns MT5
KEENBASE SOFTWARE SOLUTIONS
KT Renko Patterns scans the Renko chart brick by brick to find some famous chart patterns that are frequently used by traders across the various financial markets. Compared to the time-based charts, patterns based trading is easier and more evident on Renko charts due to their uncluttered appearance. KT Renko Patterns features multiple Renko patterns, and many of these patterns are extensively explained in the book titled Profitable Trading with Renko Charts by Prashant Shah. A 100% automate
145 USD
Bill Williams Advanced
Siarhei Vashchylka
5 (1)
Bill Williams Advanced is designed to analyze the chart according to Bill Williams' Profitunity system. The indicator analyzes the signals of the AO, AC indicators and places them in the panel in the upper left corner of the chart. In addition, using hot keys, the indicator instantly displays / hides the AO and AC indicators (for more details, see the video instructions). Description Each line of the indicator table represents the signals of the Profitunity system that are valid on the last fi
199 USD
Ace Supply Demand Zone Indicator The concept of supply demand relies on the quantity mismatching between buying and selling volumes in the financial market. Supply and demand zone can provide the good entry and exit. A zone is easier to trade than a line. The supply demand zone can provide the detailed trading plan and the risk management. Its ability to predict market direction is high. There are two distinctive points about Ace Supply Demand Zone Indicator. Ace Supply Demand Zone indicator was
100 USD
The Price Action Finder Multi indicator is a multi-currency and multi-timeframe indicator. It searches for patterns of the Price Action system on all standard time frames at once and on a large (up to 60) number of instruments (currencies, stocks, metals, etc.). The resulting patterns are placed by the indicator in a table at the bottom of the screen. Patterns: At the moment, the indicator contains the following patterns: Outside bar , Inside bar , Pin bar , Force bar , PPR , as well as the In
149 USD
Introduction to Fibonacci Volatility Indicator Volatility indicator can help you to detect any statistical advantage for your trading. Especially, if you are trading with Price Action and Price Patterns, then we recommend to use the Volatility indicator together with your strategy. Especically, Fibonacci Volatility indicator combines the market volatiltiy with Fibonacci Analysis to provide you more advanced volatiltiy indicator. Main Features Fibonacci Volatility in Z score Configuration Mode Fi
100 USD
Weitere Produkte dieses Autors
FX Power MT5 NG
Daniel Stein
5 (1)
Erhalten Sie Ihr tägliches Marktupdate mit Details und Screenshots über unser Morning Briefing hier auf mql5 und auf Telegram ! FX Power MT5 NG ist die nächste Generation unseres langjährig sehr beliebten Währungsstärkemessers FX Power. Und was bietet dieser Stärkezähler der nächsten Generation? Alles, was Sie am ursprünglichen FX Power geliebt haben PLUS GOLD/XAU-Stärkeanalyse Noch präzisere Berechnungsergebnisse Individuell konfigurierbare Analysezeiträume Anpassbares Berechnungslimit für noc
99 USD
Erhalten Sie Ihr tägliches Marktupdate mit Details und Screenshots über unser Morning Briefing hier auf mql5 und auf Telegram ! FX Power MT4 NG ist die nächste Generation unseres langjährig sehr beliebten Währungsstärkemessers FX Power. Und was bietet dieser Stärkezähler der nächsten Generation? Alles, was Sie am ursprünglichen FX Power geliebt haben PLUS GOLD/XAU-Stärkeanalyse Noch präzisere Berechnungsergebnisse Individuell konfigurierbare Analysezeiträume Anpassbares Berechnungslimit für noc
99 USD
FX Volume
Daniel Stein
4.59 (34)
Erhalten Sie Ihr tägliches Marktupdate mit Details und Screenshots über unser Morning Briefing hier auf mql5 und auf Telegram ! FX Volume ist der ERSTE und EINZIGE Volumenindikator, der einen ECHTEN Einblick in die Marktstimmung aus Sicht eines Brokers bietet. Es bietet fantastische Einblicke in die Positionierung von institutionellen Marktteilnehmern, wie z.B. Brokern, auf dem Forex-Markt, viel schneller als COT-Berichte. Diese Informationen direkt auf Ihrem Chart zu sehen, ist der wahre Game
99 USD
FX Trend MT5
Daniel Stein
4.62 (34)
Sie wollen ein konstant profitabler 5-Sterne-Forex-Händler werden? 1. Lesen Sie die grundlegende Beschreibung unseres einfachen Trading Systems und sowie das große Strategie-Update im Jahr 2020 2. Senden Sie einen Screenshot Ihres Kaufs, um Ihre persönliche Einladung zu unserem exklusiven Trading-Chat zu erhalten FX Trend zeigt Ihnen die Trendrichtung, Dauer, Intensität und die daraus resultierende Trendbewertung für alle Zeitrahmen in Echtzeit an. Sie sehen auf einen Blick, in welche Richtu
66 USD
Lighthouse MT5
Daniel Stein
5 (17)
Sie wollen ein konstant profitabler 5-Sterne-Forex-Händler werden? 1.   Lesen Sie die grundlegende Beschreibung unseres einfachen Trading Systems   und   seines großen Strategie-Updates im Jahr 2020 2.   Senden Sie einen Screenshot von Ihrem Kauf, um Ihre persönliche Einladung zu unserem exklusiven Trading-Chat zu erhalten Lighthouse   ist ein erstaunlich präziser und zuverlässiger Unterstützungs- und Widerstandsindikator. Es zeigt die wichtigsten Handelsniveaus an und zeichnet sie entspre
66 USD
Trade Manager MT5
Daniel Stein
4.33 (3)
Sie wollen ein konstant profitabler 5-Sterne-Forex-Händler werden? 1. Lesen Sie die grundlegende Beschreibung unseres einfachen Trading Systems und und sein großes Strategie-Update im Jahr 2020 2. Senden Sie einen Screenshot Ihres Kaufs, um Ihre persönliche Einladung zu unserem exklusiven Trading Chat zu erhalten Dieser Trade Manager ist die ideale Ergänzung für alle FX Trend Nutzer, die ein vollautomatisches Handelsmanagement nutzen möchten. Es erkennt Ihre manuell eröffneten Trades sofor
66 USD
FX Trend
Daniel Stein
4.84 (94)
Sie wollen ein konstant profitabler 5-Sterne-Forex-Händler werden? 1. Lesen Sie die grundlegende Beschreibung unseres einfachen Trading Systems und sowie das große Strategie-Update im Jahr 2020 2. Senden Sie einen Screenshot Ihres Kaufs, um Ihre persönliche Einladung zu unserem exklusiven Trading-Chat zu erhalten FX Trend zeigt Ihnen die Trendrichtung, Dauer, Intensität und die daraus resultierende Trendbewertung für alle Zeitrahmen in Echtzeit an. Sie sehen auf einen Blick, in welche Richtu
66 USD
Der Schlüssel zum Erfolg   im Devisenhandel sind Disziplin, Geduld und ein klarer Vorsprung, wie wir ihn mit unserer einzigartigen Analyse des realen Handelsvolumens haben. Das ist unsere Erfahrung aus 10 Jahren Devisenhandel, und all diese Schlüsselfaktoren sind in der   S tein   I nvestments   E xpert   A dvisor ( SIEA ) Serie zusammengefasst. SIEA ZEN   bietet ein sehr ausgewogenes Risiko-Ertrags-Verhältnis und übersteht alle Marktsituationen mühelos - selbst die kritischsten wie Corona, B
599 USD
SIEA Zen
Daniel Stein
4 (4)
Der Schlüssel zum Erfolg im Devisenhandel sind Disziplin, Geduld und ein klarer Vorsprung, wie wir ihn mit unserer einzigartigen Analyse des realen Handelsvolumens haben. Das ist unsere Erfahrung aus 10 Jahren Devisenhandel, und all diese Schlüsselfaktoren sind in der S tein I nvestments E xpert A dvisor ( SIEA ) Serie zusammengefasst. SIEA ZEN bietet ein sehr ausgewogenes Risiko-Ertrags-Verhältnis und übersteht alle Marktsituationen mühelos - selbst die kritischsten wie Corona, Brexit, etc.
599 USD
Crosshair ist ein fantastisches Werkzeug, das unsere Chartanalyse vereinfacht, indem es die Preiskerzen perfekt mit den Indikatorwerten in den Unterfenstern in Einklang bringt. Sie können es mit einem einzigen Druck auf die Taste "C" Ihrer Tastatur aktivieren und deaktivieren und es bietet einen Linealmodus für präzise Messungen, der mit der Taste "R" Ihrer Tastatur aktiviert und deaktiviert werden kann. Bitte schauen Sie sich unser kurzes, unten eingebettetes Tutorial-Video an, um zu sehen
66 USD
Sie wollen ein konstant profitabler 5-Sterne-Forex-Händler werden? 1.   Lesen Sie die grundlegende Beschreibung unseres einfachen Trading Systems   und   und sein großes Strategie-Update im Jahr 2020 2.   Senden Sie einen Screenshot Ihres Kaufs, um Ihre persönliche Einladung zu unserem exklusiven Trading Chat zu erhalten Dieser Trade Manager   ist die ideale Ergänzung für alle   FX Trend   Nutzer, die ein vollautomatisches Handelsmanagement nutzen möchten. Es erkennt Ihre manuell eröffnete
66 USD
Lighthouse
Daniel Stein
4.85 (93)
Sie wollen ein konstant profitabler 5-Sterne-Forex-Händler werden? 1.   Lesen Sie die grundlegende Beschreibung unseres einfachen Trading Systems   und   seines großen Strategie-Updates im Jahr 2020 2.   Senden Sie einen Screenshot von Ihrem Kauf, um Ihre persönliche Einladung zu unserem exklusiven Trading-Chat zu erhalten Lighthouse   ist ein erstaunlich präziser und zuverlässiger Unterstützungs- und Widerstandsindikator. Es zeigt die wichtigsten Handelsniveaus an und zeichnet sie entsprec
66 USD
SI Connect MT5
Daniel Stein
5 (3)
SI Connect ist ein Dienstprogramm, das die Verbindung zu unseren Servern herstellt, um FX Volume oder die SIEA-Handelssysteme zu nutzen. Technische Hinweise zur Vorbereitung Ihres Terminals für die Nutzung von SI Connect Erlauben Sie Webanfragen und fügen Sie https://stein.Investments in die Liste der erlaubten URLs in Ihren Terminal Optionen -> Unterkategorie Expert Advisors ein. Sie benötigen nur eine laufende EA-Instanz pro Terminal, die aber ständig im Hintergrund laufen muss, um die neues
FREE
SI Connect
Daniel Stein
5 (2)
SI Connect ist ein Dienstprogramm, das die Verbindung zu unseren Servern herstellt, um FX Volume oder die SIEA-Handelssysteme zu nutzen. Technische Hinweise zur Vorbereitung Ihres Terminals für die Nutzung von SI Connect Erlauben Sie Webanfragen und fügen Sie https://stein.Investments in die Liste der erlaubten URLs in Ihren Terminal Optionen -> Unterkategorie Expert Advisors ein. Sie benötigen nur eine laufende EA-Instanz pro Terminal, die aber ständig im Hintergrund laufen muss, um die neues
FREE
SIEA Pro MT4
Daniel Stein
3.67 (3)
Weitere Informationen, wie FAQs, Backtest-Berichte und Tipps für die richtigen DST/GMT-Einstellungen finden Sie in   unserer SIEA-FAQ Senden Sie einen Screenshot Ihres Kaufs, und Sie erhalten die Set-Dateien für SIEA ZEN und SIEA MAX . Sie haben also 3 SIEAs in 1. MT4 ist nicht in der Lage, Multi-Symbol-Strategien in seinem Strategie-Tester auszuführen. Wir empfehlen die Verwendung der   SIEA MT5-Versionen , um realistische Real-Tick-Multi-Symbol-Backtests durchzuführen. Der Schlüssel zu
499 USD
SIEA MAX  bietet ein ausgewogenes Risiko-Ertrags-Verhältnis und übersteht alle Marktsituationen mühelos - selbst die kritischsten wie Corona, Brexit, etc. Die Geduld und Disziplin des Systems werden mit großen Gewinnen für seine Nutzer belohnt. Deshalb haben wir es MAX genannt. MT4 ist nicht in der Lage, Multi-Symbol-Strategien in seinem Strategie-Tester auszuführen. Wir empfehlen die Verwendung der   SIEA MT5-Versionen , um realistische Real-Tick-Multi-Symbol-Backtests durchzuführen. Wei
299 USD
Crosshair
Daniel Stein
Crossahair ist ein fantastisches Werkzeug, das unsere Chartanalyse vereinfacht, indem es die Preiskerzen perfekt mit den Indikatorwerten in den Unterfenstern in Einklang bringt. Sie können es mit einem einzigen Druck auf die Taste "C" Ihrer Tastatur aktivieren und deaktivieren und es bietet einen Linealmodus für präzise Messungen, der mit der Taste "R" Ihrer Tastatur aktiviert und deaktiviert werden kann. Bitte schauen Sie sich unser kurzes, unten eingebettetes Tutorial-Video an, um zu sehe
66 USD
SIEA Max
Daniel Stein
1 (2)
Der Schlüssel zum Erfolg im Devisenhandel sind Disziplin, Geduld und ein klarer Vorsprung, wie wir ihn mit unserer einzigartigen Analyse des realen Handelsvolumens haben. Das ist unsere Erfahrung aus 10 Jahren Devisenhandel, und all diese Schlüsselfaktoren sind in der S tein I nvestments E xpert A dvisor ( SIEA ) Serie zusammengefasst. SIEA MAX bietet ein ausgewogenes Risiko-Ertrags-Verhältnis und übersteht alle Marktsituationen mühelos - selbst die kritischsten wie Corona, Brexit, etc. Die G
299 USD
SIEA Pro
Daniel Stein
4.46 (13)
Weitere Informationen, wie FAQs, Backtest-Berichte und Tipps für die richtigen DST/GMT-Einstellungen finden Sie in   unserer SIEA-FAQ Senden Sie einen Screenshot Ihres Kaufs, und Sie erhalten die Set-Dateien für SIEA ZEN und SIEA MAX. Sie haben also 3 SIEAs in 1. Der Schlüssel zum Erfolg im Devisenhandel sind Disziplin, Geduld und ein klarer Vorsprung, wie wir ihn mit unserer einzigartigen Analyse des realen Handelsvolumens haben. Das ist unsere Erfahrung aus 10 Jahren Devisenhandel, und all
499 USD
Auswahl:
Oliver Henry
585
Oliver Henry 2023.07.24 22:20 
 

Very good indicator and totally unique on the retail forex market. The insight a trader can get from this is a real edge for trading. The support is also very good as are the daily updates that are published on the chat group.

Daniel Stein
119685
Antwort vom Entwickler Daniel Stein 2023.07.24 22:28
Thank you so much for your positive feedback. It's highly appreciated. 🙏
bandelero
354
bandelero 2023.06.16 16:15 
 

I have now closed the second week of trading with FX Power and FX Volume with net gain of 2.7%. I am really pleased how the indicators gives me a quick overview of the market and help me to choose the relevant currency to trade for the day.

Daniel Stein
119685
Antwort vom Entwickler Daniel Stein 2023.06.17 12:54
Thank you so much for your wonderful feedback. 🙏
Khuman Bakhramirad
8827
Khuman Bakhramirad 2023.05.18 13:15 
 

its an amazing indicator, once you combine it with other tools its very good.

Daniel Stein
119685
Antwort vom Entwickler Daniel Stein 2023.05.18 13:23
Thank you so much for your positive feedback. It's highly appreciated. 🙏
Oliver Hesse
1021
Oliver Hesse 2022.09.22 21:26 
 

I am writing this review as an overall review of the FX Trend, FX Power and Lighthouse indicators, as the authors have combined them into the STS strategy as a whole set-up. I will not write the review as text, but will list the advantages and disadvantages. + good way to get the trend of different time frames at a glance (FXT) various visualized SL setting options (FXT) great opportunities to display the currency pair strengths based on freely selectable time periods and therefore also to place good entries (delta crosses/FXP) unique insight into the volume of individual currency pairs (FXV) - none of the Stein tools can be saved as a template in such a way that the panels of the various tools look the same or are in the same place after closing and reopening the template (all FX) Buttons remain objectively on the chart, although the respective indicator has been deleted (LH) if you use these tools on different screen sizes, it can happen that the font of the panel exceeds the frame of the panel (FXT and LH) If the authors decide to no longer provide the data for the volume indicator, all volume-based indicators and EAs by Stein will become unusable, no matter what promises are made on the official site (FXV) In principle, the LH indicator has 3 different display levels. However, these only give the trader a rough indication of where there might be significant SR levels. These levels are broken as often as they are resisted. They give the user a maximum 50/50 rating. Many users, including me, also complain about the inaccuracy of the SR lines. Drawn SR zones would also make more sense than delicate lines. No SR level focuses within a 1 pip line. In addition, it is also disturbing that the lines cross the entire chart and SR lines are visualized that are several hundred pips away from the current price (LH) there is a telegram chat where the functions and the interaction of the tools mentioned can be discussed. This chat is made up of 600 people, never more than the same 10 people posting (with slight fluctuation). In the meantime, the library is so full of images from past conversations that every question from newcomers is answered with: "look at the library". As a new chat member, you have to be prepared to no longer receive personal help, but to browse through tons of image and text material. Unfortunately, the chat rules are also strangely regulated by the author. On the one hand, masses of third-party tools can be found in the library, on the other hand, the author does not want any products linked that do not do justice to the purpose of the group... discussing the Stein Tools. This is strange in many respects, since, as I said, it has happened a thousand times before that foreign tools have been uploaded and, secondly, every new interested party should be absolutely clear that you definitely don't get a setup with the compilation of Stein tools, which one enough to get rich. Unfortunately, this is completely absent in the group. To work out a setup together (from Stein Tools and others) that can ultimately lead to success. The fact is that no money can be made with the STS strategy shown on the blueball side. That's simply not enough that you have to consider as a retailer (fundamentals, MM...) The biggest minus point for me, however, is that I addressed various things regarding object-related errors (template capability) several months ago. Unfortunately, the statement was already a year ago that this is known, but no more changes are made to these tools. All should be redisgned once, but without time limits. So it could be weeks or years. Anyone who would like to know more about what I mean is welcome to contact me personally. Finally, I can say that I have been using all the tools for 3 years and can live with the bugs. What I can't live with is that the authors have known these for several years, but they are not turned off and that the author basically assumes that I'm the only one with these problems.

Daniel Stein
119685
Antwort vom Entwickler Daniel Stein 2022.09.23 09:15
Oh, Oliver, I'm so tired of your childish attitude, but you force me to clarify some things for the public. You bought some tools and NOT us or our company. This means we do NOT have to code anything you think is an improvement. Of course, we take care of bugs if we can reproduce them. Try it yourself by opening a blank new chart and try to reproduce the issue you think of it's a bug. If everything works on this new chart, it's a problem with the setup you created. That's what we explained so often.
And then there are technical limitations of our current product series, which hundreds of other users can easily live with but not you. We know them and designed a new panel technique already available at FX Volume and will be available with the next generation of our other tools. You ignore that there are hundreds of other users besides you. A fundamental redesign of a productive tool is too risky, and that's why every creator, author and software company provides an entirely new version every now and then. So the "old" users are happy, and the new generation users are pleased with the new features. And everyone can switch or use both as they want. I doubt you'll ever understand that, but we honestly don't care. We had endless chats with you, and it's simply hopeless, so please accept that we, as a company, have our own plans for our customers and products. Our chat rules are fair and transparent, and doing marketing for other publishers is simply unacceptable. Besides that, everyone gets the help he needs, but it's clear that we don't have the time to offer individual coaching; hence we have the central Link Library with useful basic information for all users. If there are questions, users can drop them in the group, and other more experienced users or we answer. We're happy to have constantly profitable traders taking their trades solely based on our tools and sharing their knowledge with the crowd. If this isn't enough for you to get rich, we can't help you. Getting rich is a question of attitude and posting your "review" on all 4 product pages makes it even more evident that this is something personal because you don't get your will. Enjoy the audience. We're done with you.
Robert Torres Jr
1541
Robert Torres Jr 2022.06.15 07:07 
 

I am beyond impressed with the pre-purchase support that I have received thus far from Daniel. I've reviewed the telegram groups and I bought the Lighthouse, Powerplay Trade Manager, SIEA Pro, FX Power, FX Trend, and FX Volume (Did I miss any necessary tool?) I am excited to start learning to trade according to this strategy. I'll give more feedback as I start my trading journey with the Stein Investment Group of Traders.

Lester David Saldana Reyes
338
Lester David Saldana Reyes 2021.12.20 16:55 
 

Muy bueno, hace pocas horas lo instalé y está dando buenos resultados, espero siga así. Estaré actualizando la información y datos. La respuesta del creador de este indicador es rápida.

Nick167
49
Nick167 2021.05.22 00:27 
 

I purchased Stein Investments tools for MT5, also FX Volume. And they make a good impression. I learn to use them effectively. I already have a few questions that I will gladly ask after adding me to the forum :) I know for sure that one more application would be useful, which would give signals on the basis of all the others, connecting them together. I mean calculating the most precise inputs and outputs based on FX Power, FX Volume and FX Trend. Perhaps it will be an improved version of Trade Manager? That's a question for Daniel :)

Daniel Stein
119685
Antwort vom Entwickler Daniel Stein 2021.05.24 10:43
Hi Nick, I sent you the invitation to our group chat. In the Link Library of this chat, you'll find a link to the STS dashboard, a tool that summarizes the information of the individual indicators and alerts you based on your individual settings. Best regards, Daniel
Alex East
100
Alex East 2021.02.19 17:58 
 

I have been using FX Volume for around 4-5 months and I can not rate it highly enough. Along, with the rest of Stein's tools they were a real gamechanger for me after years of struggling to find an edge in the market and personally I feel that FX Volume is the most powerful of the lot. Customer service is superb - any issues at all and Daniel is always willing to help. Regular updates - the indicator just keeps on getting better. NB: Like with any indicator, Steins suite of tools are best used in conjuction with technical analysis. If used in this way they are extremely powerful.

Luke Perrett
3278
Luke Perrett 2021.02.09 23:05 
 

Amazing tool. Great insight into the market. Continually updating to get a closer edge. No crap telegram group. Great team behind all of Steins products. Find me a better product than this. Good luck. Keep up the amazing work Stein team, we need you!!

Andre Gomes
2475
Andre Gomes 2021.02.06 20:05 
 

Excellent tool. I cannot thank Daniel and Alain enough for building this amazing tool, which truly gives you and edge to trade forex markets.

CaesarX
304
CaesarX 2021.01.10 09:28 
 

FxVolume has become the most important tool at my disposal, I simply couldn't go without it

Boriwan
641
Boriwan 2020.10.26 20:10 
 

Отличная работа! Спасибо!

Joshua Jeffries
123
Joshua Jeffries 2020.10.22 15:31 
 

I have had this indicator now for the best part of 6 months. I find the insights extremely useful and has saved my skin a few times. Trades i would've normally taken nullified by this indicator. I find it great for swing trading as I can see the volume changing in real time and start to move in the direction i am anticipating. Used in conjunction with the other tools in the box you will find great results. The community is top notch and also run community projects for EA's and Dashboards, the subscription alone is worth that. There are several strategies to use the tools and suits every trader. We have low TF traders in the group M1-M5 and also people like me H1 - D1, and we all seem to be getting great results! For what you get, the price alone is absolutely a steal, it will add so much value to your trading i can't even describe. Since starting my account is up over 500% so yeah, speaks for itself. If you are interested in the closed thing you'll get to an institutional tool on MQL, well, this is it.

The most useful info are

LOTS

Percentage of long trades

Once you see these increasing for one pair, it is almost a sure thing the price is going to follow. The subscription is so cheap you can't not try it. I can't thank Daniel and the guys in the group enough!

Stephan Grobler
147
Stephan Grobler 2020.08.29 12:58 
 

Excellent tool!

Aravind Kolanupaka
8495
Aravind Kolanupaka 2020.06.27 18:59 
 

So many ways to use the data and confirm trades.

RDI
1482
RDI 2020.04.01 22:04 
 

Great Indicator . Thanks Daniel!!

Antwort auf eine Rezension
Version 4.55 2023.08.30
Fixed bug when symbols alert enabled
Version 4.53 2023.08.01
Added INSTANCE_ID input parameter

Fixed GOLD bug, shifting all currencies data
Version 4.52 2023.07.31
Fixed iCustom call, sometimes displaying the panel

Added Gold input parameters, and updated to use last framework changes
Version 4.50 2023.07.26
Fixed invalid pointer, framework bug when no history lines are displayed

Fixed bug in loading FXV parameters
Version 4.48 2023.07.24
Fixed minor bugs

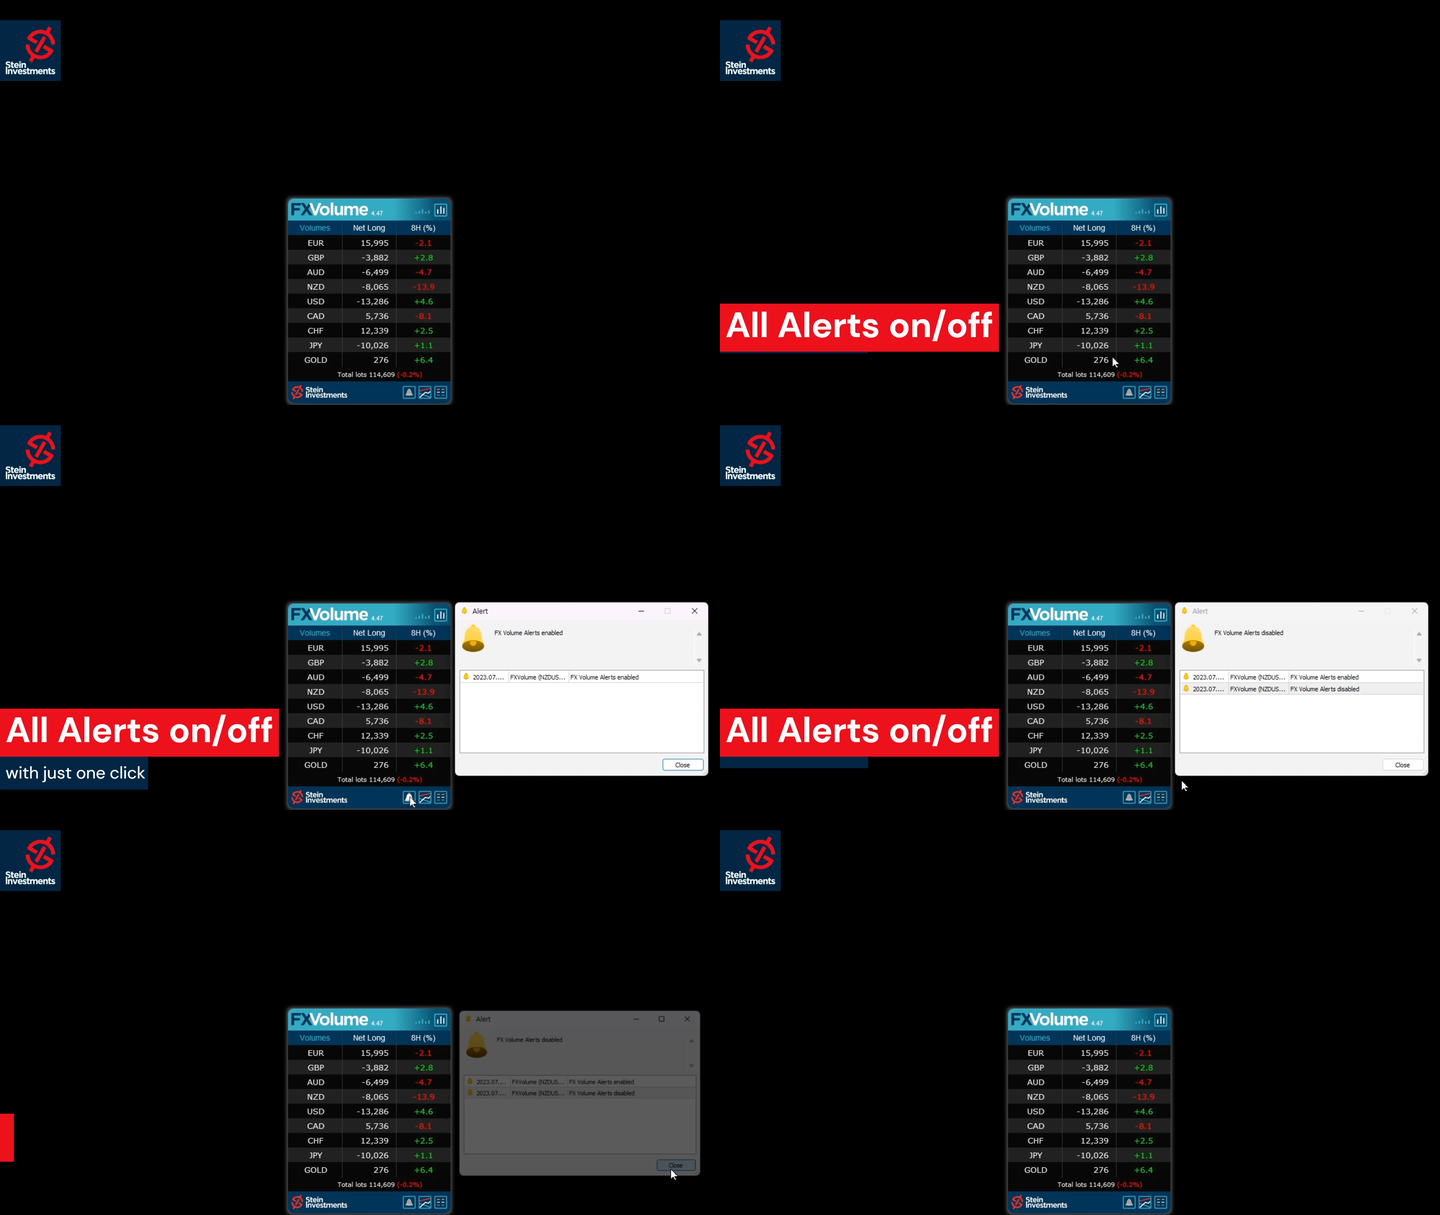
Added an alert button in the panel

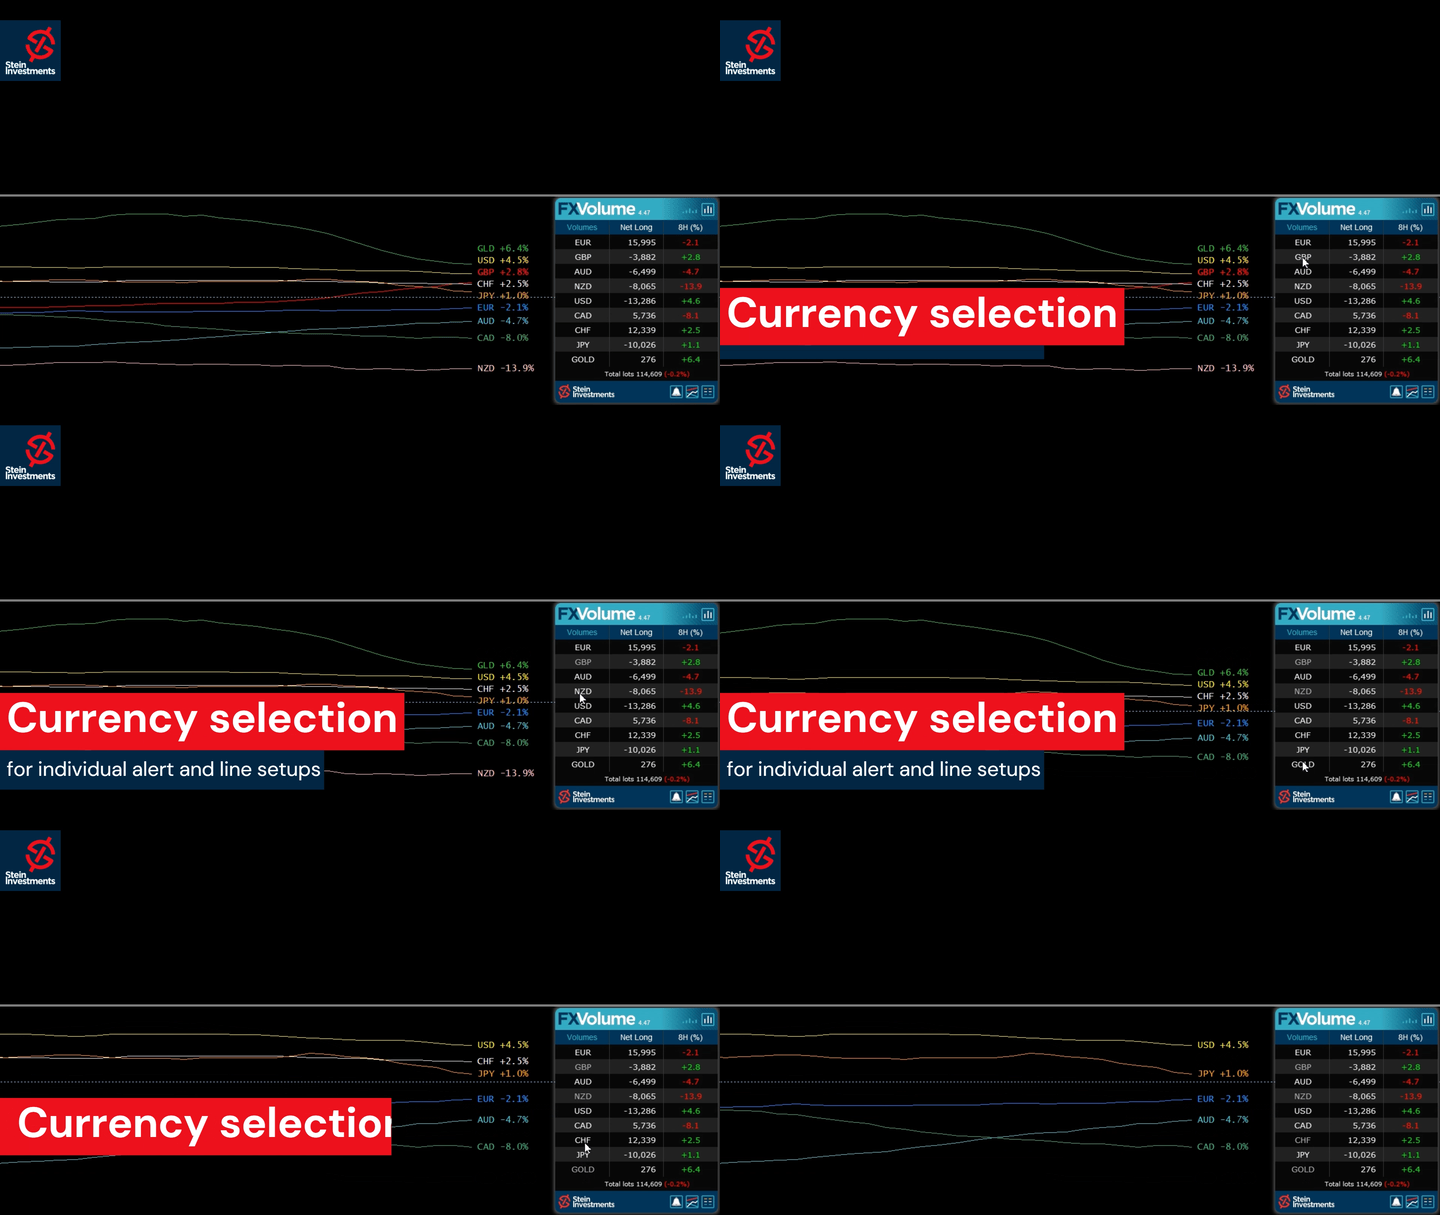
Alerts are now individually configurable according to currencies selected

Update with last framework and generic changes

Changed input parameters (without effect on iCustom requests)

Changed currency sorting in the panel following a logical convention for symbol names
Version 4.42 2023.06.01
Fixed GUI DPI adjustment bug
Version 4.41 2023.06.01
⚠️Due to necessary changes in our panel management, you have to reconfigure your charts once after the update⚠️

New Features
Added history mode "Net Long % change"
Added new main panel view "Net long % change"
Added alerts for "Net long % change" drop & rise

Changed indicator label on chart to display one decimal at % values
Changed indicator digits according to history mode
Changed the zoom factor to use % values
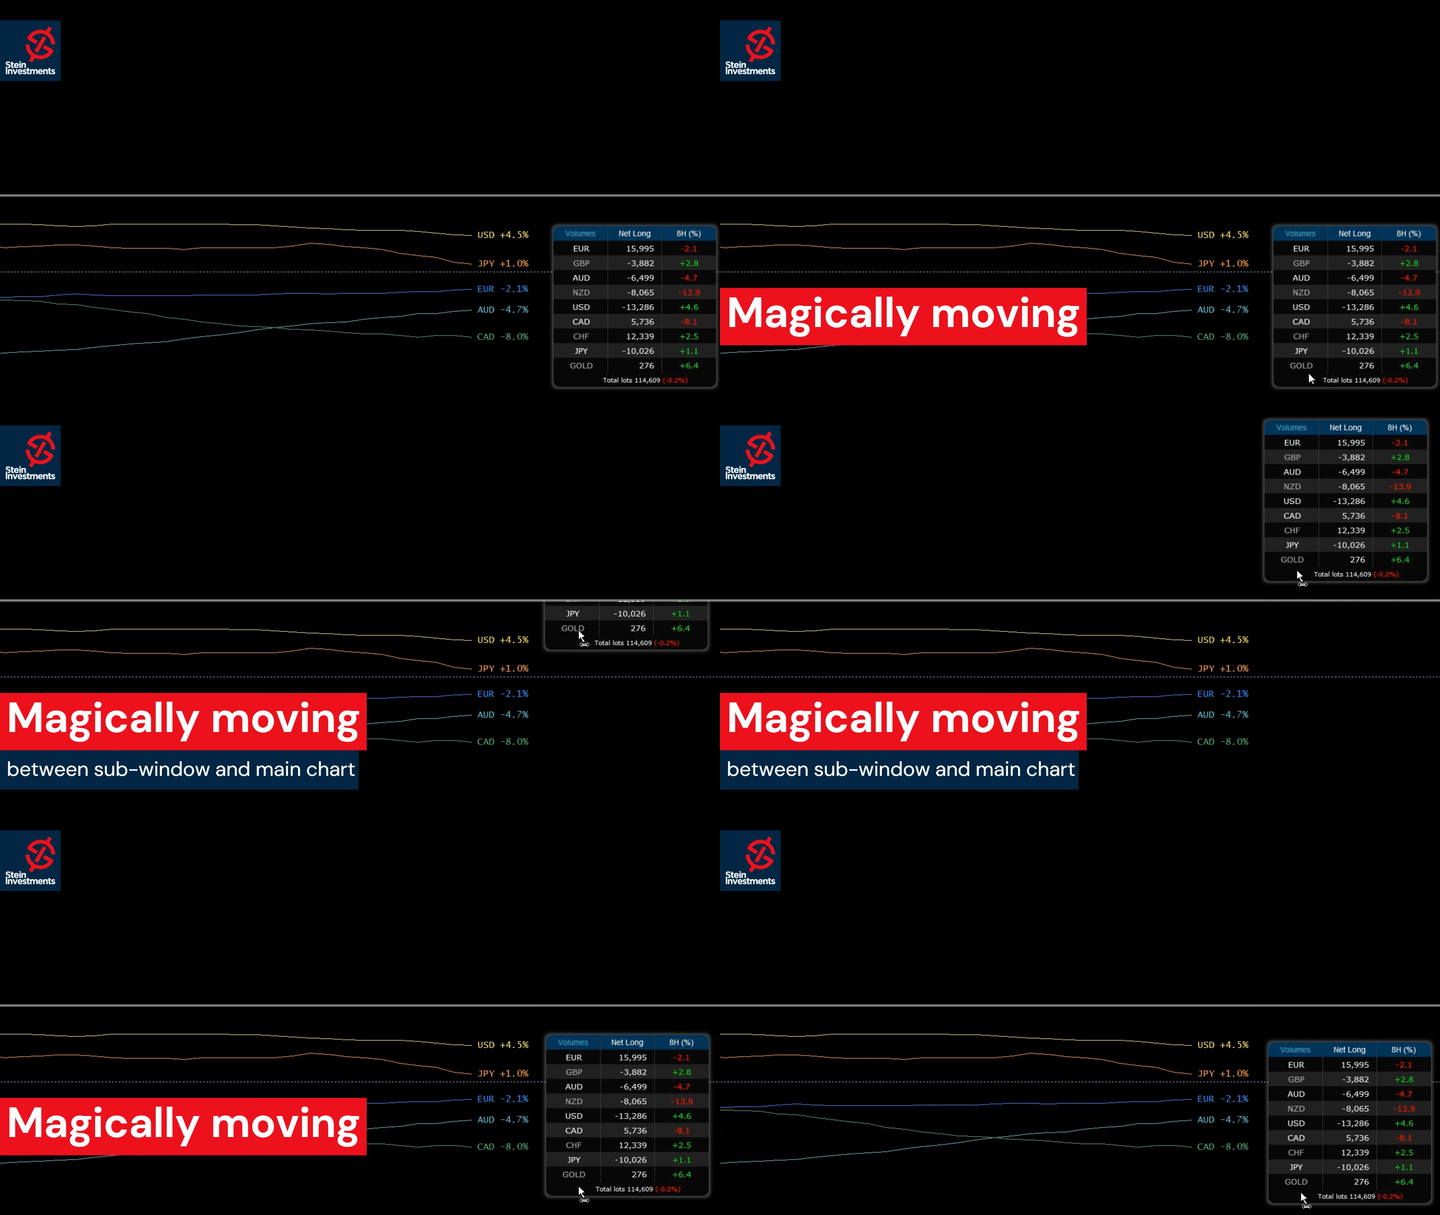
Symbols list refactoring as a new panel


Graphics
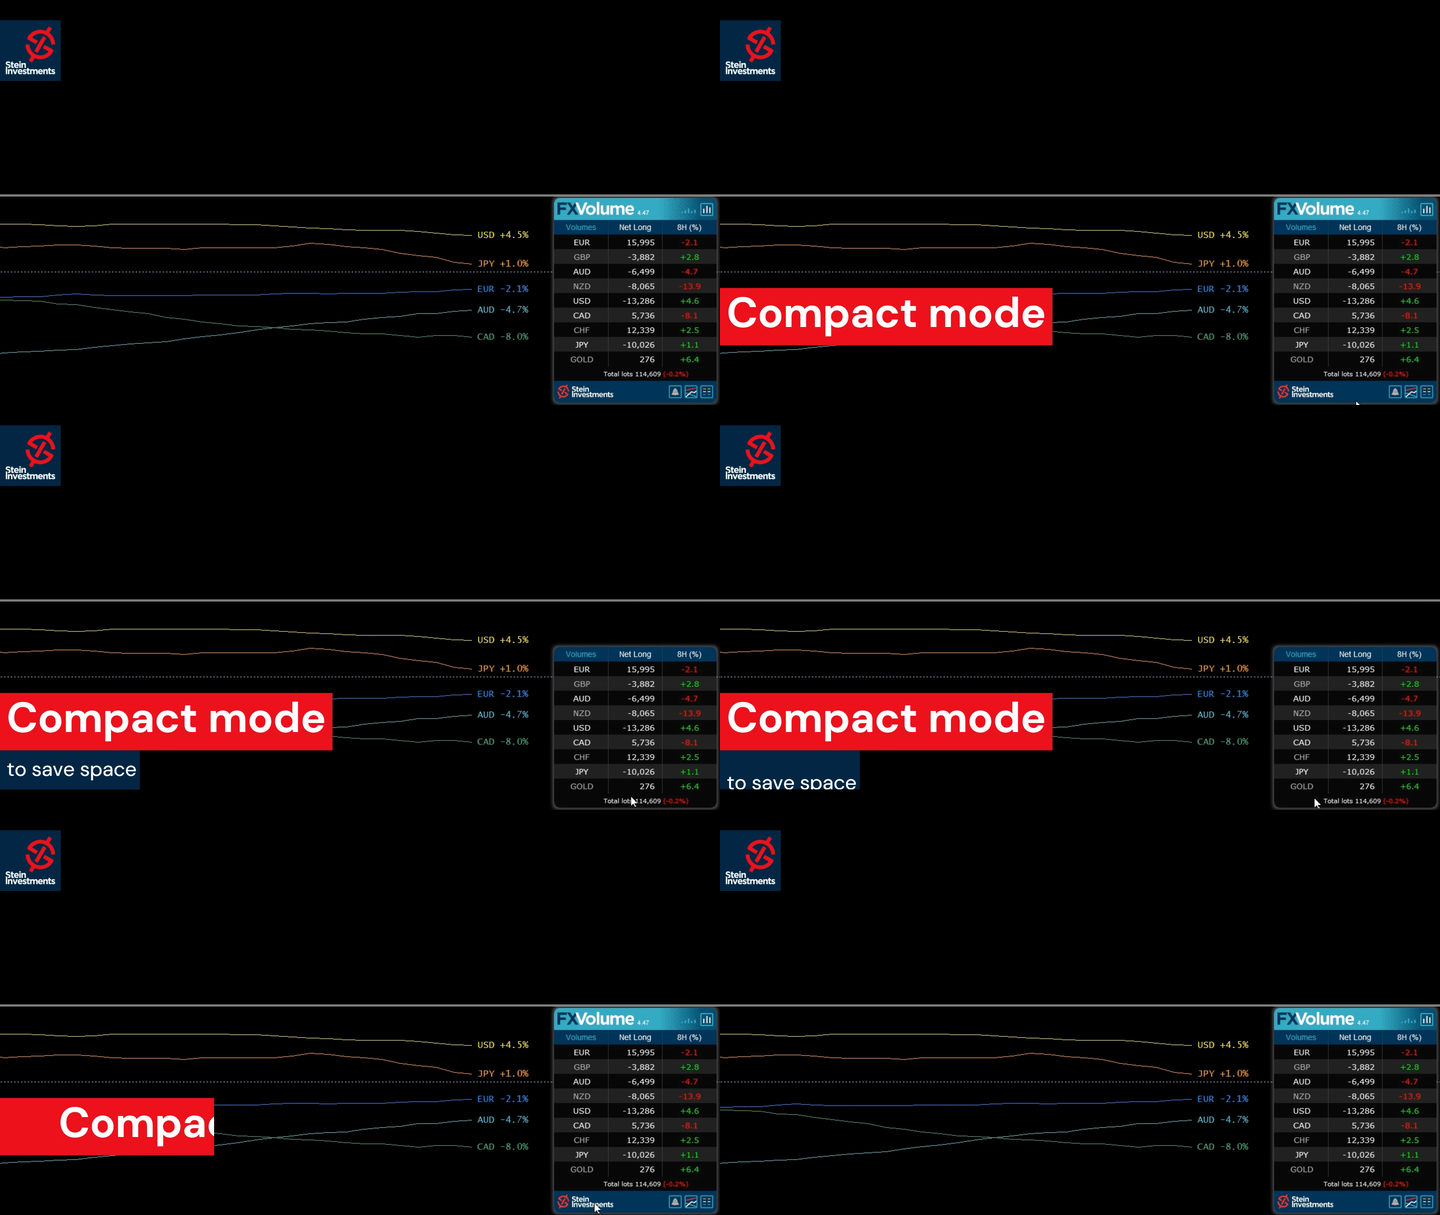
New rounded corner panel design.
Added a different color for the "Past" data column.
Added input for panel back color if the auto-scheme is disabled
Improved plot labels display to avoid overlapping. (MT5 only)


Under the hood
Apply complete internal refactoring
Apply the last framework update
Version 4.10 2022.03.08
Fixed resource loading issue on some Mac/Linux systems

Fixed graphical panel bug when missing past data
Version 4.0 2022.03.02
FX Volume 4.0 comes with two additional features.

1. The option to use the internal comparison calculation on a minute basis which allows comparison below our previous minimum of 1 hour.

2. Inspired by our fellow trader Luke, we created a Net Long Volume view including history lines to understand better how the Net Long volume correlates with the market moves we see on the chart.

Check our Stein Investments YouTube channel to see a video of the new features.

We're sure you'll like the new features.
Version 3.58 2021.09.01
Optimized FX Volume to be fully compatible with MT4/MT5 templates
Version 3.53 2021.05.08
Transition version to use data in common data folder

Fixed bug with GMT when running FX Volume on a weekend for the first time

Optimizations when used as free demo version in the strategy tester


Version 3.50 2021.04.08
Fixed minor bug when alerts are enabled
Version 3.49 2021.04.01
This update contains the following changes:

- New Alert options based on Long and Short Volume
- New Alert filters based on the dominance of one side available,
i.e. if Volume Long is bigger than Volume Short, you'll get only alerts for the Volume Long side
- Improved communication with the new SI Connect 2.x
- Optimized settings managements

and these changes are related to the strategy tester usage

- Fixed current candle update bug
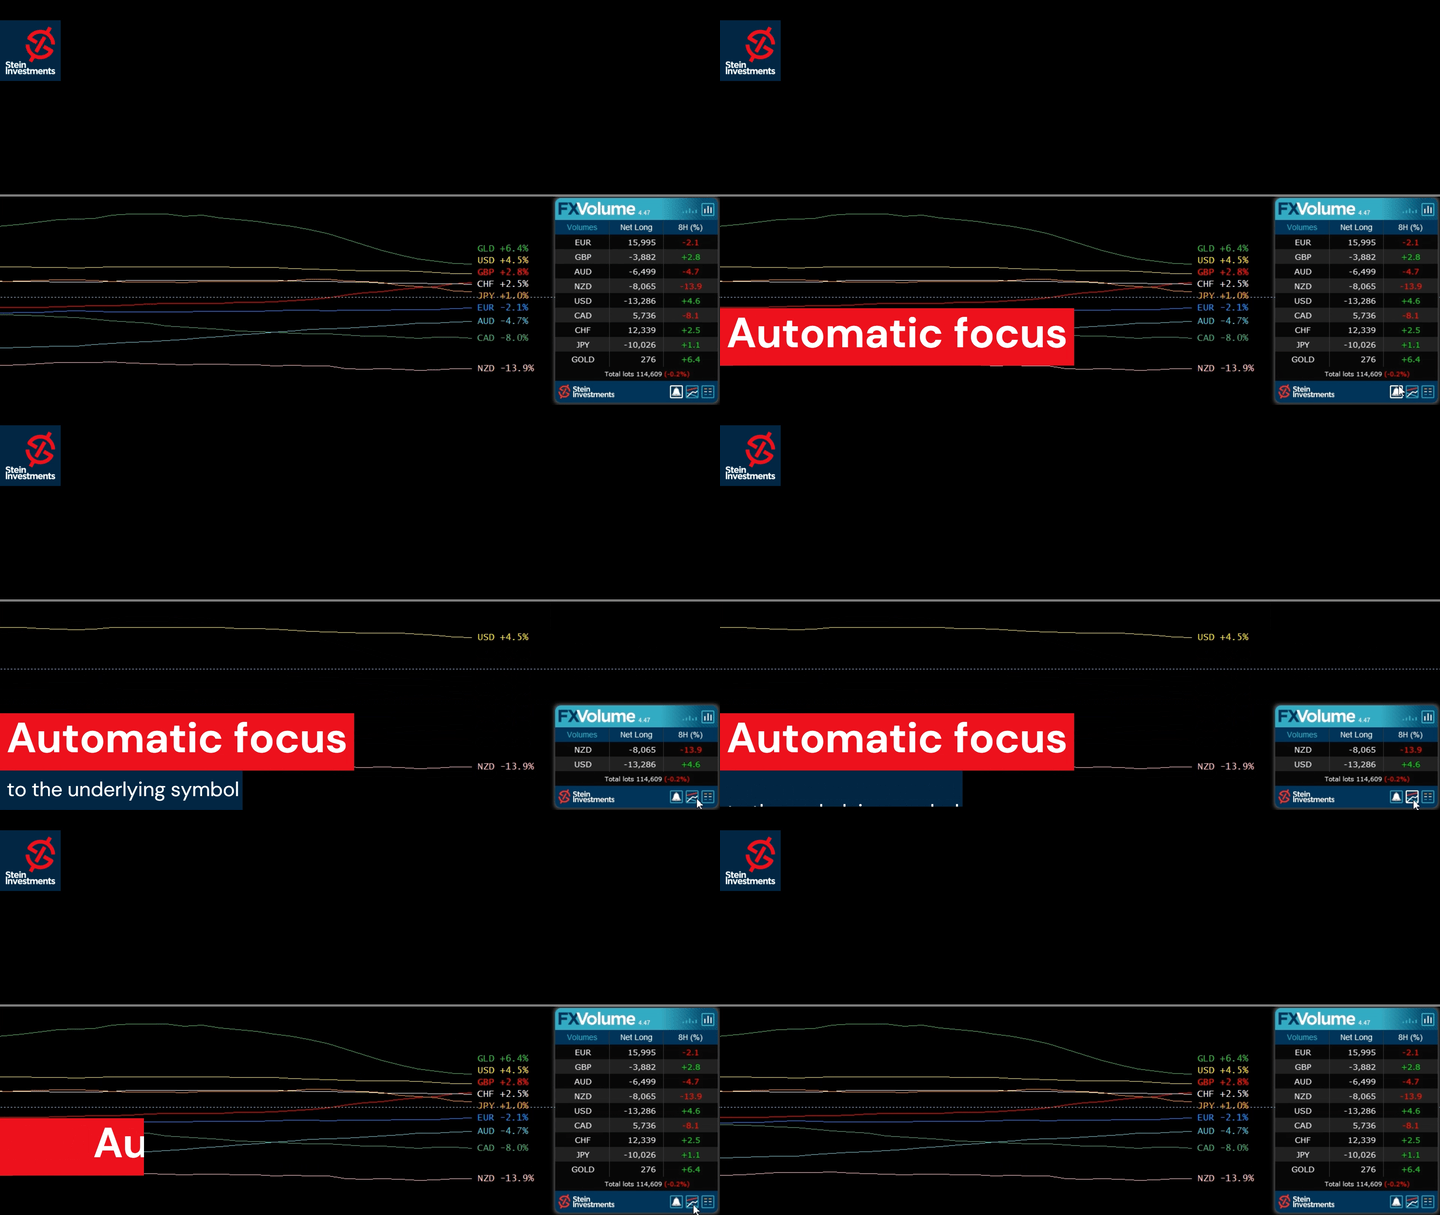
- Added parameter to start with a focus on chart currencies
- Improved backtesting performance
Version 3.35 2021.03.11
Fixed M1 issue when used in the strategy tester
Version 3.34 2021.03.10
Fixed row labels in Changes view
Version 3.33 2021.03.10
Internal refactoring
Changed SI Connect detection method
Improved performance when used in the strategy tester
Version 3.28 2021.02.26
FX Volume GUI enabled in Strategy Tester visual mode when called via iCustom
Version 3.27 2021.02.26
Besides various minor fixes and improvements, we made a few specific improvements when using FX Volume inside an EA and in the strategy tester like:

- Improve behaviour when called from iCustom
- Improved data processing (all modes)
- Fix minor display bugs while using the visual mode
- Disabled alerts in tester mode
Version 3.25 2021.02.22
Optimized SI Connect EA detection in case of heavy usage (more than 20 instances)
Version 3.24 2021.02.17
Fix symbols list display (top of the list possibly hidden)
Version 3.23 2021.02.17
With this update, it's finally possible to combine different views AND comparison periods in just one chart.

In this way, you'll easily see if the short term volume is still dynamic and supporting the volume change of a higher period.
This offers an entirely new grade of precision because you now see exactly when to enter when to exit and if it's still worth to hold the position.

We hope you'll enjoy the new flexibility provided by FX Volume.
Version 3.18 2021.02.10
Fixed bug resulting in orphan objects on the chart

Fixed bug of line style changes when using several instances
Version 3.17 2021.02.04
This release is another huge step forward and provides the following new features.

- Additional colouration for the positive and negative percentage values

- History lines for Volume Total, Volume Long and Volume short are now available

- All history lines can be hidden completely via parameters in the indicator properties

- Use multiple instances of FX Volume in one chart to create individual comparison views.
Note: Every instance has to use a different "History lines and buffers" mode to manage all instances correctly.

- Volume Total, Volume Long and Volume Short are now available in the indicator buffers

IMPORTANT: Please note that the history lines and the panel information is managed independently!
If you switch to a different panel view, this does NOT change the volume history lines. You have to change them in the indicator properties.

Please note also that the value labels of the history lines differ from the information seen in the panel because the panel displays always the latest available information while the history line buffer provides an OHLC volume data average for the entire candle. Please visit our FX Volume info channel at https://t.me/SI_FX_Volume to get more detailed information
Version 3.1 2021.02.01
Renamed view labels for a better usability
Version 3.0 2021.02.01
This major update provides a deeper insight into the real trading market sentiment

Now you can see the total volume of the long and short side separately as well as how it changed during the selected comparison period. With this information, you can easily spot on which side of the market there is an upcoming dynamic in the real trading volume.

And because we are often asked for it we added all this information for GOLD as well.

Enjoy the new amazing features of FX Volume and leave a review if you like it.
Version 2.26 2020.12.21
Fixed minor bug occurring rarely at a terminal restart
Version 2.25 2020.12.18
Minor bug fixed causing an empty panel due to unchanged data

Added special section for the alert option in the indicator properties
Version 2.24 2020.12.16
The following new features have been added:

-Alert on long ratio rise/drop
-Alert on total volume rise/drop
-Alert on delta increase/decrease

We hope you'll enjoy the new alert options.
Version 2.22 2020.12.02
Disabled DEBUG mode
Version 2.21 2020.11.23
Fixed empty panel bug
Version 2.20 2020.09.18
Changed Delta calculation display to provide more accurate results

Added total volume buffer -> ask for the updated code snippets

FX Volume is now ready to be used in the MT4 strategy tester!
Version 2.16 2020.06.24
The panel uses current and raw data only. OHLC is used only for history lines.

Fixed bug in panel update when data are not directly available.

Added an alert for insufficient Terminal "Max bars" settings.
Version 2.0 2020.06.20
Dear customers, please welcome our fantastic FX Volume 2.0. We spent weeks of work designing this beautiful panel, adding excellent features, and providing more detailed information to offer you outstanding user experience and a real edge in trading.

To benefit from all improvements it is necessary that you update FX Volume and SI Connect to the latest available version!
Version 1.26 2020.06.07
Metaquotes provided important fixes in MQL5 and asked us to recompile all our market tools.
So please update your local copy to the latest available to benefit from bug fixes and improvements.
Version 1.25 2020.05.14
Use updated libraries
Version 1.24 2020.03.09
Added security to avoid alert flooding

Fixed bug which checks and sends alert continuously if the data file can't be opened