• Información general
  • Comentarios (16)
  • Discusión (31)
  • Novedades

FX Volume MT5

4.8

Obtenga su actualización diaria del mercado con detalles y capturas de pantalla a través de nuestro Morning Briefing aquí en mql5 y en Telegram!

FX Volume es el PRIMER y ÚNICO indicador de volumen que proporciona una visión REAL del sentimiento del mercado desde el punto de vista de un bróker.

Proporciona una visión impresionante de cómo los participantes institucionales del mercado, como los brokers, están posicionados en el mercado Forex, mucho más rápido que los informes COT.
Ver esta información directamente en su gráfico es el verdadero cambio de juego y una solución innovadora para su trading.

Benefíciese de datos de mercado únicos como

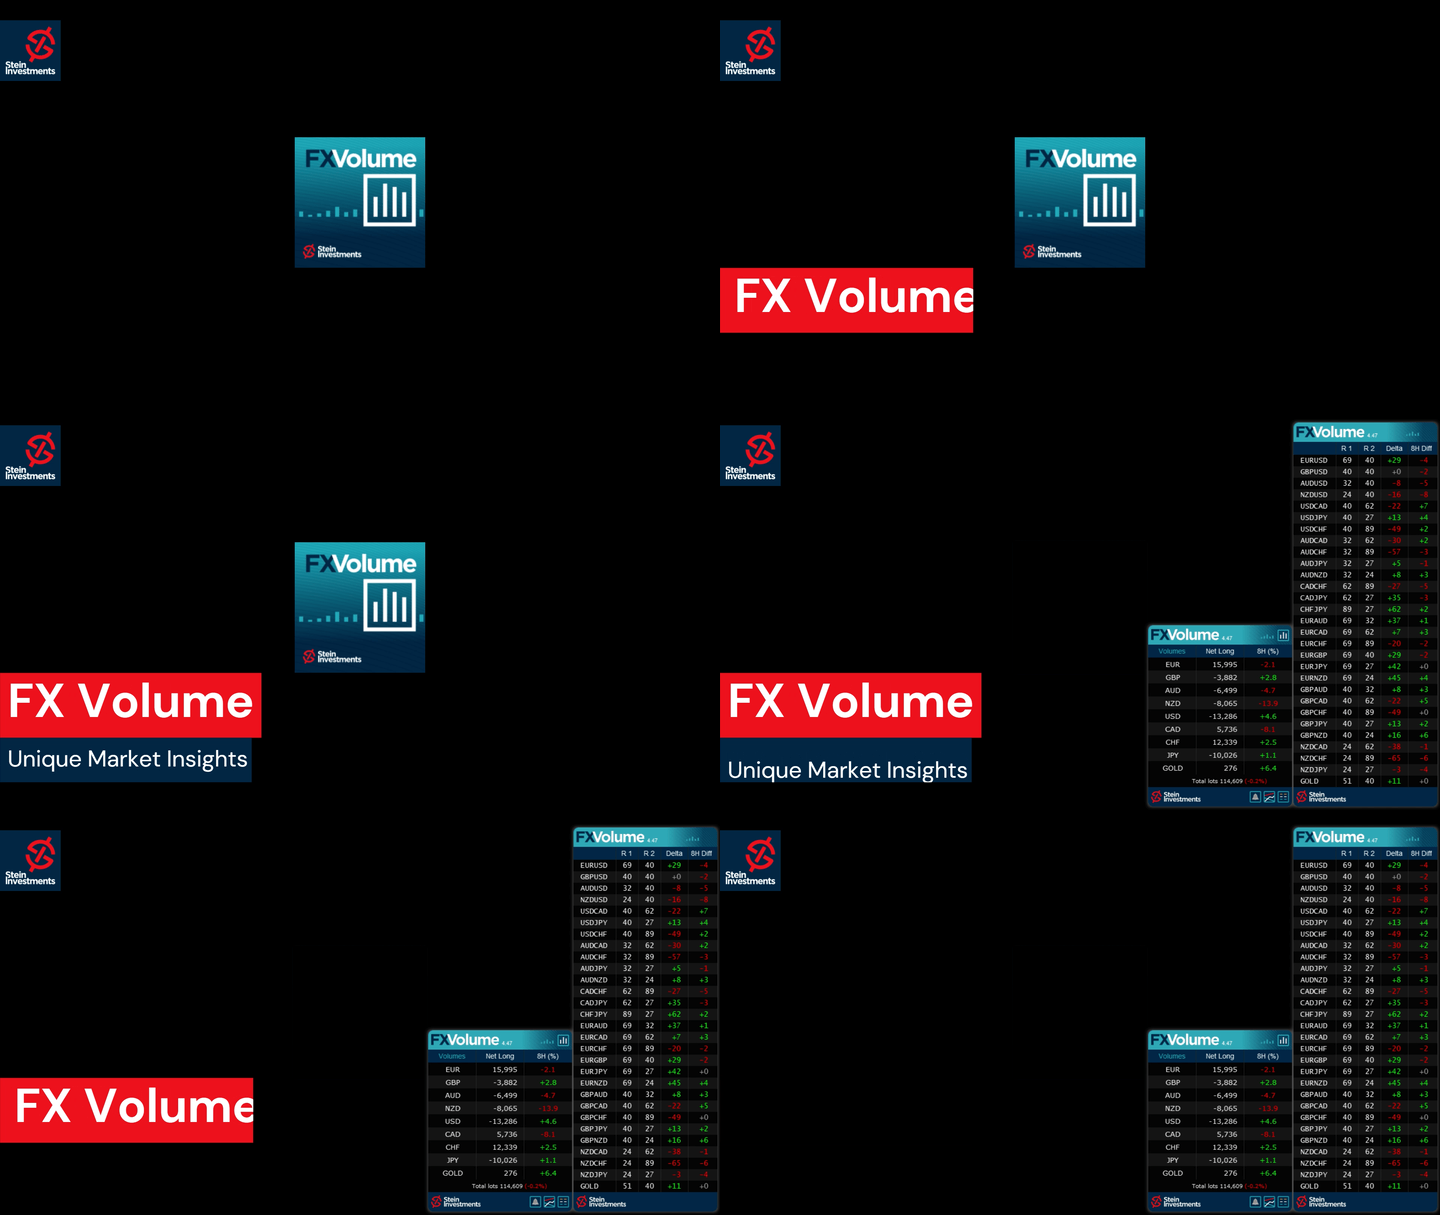
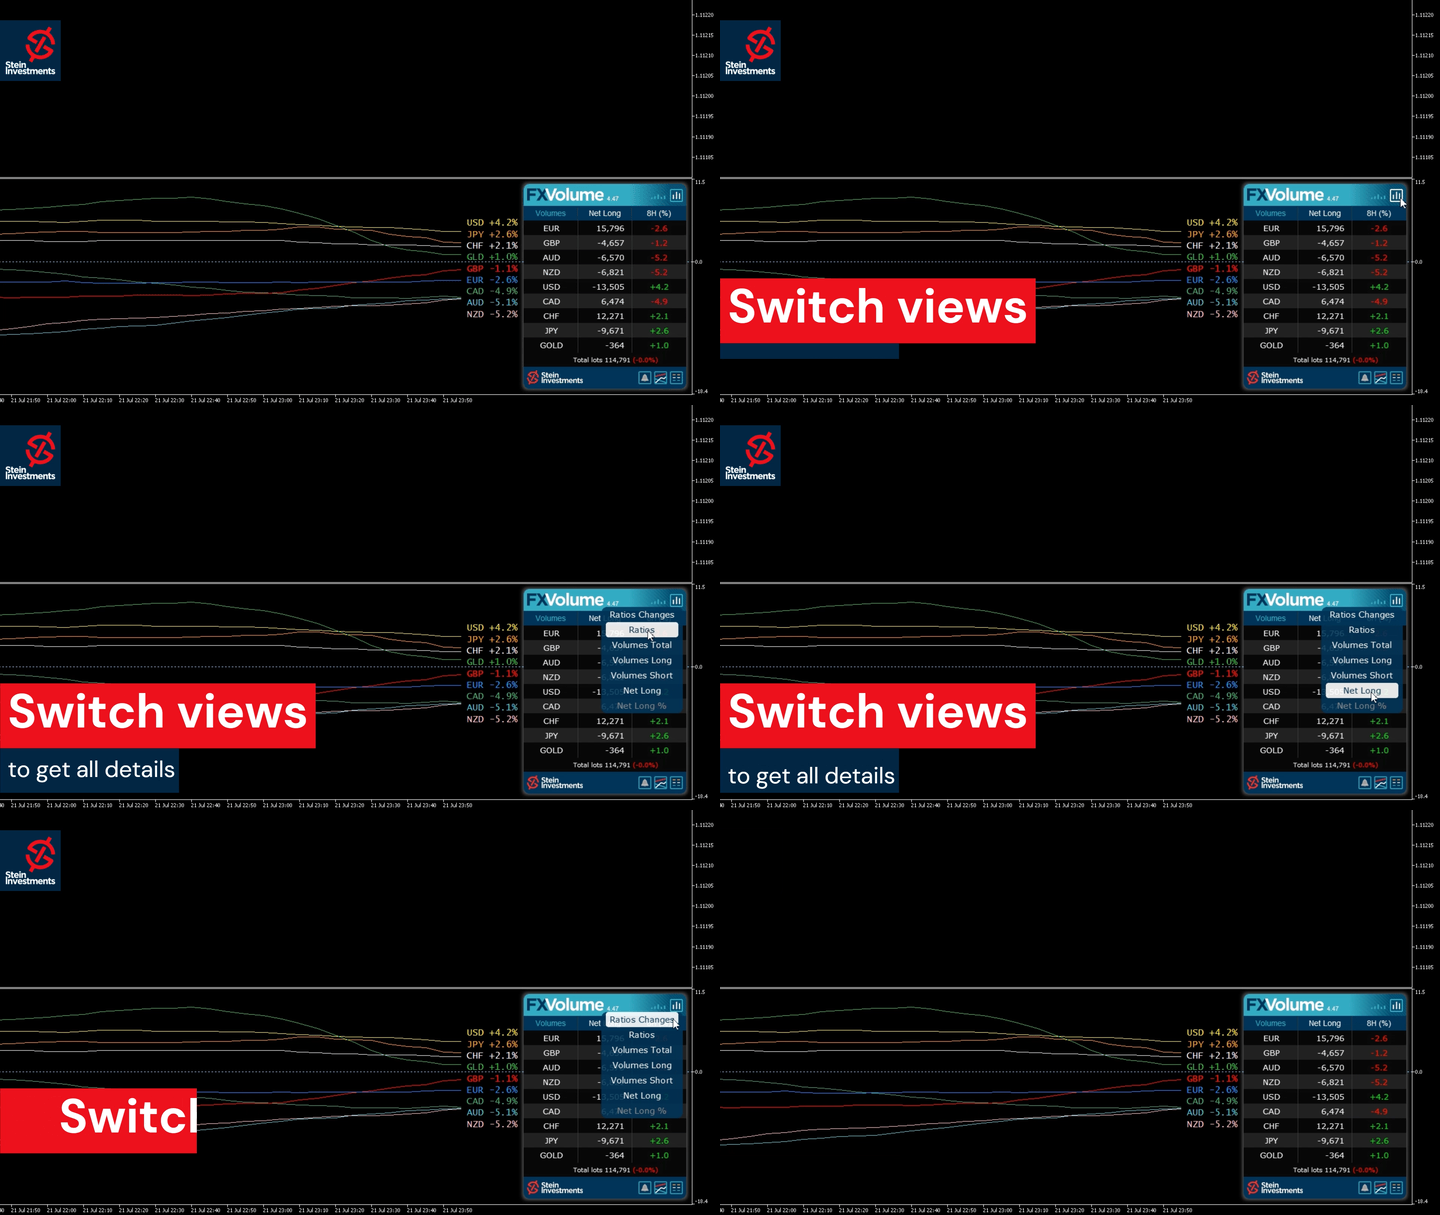
  • Ratios muestra el ratio de posición larga a corta de las divisas en porcentaje
  • Ratios Cambios muestra los ratios largos y su cambio porcentual dentro del periodo de tiempo seleccionado
  • Volúmenes Totales muestra el volumen total negociado (largo y corto) de las divisas en lotes
  • Volúmenes Largos muestra el volumen negociado de todas las posiciones largas de las divisas
  • Volúmenes Cortos muestra el volumen negociado de todas las posiciones cortas de las divisas
  • Neto Largo muestra el volumen neto largo, i.es decir, todas las posiciones largas menos todas las posiciones cortas en lotes
  • Porcentaje largo neto muestra el cambio del volumen largo neto de las divisas

Por favor, lea nuestro tutorial básico -> "Cómo operar con Volumen FX"

Obtenga más información, como preguntas frecuentes, consejos de trading y vídeos tutoriales en nuestro canal público de información sobre el volumen de divisas

Por favor instala y ejecuta SI Connect para establecer una conexión constante con nuestro centro de datos


Información de fondo

Todos sabemos que Forex es un mercado descentralizado. Es por eso que tuvimos que pensar fuera de la caja, desarrollar una solución única y codificar el proyecto más complejo, en el que hemos trabajado para obtener esta información invaluable en nuestros gráficos. Desde octubre de 2018, nuestros servidores analizan y registran datos reales de volumen de operaciones procedentes de distintas fuentes de todo el mundo. Recopilamos los datos, analizamos cómo cambia el volumen de operaciones y calculamos un índice para las divisas más importantes del mercado Forex, pero esto es solo el principio. Más adelante, proporcionaremos dicha información para otros instrumentos de negociación como el Oro y el Petróleo también.


¿Cuál es el beneficio de utilizar los datos de volumen reales proporcionados por Stein Investments?

1. El volumen real de las operaciones en el mercado Forex es muy alto. Debido al punto de vista de nuestros brokers, puede operar fácilmente con el dinero inteligente

2. Obtiene este tipo de datos de mercado de sentimiento en tiempo real directamente en su gráfico

3. Debido a nuestra base de datos de historial registrado en tiempo real, puede comprobar fácilmente lo valiosa que es esta información

FX Volume es absolutamente único ¡porque es la única herramienta que es capaz de imprimir estos datos directamente en su gráfico!


¿Por qué sólo está disponible en alquiler?

Como se ha descrito anteriormente, FX Volume es un servicio continuo con una infraestructura de backend que cuesta, así como los administradores y codificadores que supervisan y mejoran toda la construcción, como la base de datos en segundo plano y el front-end gráfico que se carga en sus gráficos.

Es por eso que tenemos que cobrar una cuota recurrente justa, pero FX Volume se pagará fácilmente por sí mismo.
Además, ofrecemos grandes descuentos para suscripciones a medio y largo plazo.


Configuración del indicador FX Volume

  • Zona DST del broker y cambio GMT - Por favor, busque en Google o pregunte al soporte de su broker para obtener los valores correctos
  • Comparar con X horas atrás - Establezca un valor por hora para la comparación de Ratio y Delta. El valor predeterminado es 24 horas atrás.
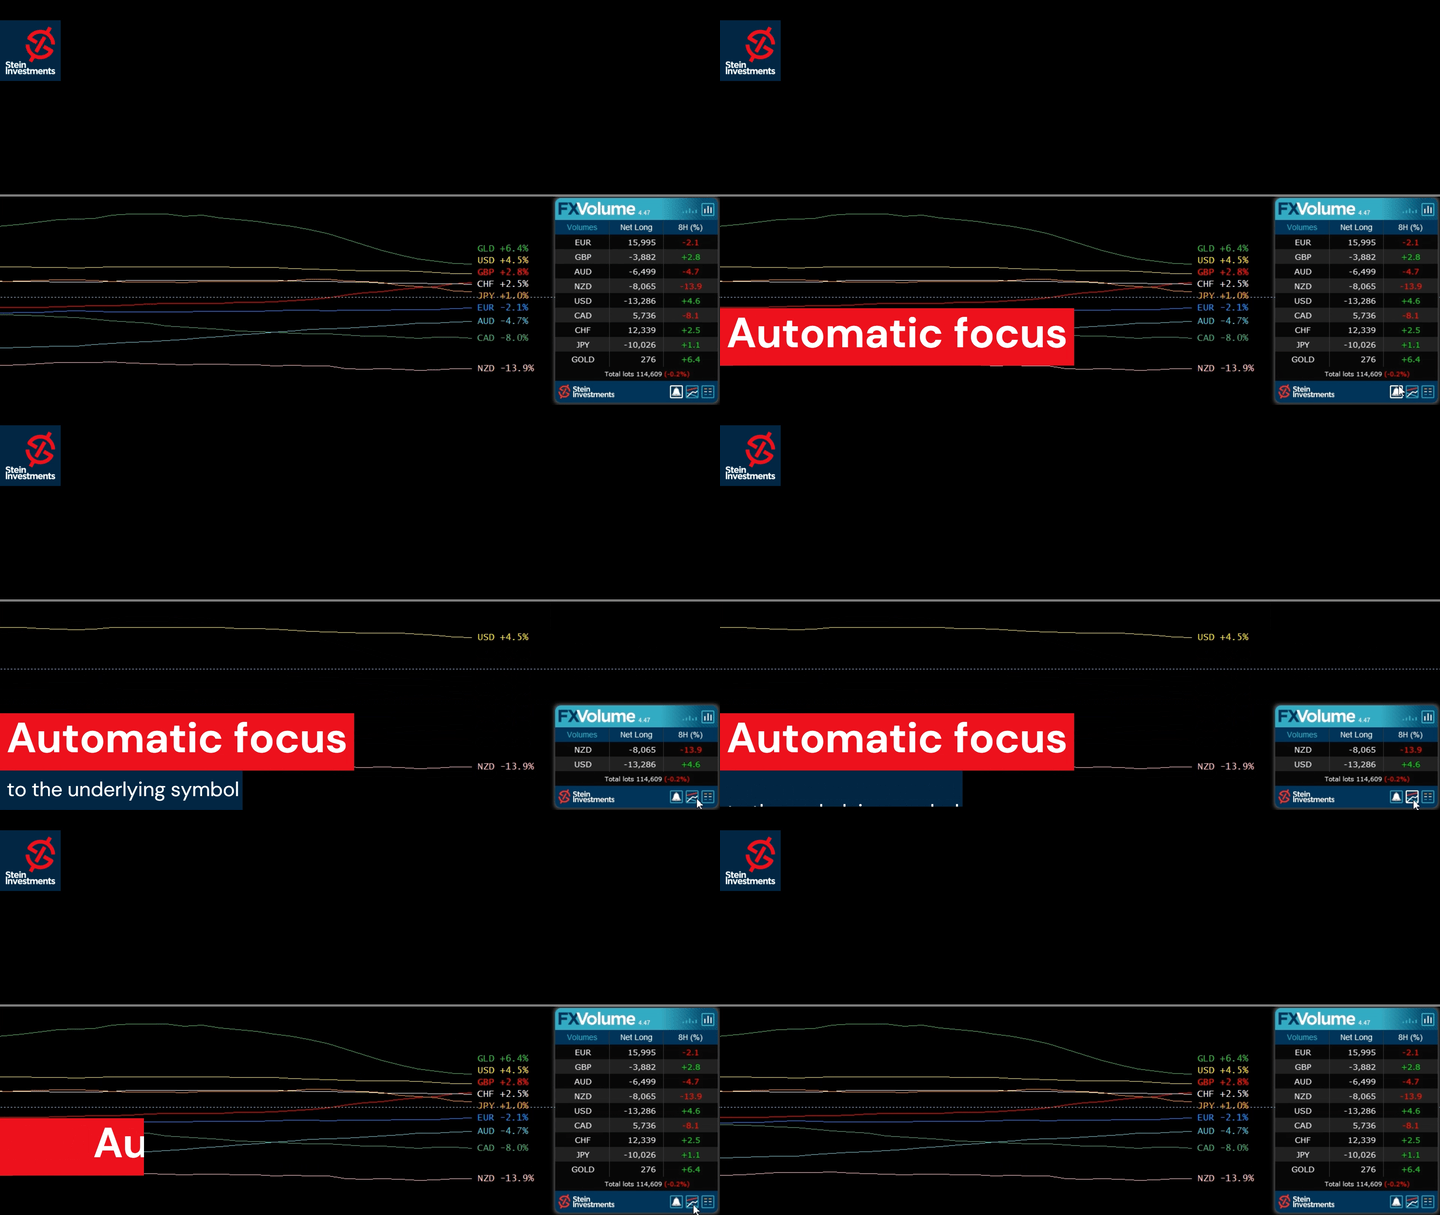
  • Mostrar todas las líneas del historial - Establezca en "false" para ver sólo las líneas del historial de las divisas relacionadas con el símbolo
  • Vista predeterminada - Elija entre la vista Ratio y Cambios
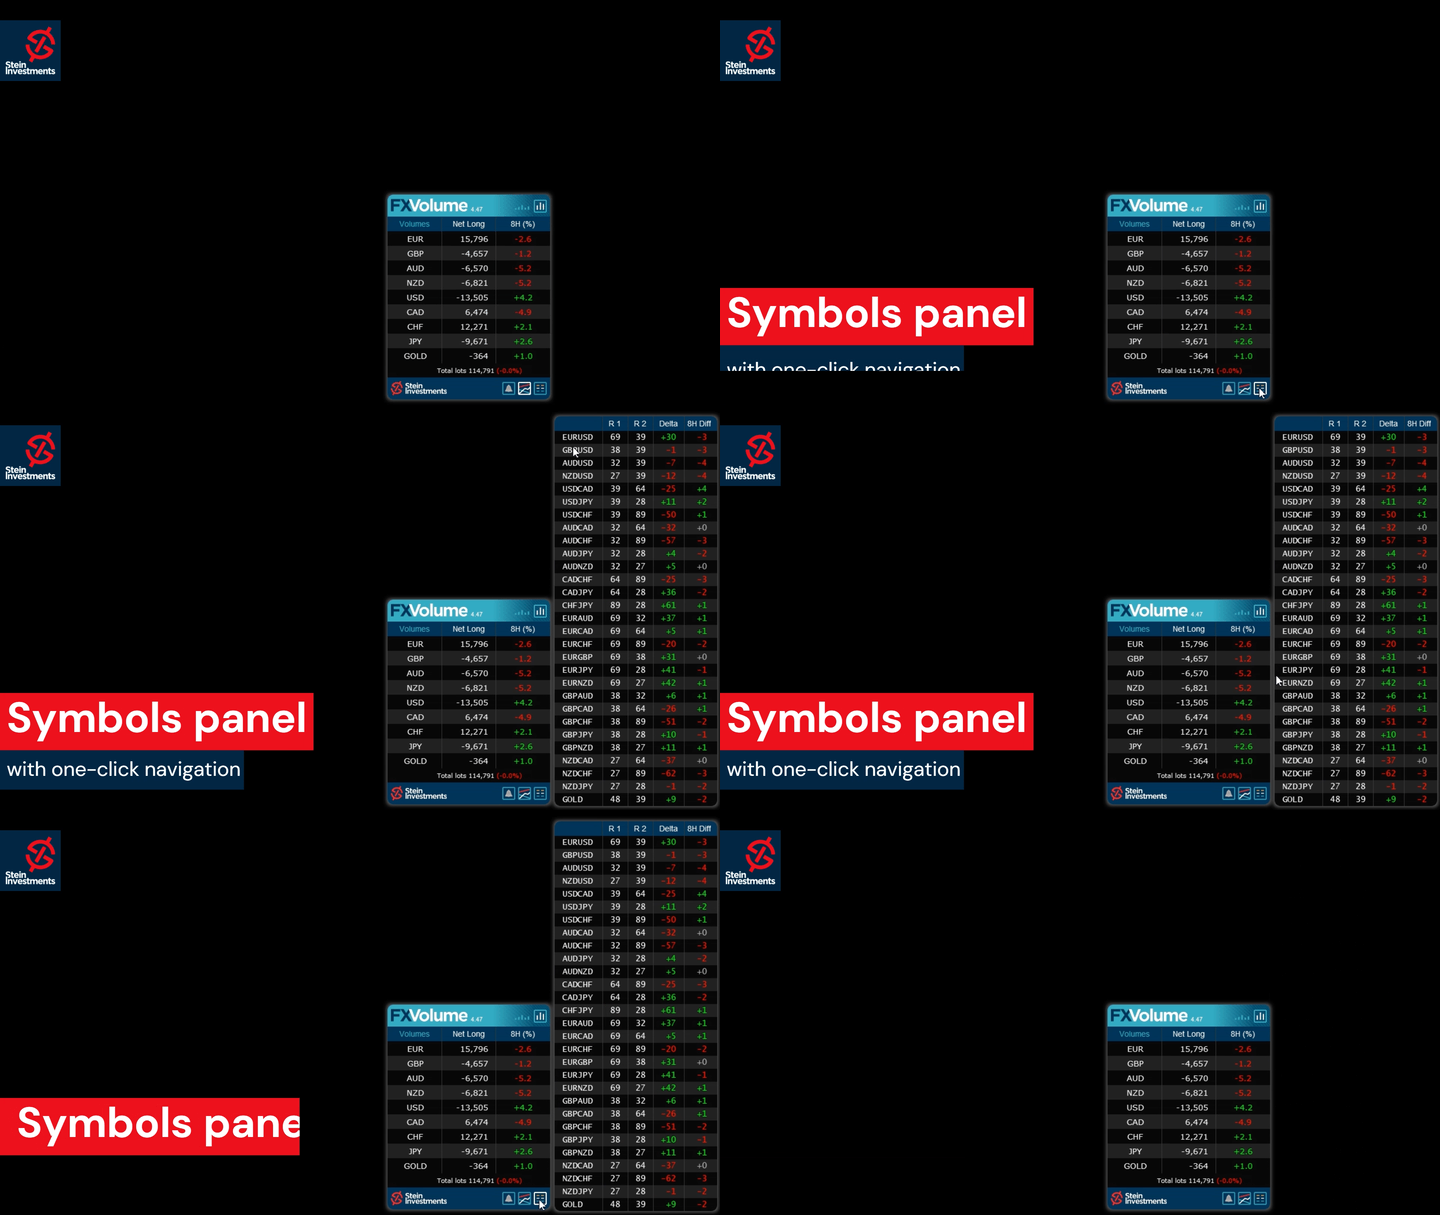
  • Mostrar lista de símbolos -. Establezca en "false" para ocultar la lista de 28 símbolos en el gráfico principal
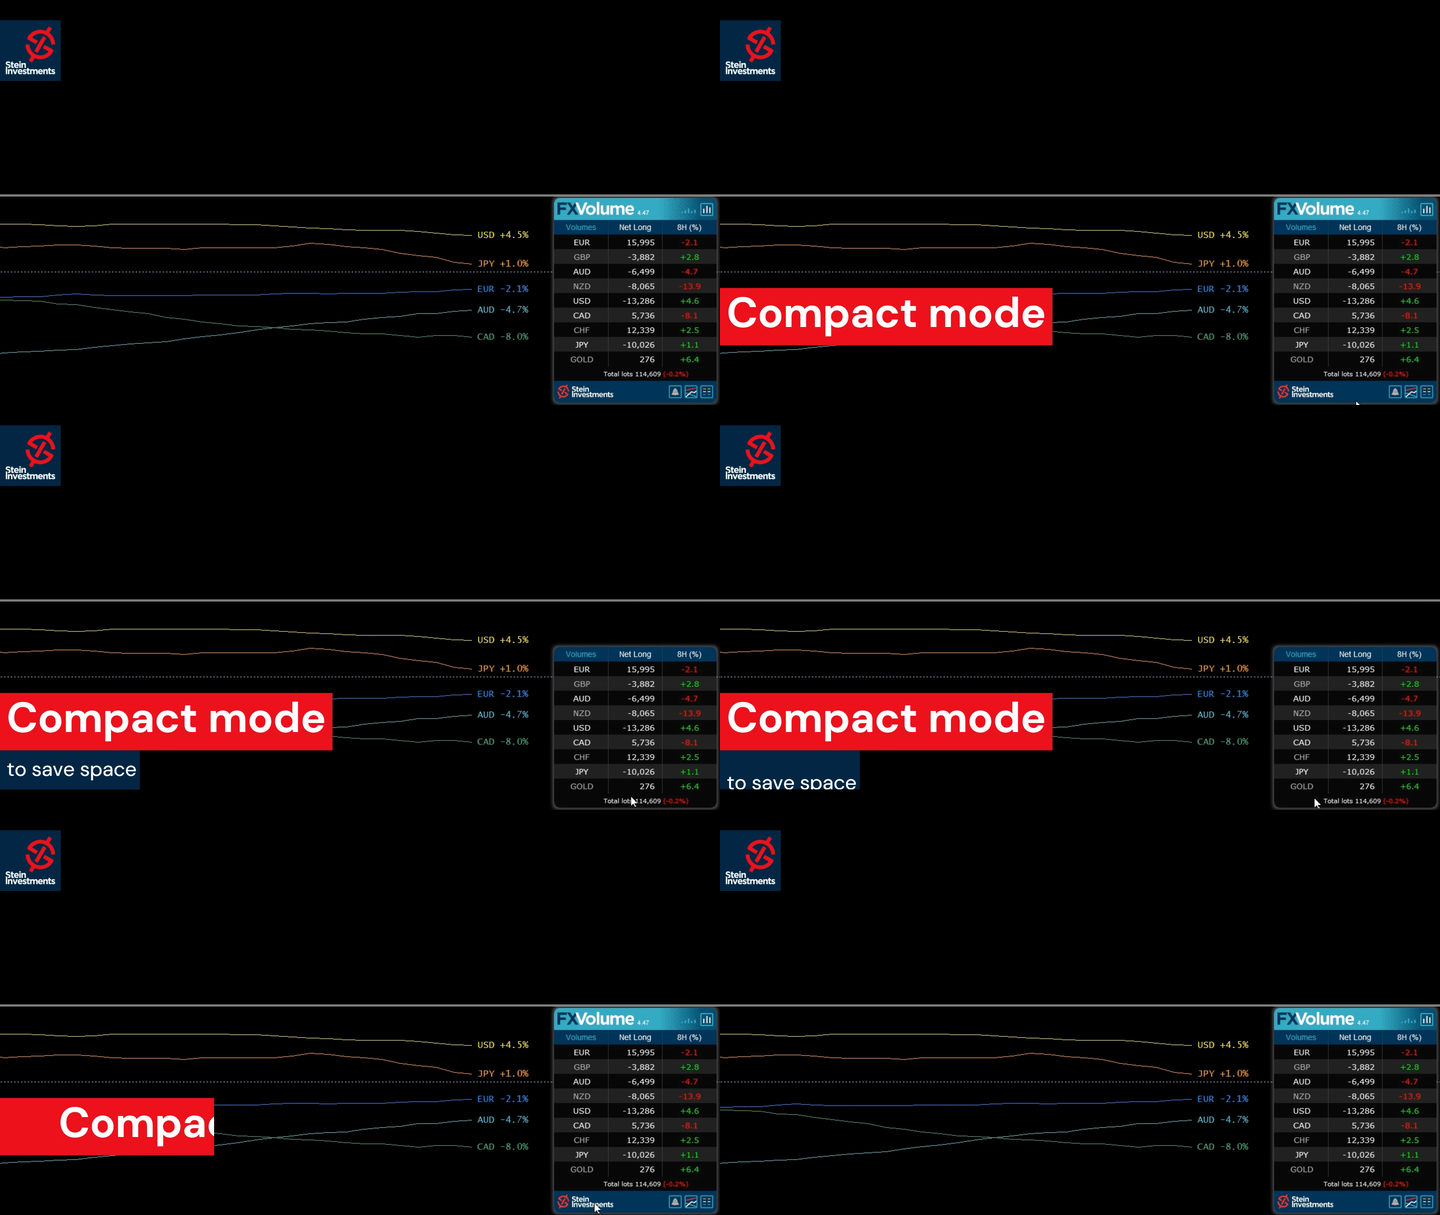
  • Factor de zoom - Aumente o disminuya el tamaño de todos los elementos gráficos


¿Desea convertirse en un operador de Forex 5 estrellas constantemente rentable?

Entonces obtén nuestras herramientas de trading de Stein Investments y envíanos una captura de pantalla para obtener tu invitación personal a nuestro chat de trading exclusivo con 500 miembros.


Comentarios 16
Oliver Henry
585
Oliver Henry 2023.07.24 22:20 
 

Very good indicator and totally unique on the retail forex market. The insight a trader can get from this is a real edge for trading. The support is also very good as are the daily updates that are published on the chat group.

bandelero
354
bandelero 2023.06.16 16:15 
 

I have now closed the second week of trading with FX Power and FX Volume with net gain of 2.7%. I am really pleased how the indicators gives me a quick overview of the market and help me to choose the relevant currency to trade for the day.

Khuman Bakhramirad
8827
Khuman Bakhramirad 2023.05.18 13:15 
 

its an amazing indicator, once you combine it with other tools its very good.

Productos recomendados
Simple Weis Wave
Jean Jacques Huve Ribeiro
4 (4)
One of the best tools for analyzing volume, Weis Wave was idelized by David Weis, to facilitate the reading of directional flow. For the VSA method disciples it is an evolution of the practices created by Richard Wycoff, facilitating a predictive reading of the market, always seeking an accumulation and distribution of the negotiated contracts. Cumulative wave volume  Range of wave ( removed) Average Wave volume Ref "Tim Ord lectures" ( removed)
FREE
The Volume Weighted ATR indicator is a helpful tool for measuring market activity. It is based on the idea of the Volume-Weighted ATR. Combining these two elements helps identify potential turning points or breakout opportunities. The indicator for the classification of the activity of the market uses the moving average and its multiples. Accordingly, where the VWATR bar is located (relative to the moving average), it is labelled as ultra-low, low, average, high, very high or ultra high. The Vo
FREE
White Weis Volume Ticks
Ricardo Almeida Branco
5 (3)
White Weis Volume This indicator shows the sum of the volume in each wave, bulish or bearish, as idealized by David Weis , but it brings an important addition , which is the marking of the bar with the highest volume of the wave (White Bar)! In coding the indicator, it was sought to optimize the code to require minimal processing during use and not to overload mt5. The indicator can be used for pre-trading analysis and study, where the trader analyzes possible points of support and resi
30 USD
A countdown timer for the  Volume bar chart generator  and  Tick chart generator  products, which are available for download from the MQL5 Market: Tick chart generator: https://www.mql5.com/en/market/product/29215 Volume bar chart generator: https://www.mql5.com/en/market/product/47197 The counter conveniently displays the number of ticks or transactions (depending on the chart) that need to pass for a new bar to start printing. The user can set the following indicator inputs. Volume type
FREE
Sweet VWAP MT5
Francisco Gomes Da Silva
4.1 (10)
Descubre dónde las grandes instituciones están negociando y optimiza tus inversiones con el Indicador VWAP Ancorada Gratuita ¡Descubre el precio en el que las grandes instituciones están haciendo negociaciones con nuestro Indicador VWAP Ancorada Gratuita ! Ahora puedes ahorrar tu valioso tiempo automatizando la trama de tus VWAPs ancladas en los máximos y mínimos del mercado. Nuestra versión gratuita te permite visualizar fácilmente la VWAP en tiempo real, siguiendo el movimiento del puntero del
FREE
Automatic Vwap Midas
Ricardo Almeida Branco
5 (1)
The 3 Automatic Vwap (Midas) Indicator can be used for Price and Volume studyers to map the movement of market drivers. It automatically plots 3 Vwaps, two of which are dynamic and will be updated throughout the day if new highs or new lows emerge. The third Vwap is daily and can help if the trend is up or down. Also, an auxiliary indicator that plots (also dynamic) points of interest with OHLC prices (Open, High and Low of the current day and Close of the previous day) was inserted. Success and
40 USD
VWAP Indicator
LUC JACOBUS A VERHEECKE
4.24 (17)
Volume Weighted Average Price (VWAP) The volume weighted average price (VWAP) is a   trading   benchmark   used by traders that gives the average price a security has traded at throughout the day, based on both volume and price. It is important because it provides traders with insight into both the trend and value of a security. This indicator VWAP V2 is free and is the manual version of the extended Easy VWAP indicator (30 Euro), where the date and time properties are automatically entered. Wit
FREE
Value Chart Candlesticks
Flavio Javier Jarabeck
4.8 (5)
The idea of a Value Chart indicator was presented in the very good book I read back in 2020 , " Dynamic Trading Indicators: Winning with Value Charts and Price Action Profile ", from the authors Mark Helweg and David Stendahl. The idea is simple and the result is pure genius: Present candlestick Price analysis in a detrended way! HOW TO READ THIS INDICATOR Look for Overbought and Oversold levels. Of course, you will need to test the settings a lot to find the "correct" one for your approach.
FREE
MIDAS Super VWAP
Flavio Javier Jarabeck
4.23 (13)
Imagine VWAP, MVWAP and MIDAS in one place... Well, you found it! Now you can track the movement of Big Players in various ways, as they in general pursue the benchmarks related to this measuring, gauging if they had good execution or poor execution on their orders. Traders and analysts use the VWAP to eliminate the noise that occurs throughout the day, so they can measure what prices buyers and sellers are really trading. VWAP gives traders insight into how a stock trades for that day and deter
FREE
VWAP and MVWAP
Flavio Javier Jarabeck
4.17 (6)
Volume Weighted Average Price (VWAP) is a trading benchmark commonly used by Big Players that gives the average price a Symbol has traded throughout the day. It is based on both Volume and price. Additionally we put in this indicator the MVWAP (Moving Volume Weighted Average Price). For those who do not know the usage and the importance od this indicator I recommend a great article about this subject at Investopedia ( https://www.investopedia.com/articles/trading/11/trading-with-vwap-mvwap.asp )
FREE
Weis Waves
Flavio Javier Jarabeck
3.24 (25)
The original author is David Weis, an expert in the Wyckoff Method. The Weis Wave is a modern adaptation of the 1930's Wyckoff Method, another expert in Tape Reading techniques and Chart Analysis. Weis Waves takes market volume and stacks it into waves according to price conditions giving the trader valuable insights about the market conditions. If you want to learn more about this subject you can find tons of videos in YouTube. Just look for "The Wickoff Method", "Weis Wave" and "Volume Spread
FREE
Aggression Volume
Flavio Javier Jarabeck
3.79 (19)
Aggression Volume Indicator is the kind of indicator that is rarely found in the MQL5 community because it is not based on the standard Volume data provided by the Metatrader 5 platform. It requires the scrutiny of all traffic Ticks requested on the platform... That said, Aggression Volume indicator requests all Tick Data from your Broker and processes it to build a very special version of a Volume Indicator, where Buyers and Sellers aggressions are plotted in a form of Histogram. Additionally,
FREE
Cybertrade Keltner Channels
Emanuel Andriato
4.67 (3)
Cybertrade Keltner Channels - MT5 Created by Chester Keltner, this is a volatility indicator used by technical analysis. It is possible to follow the trend of financial asset prices and generate support and resistance patterns. In addition, envelopes are a way of tracking volatility in order to identify opportunities to buy and sell these assets. It works on periods longer than the period visible on the chart. All values ​​are available in the form of buffers to simplify possible automations.
FREE
Weis Wave Double Side Alert
Eduardo Da Costa Custodio Santos
El indicador lateral Weis Wave Bouble para MT5 es parte del conjunto de herramientas (Wyckoff Academy Wave Market) El indicador lateral Weis Wave Bouble para MT5 se creó en base al ya establecido Weis Wave creado por David Weis. El indicador Weis Wave Double Side lee el mercado en ondas como lo hizo R. Wyckoff en 1900. Ayuda a identificar esfuerzo x resultado, causa y efecto, oferta y demanda. Su diferencial es que se puede usar debajo del eje cero y tiene una alerta de ruptura que muestra Quien
60 USD
This z-score indicator shows the correct z-score of an asset, as it uses the normalized price data for calculation, which is the only correct way. Z-score is only applicable for normal distributed data, therefore not the actual price is considered, but the normalised returns, which were assumed to follow a normal distribution. Returns are mean reverting and assumed to follow a normal distribution, therefore z-score calculation of returns is more reliable than z-score on price, as price is NOT m
99 USD
This indicator is stand alone version from  MP Pivot Levels  (All in one) containing Demark's Pivots. Calculations:     PP = X / 4     R1 = X / 2 - LOWprev     S1 = X / 2 - HIGHprev Uses: When the pair currency price may change the direction of movement. Possible constraints of support and resistance that creates plateaus for the currency pair prices. Tendency identification by comparing the present prices according to current day's pivot point and also the prior day's pivot points. ___________
FREE
Wave Box Market Frenquency
Jean Jacques Huve Ribeiro
4.75 (4)
Totally linked to the result of a movement and the duration he had. Its height records how many ticks the asset walked during a given movement, its width shows us the duration that movement had. Its configuration must be in line with the Weis Wave Indicator configuration to observe the movement force and can indicate a possible accumulation or distribution of the movement;
FREE
Stackable VWAP
Flavio Javier Jarabeck
3.8 (5)
Volume Weighted Average Price (VWAP) is a trading benchmark commonly used by Big Players that gives the average price a Symbol has traded throughout the day. It is based on both Volume and price. Additionally we put in this indicator the MVWAP (Moving Volume Weighted Average Price). For those who do not know the usage and the importance od this indicator I recommend a great article about this subject at Investopedia ( https://www.investopedia.com/articles/trading/11/trading-with-vwap-mvwap.asp
FREE
MW Volume
Martin Bittencourt
3.75 (4)
El indicador de volumen Martinware traza un promedio móvil coloreado sobre las barras de volumen. La coloración utiliza tres colores y puede hacerse de diferentes maneras elegibles por el usuario y se aplica tanto al promedio como a las barras de volumen. Son posibles tres tipos de coloración: Ninguno: no se realiza ninguna coloración Aumentando o disminuyendo: cambia el color dependiendo de que el valor actual sea mayor o menor que el anterior Volumen relativo al promedio: los colores varí
FREE
This indicator sums up the difference between the sells aggression and the buys aggression that occurred in each Candle, graphically plotting the waves of accumulation of the aggression volumes.   Through these waves an exponential average is calculated that indicates the direction of the business flow. Note: This indicator DOES NOT WORK for Brokers and/or Markets WITHOUT the type of aggression (BUY or SELL).   Be sure to try our Professional version with configurable features and alerts:  Agr
FREE
Waves Sizer
Flavio Javier Jarabeck
3.67 (3)
Wyckoff fans, enjoy! Ideally to be used with the Weis Waves indicator, but it can be easily used alone, the Waves Sizer puts the range (in resulting Price movement) done by the Price on its market swings. You can control how accurate or loose will be the swings. This tool is very helpful for visually know how much the Price has traveled in your Timeframe. This way you can confront this level of effort with the resulting Volume, etc... Weis Waves indicator: https://www.mql5.com/en/market/pro
FREE
Santa Donchian
Marco Aurelio Cestari
4.2 (5)
Santa Donchian Indicator  is an efficient way to detect support, resistence and break outs in any market. The Donchian channel measures the high and the low of a previously defined range.  Typically, a trader would look for a well-defined range and then wait for the price to break out to either one side for a trade entry trigger. Advantages Never repaints, never backpaints, never recalculates. Works in all symbols and all timeframes. Perfect trend filter for any strategy or expert advisor. Fu
FREE
Weis Wave Double Side
Eduardo Da Costa Custodio Santos
El indicador lateral Weis Wave Bouble para MT5 es parte del conjunto de herramientas (Wyckoff Academy Wave Market) El indicador lateral Weis Wave Bouble para MT5 se creó en base al ya establecido Weis Wave creado por David Weis. El indicador Weis Wave Double Side lee el mercado en ondas como se hizo por R. Wyckoff en 1900. Ayuda a identificar esfuerzo x resultado, causa y efecto, oferta y demanda. Su diferencial es que se puede utilizar por debajo del eje cero, mejorando aún más más lectura del
30 USD
LT Weis Waves
Thiago Duarte
5 (11)
The Weis Wave first takes the market volume and then organizes it with the price into Wave charts. It is the only software that will present the true picture of the market before you. If anyone of you, has watched an intraday price movement then you must know that it unfolds in a series of selling as well as buying waves-a procedures tearing down and building up. Wave analysis is an integral part of the trading method. The indicator helps to deal with today’s volatile market. Moreover, it works
FREE
Ultimate Retest
Nguyen Thanh Cong
5 (1)
Introduction The "Ultimate Retest" Indicator stands as the pinnacle of technical analysis made specially for support/resistance or supply/demand traders. By utilizing advanced mathematical computations, this indicator can swiftly and accurately identify the most powerful support and resistance levels where the big players are putting their huge orders and give traders a chance to enter the on the level retest with impeccable timing, thereby enhancing their decision-making and trading outcomes.
FREE
Volume Weighted Average Price or VWAP is an indicator wich shows different average prices on chart. This is very useful to find strong negotiation price areas and as trend following. Configurations: Day, Week and Month - Show different VWAPs according to the period. You can change each line style on "colors" tab. Any doubt or suggestion please contact us. Enjoy! This is a free indicator, but it took hours to develop. If you want to pay me a coffee, I appreciate a lot   <3 PayPal, Skrill, Ne
FREE
Donchian Pro
Paulo Henrique Faquineli Garcia
5 (1)
The Donchian Channel Channels are among the most popular tools of technical analysis, as they visually convey to the analyst the limits within which most price movement tends to occur. Channel users know that valuable information can be obtained at any time, whether prices are in the central region of a band or close to one of the border lines. One of the best known techniques to explore these concepts is Bollinger Bands. However, John Bollinger was not the only one to research the applicatio
FREE
AvgVolumes
Marco Montemari
5 (1)
This indicator is based on Volumes standard indicator, calculates the average of Volumes based on the last N bars set by users, and if the value of the volume is bigger then a set % respect the average a different color will be used. The indicator is shown in a separate indicator window. This version has now a limitation in setting the % about the threshold. If you are interested to set threshold consider to buy the PRO version ( https://www.mql5.com/en/market/product/35925 ) If you want to use
FREE
My Candle Patterns
Francisco Gomes Da Silva
Este indicador es una versión de demostración del completo My candle, que se puede descargar aquí: Creador de Patrones de Velas Con la versión completa, puedes crear tus propias reglas de velas y modificar un patrón de vela tradicional para que sea más preciso según tu estrategia. El indicador incluye varias reglas de velas de ejemplo, pero aquí solo mostraré algunas: Pattern Rule Candle Green C > O Candle Red C < O Doji C = O Hammer (C > O and (C-O) *2 < O-L and (C-O) *0.5 > H-C) or (C < O and
FREE
Description The indicator uses market profile theory to show the most relevant trading zones, on a daily basis. The zones to be shown are LVN (low volume nodes) and POC (point of control). An LVN zone is one which represents price areas with the least time or volume throughout the day. Typically, these areas indicate a supply or demand initiative, and in the future, they can turn into important breakout or retracement zones. A POC zone is one which represents price areas with the most time or vo
FREE
Los compradores de este producto también adquieren
Este es un genial indicador para MT5 que ofrece señales precisas para entrar en una transacción sin redibujar. Se puede aplicar a cualquier activo financiero: fórex, criptomonedas, metales, acciones, índices. Nos dará valoraciones bastante precisas y nos dirá cuándo es mejor abrir y cerra una transacción. Eche un vistazo  al vídeo  (6:22), ¡contiene un ejemplo de procesamiento de una sola señal que ha amortizado el indicador! La mayoría de los tráders mejoran sus resultados comerciales durante l
125 USD
Price action trading, Trend trading strategies, Trend following indicators, Trend detection, Range identification, Smart Trend Trading System Indicator, Comprehensive trading system, Multi-indicator approach, Trend following strategy, Range reversal strategy, Smart Trend Cloud, Smart Reversal Zones, Trend Breakout Catcher, Smart Trailing Stop, Multi-timeframe trend finder, Complete trading toolkit, Market trend analysis, Range-bound market signals, Confident trading decisions, Price movement in
100 USD
Blahtech Supply Demand MT5
Blahtech Limited
4.54 (13)
Was: $299    Now: $149   Supply Demand uses previous price action to identify potential imbalances between buyers and sellers. The key is to identify the better odds zones, not just the untouched ones. Blahtech Supply Demand indicator delivers functionality previously unavailable on any trading platform. This 4-in-1 indicator not only highlights the higher probability zones using a multi-criteria strength engine, but also combines it with multi-timeframe trend analysis, previously confirmed swi
149 USD
Robos
Namu Makwembo
5 (2)
Big promotion on the Robos, Get yours now Robos Indicator The   ROBOS   indicator is a multi timeframe oscillator that targets the   overbought   and   oversold  regions of a price chart, a signal is indicated by the two lines crossing, compatible with all tradable instruments Latest Release The latest release is the version 4.0 #What's new in version 4.0 ? Features Extreme oversold and overbought levels ROBOS version  4.0  comes with cool new feature , the ability to target on
255 USD
The Quantum VPOC indicator has been developed to expand the two dimensional study of volume and price, to a three dimensional one which embraces time. The volume/price/time relationship then provides real insight to the inner workings of the market and the heartbeat of sentiment and risk which drives the price action accordingly. The Quantum VPOC indicator displays several key pieces of information on the chart as follows: Volume Profile - this appears as a histogram of volume on the vertical pr
197 USD
ICT Analysis, SMC Trading Strategies, Smart Money Concepts, Smart Money Insights,   Institutional Perspective,     Banks and Institutions Liquidity,   Liquidity Analysis, Institutional Trading, Market Predictions, Price Movement Analysis,   Trading with Institutions,  Trend Analysis Tool, Price Action Indicator, Market Structure Analysis, Order Block Detection,   Support and Resistance Levels,   BOS and CHoCH Patterns,  Momentum Shift Indicator, Supply and Demand Zones Locator, Strong Imbalance
100 USD
¿Está buscando un potente indicador de compraventa de divisas que pueda ayudarlo a identificar oportunidades comerciales rentables con facilidad? No busque más allá de Beast Super Signal. Este indicador basado en tendencias fácil de usar monitorea continuamente las condiciones del mercado, buscando nuevas tendencias en desarrollo o saltando sobre las existentes. Beast Super Signal da una señal de compra o venta cuando todas las estrategias internas se alinean y están en 100% de confluencia entre
143.20 USD
Was: $249    Now: $149   Market Profile defines a number of day types that can help the trader to determine market behaviour. A key feature is the Value Area, representing the range of price action where 70% of trading took place. Understanding the Value Area can give traders valuable insight into market direction and establish the higher odds trade. It is an excellent addition to any system you may be using. Blahtech Limited presents their Market Profile indicator for the MetaTrader community.
149 USD
Introduction to Chart Pattern MT Chart Pattern MT is a chart pattern scanner to detect the triangle pattern, falling wedge pattern, rising wedge pattern, channel pattern and so on. Chart Pattern MT uses highly sophisticated chart pattern detection algorithm. However, we have designed it in the easy to use with intuitive user interface. Chart Pattern MT will show all the patterns in your chart in the most efficient format for your trading. You do not have to do tedious manual pattern detection an
180 USD
Support and Resistance, Trading System, Indicator, Candlestick Patterns, VWAP, Trend Catcher, Multi-Timeframe Trend, Support Levels, Resistance Levels, Trading Strategies, Complete Trading System, Technical Analysis, Forex Trading, Price Action, Market Trends, Trading Signals, Trend Identification, Swing Trading, Day Trading, Swing Trading Strategies, Technical Indicators, Trading Tools, Trend Confirmation, Entry and Exit Points, Trading Panel, Forex Signals, Trend Reversals, Trading Algorithms
100 USD
Advanced Supply Demand MT5
Bernhard Schweigert
4.36 (11)
¡Actualmente con 33% de descuento! ¡La mejor solución para cualquier tráder principiante o experto! Este indicador es una herramienta comercial única, de alta calidad y asequible, porque incorpora una serie de características patentadas y una nueva fórmula. Con esta actualización, podrá mostrar zonas de doble marco temporal. No solo podrá mostrar un marco temporal más alto, sino también mostrar ambos, el marco temporal del gráfico MÁS el marco temporal más alto: MOSTRANDO ZONAS ANIDADAS. A todos
199 USD
Big promotion! , prices are now on discount , get your copy now  The   Rubdfx Price Tracker   that is used to show price price bound , the price almost never goes out of the channel and most of the time price will react when it touches the channel limits .It determines the best highest and lowest prices at which you can sell and buy respectively Suitable for scalping & swing trading It Draws arrows that appear after a candle close , The arrows indicate bullish or bearish pressure For bearish an
159 USD
IVISTscalp5
Vadym Zhukovskyi
5 (1)
Te presentamos el indicador iVISTscalp5, que no solo es único sino también efectivo en operaciones de trading. Este indicador se basa en datos temporales y es el resultado de muchos años de experiencia y análisis profundo de los mercados financieros. El indicador iVISTscalp5 es una excelente herramienta para el trading manual. La conveniencia, simplicidad y visualización, toda la complejidad está oculta en su interior. Hemos simplificado al máximo la configuración y uso del indicador iVISTscalp5
500 USD
TPA True Price Action indicator reveals the true price action of the market makers through 100% non-repainting signals strictly at the close of a candle! TPA shows entries and re-entries, every time the bulls are definitely stronger than the bears and vice versa. Not to confuse with red/green candles. The shift of power gets confirmed at the earliest stage and is ONE exit strategy of several. There are available now two free parts of the TPA User Guide for our customers. The first "The Basics"
168 USD
MA Ribbon MT5
Diego Arribas Lopez
Versión MT4 MA Ribbon MT5 MA Ribbon es un indicador mejorado con 8 medias móviles de períodos crecientes. MA Ribbon es útil para reconocer la dirección de la tendencia, posibles  reversiones   y puntos de continuación en el mercado. También indica potenciales puntos de entrada, toma de ganancias parciales y puntos de salida. El precio entrando, saliendo o retesteando el Ribbon y un número definido de cruces de MA pueden indicar posibles puntos de entrada para posiciones largas y cortas.   Ofrece
129 USD
The High Way Channel indicator for MetaTrader is a dynamic forex trading tool that identifies and plots price channels on your chart.  Unlike the regular channel indicator, this indicator (Forex Wave Liberator indicator) comes with two different zones where the price is expected to reverse within the channel. The Green and Orange zones are the first and second potential reversal points respectively. This technical indicator is the best channel indicator; it helps you to identify optimal entry/ex
125 USD
Este es posiblemente el indicador de reconocimiento automático de formación de precios más completo que puede encontrar para la plataforma MetaTrader. Detecta 19 patrones diferentes, toma las proyecciones de Fibonacci tan en serio como usted, muestra la zona de reversión potencial (PRZ) y encuentra niveles adecuados de stop-loss y take-profit. [ Guía de instalación | Guía de actualización | Solución de problemas | FAQ | Todos los productos ] Detecta 19 formaciones de precios armónicos difer
299 USD
XQ Indicator MT5
Marzena Maria Szmit
3.25 (4)
The signal conditions are a combination of three indicators, and XQ Forex Indicators only display  medium and long-term trends . The indicator's efficacy has been improved with the addition of a filter that blocks out false signals. The XQ Forex Indicator can be used on  FX pairs, CFDs, and Cryptocurrencies . There are two type of signals:  Buy or Sell and Big Long or Big Short It is possible to enable sending emails when a major trend-change signal is detected, as well as to display the alerts
179 USD
PZ Trend Trading MT5
PZ TRADING SLU
3.67 (3)
Trend Trading es un indicador diseñado para sacar el máximo provecho posible de las tendencias que tienen lugar en el mercado, mediante el cronometraje de retrocesos y rupturas. Encuentra oportunidades comerciales al analizar qué está haciendo el precio durante las tendencias establecidas. [ Guía de instalación | Guía de actualización | Solución de problemas | FAQ | Todos los productos ] Opere en los mercados financieros con confianza y eficiencia Aproveche las tendencias establecidas sin s
249 USD
The Volume by Price Indicator for MetaTrader 5 features Volume Profile and Market Profile TPO (Time Price Opportunity). Get valuable insights out of currencies, equities and commodities data. Gain an edge trading financial markets. Volume and TPO histogram bar, line and metric charts. TPO letter and block marker charts including split structures. Positioning and styling options to suit the user's needs and context. Volume Profile and Market Profile TPO Point of Control (VPOC and TPOC), Imbalanc
259 USD
Introduction to X3 Chart Pattern Scanner X3 Cherart Pattern Scanner is the non-repainting and non-lagging indicator detecting X3 chart patterns including Harmonic pattern, Elliott Wave pattern, X3 patterns, and Japanese Candlestick patterns. Historical patterns match with signal patterns. Hence, you can readily develop the solid trading strategy in your chart. More importantly, this superb pattern scanner can detect the optimal pattern of its kind. In addition, you can switch on and off individu
250 USD
¿Cansado de trazar líneas de soporte y resistencia? La resistencia de soporte es un indicador de marco de tiempo múltiple que detecta y traza automáticamente los soportes y las líneas de resistencia en el gráfico con un giro muy interesante: a medida que los niveles de precios se prueban con el tiempo y aumenta su importancia, las líneas se vuelven más gruesas y oscuras. [ Guía de instalación | Guía de actualización | Solución de problemas | FAQ | Todos los productos ] Mejora tu análisis técnic
149 USD
"The Squeeze indicator attempts to identify periods of consolidation in a market. In general the market is either in a period of quiet consolidation or vertical price discovery. By identifying these calm periods, we have a better opportunity of getting into trades with the potential for larger moves. Once a market enters into a "squeeze," we watch the overall market momentum to help forecast the market direction and await a release of market energy." The Modified TTM Squeeze Indicator is a modi
149 USD
Gartley Hunter MT5
Siarhei Vashchylka
5 (11)
Gartley Hunter - Indicator for finding harmonic patterns (Gartley patterns) and their projections. The indicator is equipped with an alert system. List of patterns At the moment, the indicator contains patterns:     Alternative bat     Bat     Butterfly     Crab     Cypher     Deep crab     Gartley Indicator control panel The pattern control panel is located in the lower left corner of the screen. See the picture below for a description of the panel. There are Russian and English version
149 USD
Difícil de encontrar y escasa en frecuencia, las divergencias son uno de los escenarios comerciales más confiables. Este indicador busca y escanea las divergencias regulares y ocultas automáticamente usando su oscilador favorito. [ Guía de instalación | Guía de actualización | Solución de problemas | FAQ | Todos los productos ] Fácil de comerciar Encuentra divergencias regulares y ocultas Admite muchos osciladores bien conocidos Implementa señales comerciales basadas en rupturas Muestra n
249 USD
Golden Spikes Detector
Batsirayi L Marango
5 (1)
Golden Spikes Detector This indicator is based on an advanced strategy primarily for trading spikes on Boom and Crash Indices. Complex algorithms were implanted to detect high probability entries only. It alerts on potential Buy and Sell entries. To trade spikes on the Deriv or Binary broker, only take Buy Boom and Sell Cash alerts. It was optimised for 5-minute timeframe. Features ·          Sends push notifications to mobile phone ·          Pop up and sound alerts on computer or laptop ·     
150 USD
Offer 249 down from 350 for the next 1 copies. then back to 350 $ Are you tired of using outdated indicators that leave you guessing where to set your profit targets? Look no further than the AK CAP Opening Range Breakout Indicator. This powerful tool is backed by a US patent and has already helped countless traders pass funded challenges like FTMO. We use it daily on our prop traders and internal funds, and now it's available to you as well. The calculation behind the indicator is incredibly
249 USD
The Classic Pivot Points indicator is fully configurable and can be adjusted to work in different ways. If you are a manual trader and prefer a clean chart, you can configure the indicator so that it only draws pivot points for the current session. Otherwise if you are developing an expert advisor that uses pivot points, you can configure the indicator to show historical pivot points as well. Another unique feature of this indicator is that, when calculating daily pivots, it is possible to set a
125 USD
Bill Williams Advanced
Siarhei Vashchylka
5 (1)
Bill Williams Advanced is designed to analyze the chart according to Bill Williams' Profitunity system. The indicator analyzes the signals of the AO, AC indicators and places them in the panel in the upper left corner of the chart. In addition, using hot keys, the indicator instantly displays / hides the AO and AC indicators (for more details, see the video instructions). Description Each line of the indicator table represents the signals of the Profitunity system that are valid on the last fi
199 USD
Ace Supply Demand Zone Indicator The concept of supply demand relies on the quantity mismatching between buying and selling volumes in the financial market. Supply and demand zone can provide the good entry and exit. A zone is easier to trade than a line. The supply demand zone can provide the detailed trading plan and the risk management. Its ability to predict market direction is high. There are two distinctive points about Ace Supply Demand Zone Indicator. Ace Supply Demand Zone indicator was
100 USD
Otros productos de este autor
FX Power MT5 NG
Daniel Stein
5 (1)
Obtenga su actualización diaria del mercado con detalles y capturas de pantalla a través de nuestro Morning Briefing aquí en mql5 y en Telegram ! FX Power MT5 NG es la nueva generación de nuestro popular medidor de fuerza de divisas, FX Power. ¿Y qué ofrece este medidor de fuerza de nueva generación? Todo lo que le encantaba del FX Power original PLUS Análisis de fuerza de ORO/XAU Resultados de cálculo aún más precisos Períodos de análisis configurables individualmente Límite de cálculo persona
99 USD
Obtenga su actualización diaria del mercado con detalles y capturas de pantalla a través de nuestro Morning Briefing aquí en mql5 y en Telegram ! FX Power MT4 NG es la nueva generación de nuestro popular medidor de fuerza de divisas, FX Power. ¿Y qué ofrece este medidor de fuerza de nueva generación? Todo lo que le encantaba del FX Power original PLUS Análisis de fuerza de ORO/XAU Resultados de cálculo aún más precisos Períodos de análisis configurables individualmente Límite de cálculo persona
99 USD
FX Volume
Daniel Stein
4.59 (34)
Obtenga su actualización diaria del mercado con detalles y capturas de pantalla a través de nuestro Morning Briefing aquí en mql5 y en Telegram ! FX Volume es el PRIMER y ÚNICO indicador de volumen que proporciona una visión REAL del sentimiento del mercado desde el punto de vista de un bróker. Proporciona una visión impresionante de cómo los participantes institucionales del mercado, como los brokers, están posicionados en el mercado Forex, mucho más rápido que los informes COT. Ver esta info
99 USD
FX Trend MT5
Daniel Stein
4.62 (34)
¿Quieres convertirte en un trader de 5 estrellas constantemente rentable? 1. Lee la descripción básica de nuestro sencillo trading sistema y y su mayor actualización de estrategia en 2020 2. Envíe una captura de pantalla de su compra para obtener su invitación personal a nuestro exclusivo chat de trading Tendencia Forex Muestra la dirección de la tendencia, la duración, la intensidad y la calificación de la tendencia resultante para todos los marcos temporales en tiempo real. De un solo vist
66 USD
FX Trend
Daniel Stein
4.84 (94)
¿Quieres convertirte en un trader de 5 estrellas constantemente rentable? 1.   Lee la descripción básica de nuestro sencillo trading sistema   y   y su mayor actualización de estrategia en 2020 2.   Envíe una captura de pantalla de su compra para obtener su invitación personal a nuestro exclusivo chat de trading Tendencia Forex   Muestra la dirección de la tendencia, la duración, la intensidad y la calificación de la tendencia resultante para todos los marcos temporales en tiempo real. De un
66 USD
Lighthouse MT5
Daniel Stein
5 (17)
Quieres convertirte en un trader de 5 estrellas constantemente rentable?  1.  Lee la descripción básica de nuestro sencillo trading  sistema  y su mayor actualización de estrategia en 2020  2.   Envíe una captura de pantalla de su compra para obtener su invitación personal a nuestro exclusivo chat de trading Lighthouse   es un indicador de soporte y resistencia increíblemente preciso y fiable. Muestra los niveles de trading más importantes y los dibuja según su relevancia. Si un nivel se
66 USD
Trade Manager MT5
Daniel Stein
4.33 (3)
¿Quieres convertirte en un trader de 5 estrellas constantemente rentable? 1. Lee la descripción básica de nuestro sencillo sistema de trading y y su gran actualización de estrategia en 2020 2. Envíe una captura de pantalla de su compra para obtener su invitación personal a nuestro exclusivo chat de trading Este Trade Manager es el complemento ideal para todos los FX Trend usuarios que deseen utilizar una gestión de operaciones totalmente automatizada. Detecta sus operaciones abiertas manua
66 USD
Las claves del éxito   en el comercio de Forex son la disciplina, la paciencia y una clara ventaja, como la que tenemos con nuestro exclusivo análisis de volumen de operaciones reales. Esa es nuestra experiencia de 10 años operando en Forex, y todos estos factores clave se resumen en la serie   S tein   I nvestments   E xpert   A dvisor ( SIEA ). SIEA ZEN   proporciona una relación riesgo-recompensa muy equilibrada y sobrevive fácilmente a todas las circunstancias del mercado, incluso a las m
599 USD
SIEA Zen
Daniel Stein
4 (4)
Las claves del éxito en el comercio de Forex son la disciplina, la paciencia y una clara ventaja, como la que tenemos con nuestro exclusivo análisis de volumen de operaciones reales. Esa es nuestra experiencia de 10 años operando en Forex, y todos estos factores clave se resumen en la serie S tein I nvestments E xpert A dvisor ( SIEA ). SIEA ZEN proporciona una relación riesgo-recompensa muy equilibrada y sobrevive fácilmente a todas las circunstancias del mercado, incluso a las más críticas
599 USD
Crosshair es una fantástica herramienta que simplifica nuestro análisis de los gráficos haciendo que las velas de precios estén perfectamente alineadas con los valores de los indicadores en las subventanas. Puede activarse y desactivarse a través de una sola pulsación en la "C" de su teclado, y proporciona un modo de regla para mediciones precisas que puede activarse y desactivarse a través de la tecla "R" de su teclado. Por favor, mire nuestro breve vídeo tutorial incrustado a continuación
66 USD
¿Quieres convertirte en un trader de 5 estrellas constantemente rentable? 1.   Lee la descripción básica de nuestro sencillo sistema de trading   y   y su gran actualización de estrategia en 2020 2.   Envíe una captura de pantalla de su compra para obtener su invitación personal a nuestro exclusivo chat de trading Este Trade Manager es el complemento ideal para todos los   FX Trend   usuarios que deseen utilizar una gestión de operaciones totalmente automatizada. Detecta sus operaciones ab
66 USD
Lighthouse
Daniel Stein
4.85 (93)
Quieres convertirte en un trader de 5 estrellas constantemente rentable?  1.  Lee la descripción básica de nuestro sencillo trading  sistema  y su mayor actualización de estrategia en 2020  2.   Envíe una captura de pantalla de su compra para obtener su invitación personal a nuestro exclusivo chat de trading Lighthouse   es un indicador de soporte y resistencia increíblemente preciso y fiable. Muestra los niveles de trading más importantes y los dibuja según su relevancia. Si un nivel se
66 USD
SI Connect MT5
Daniel Stein
5 (3)
SI Connect es una utilidad que establece la conexión con nuestros servidores para utilizar FX Volume o los sistemas de trading SIEA. Instrucciones técnicas para preparar su terminal para el uso de SI Connect Permita las peticiones web e inserte https://stein.investments a la lista de URLs permitidas en su Opciones de terminal -> Subcategoría Asesores expertos . Sólo necesita una instancia de EA en ejecución por terminal, pero tiene que ejecutarse constantemente en segundo plano para obtener lo
FREE
SI Connect
Daniel Stein
5 (2)
SI Connect es una utilidad que establece la conexión con nuestros servidores para utilizar FX Volume o los sistemas de trading SIEA. Instrucciones técnicas para preparar su terminal para el uso de SI Connect Permita las peticiones web e inserte https://stein.investments a la lista de URLs permitidas en su Opciones de terminal -> Subcategoría Asesores expertos . Sólo necesita una instancia de EA en ejecución por terminal, pero tiene que ejecutarse constantemente en segundo plano para obtener lo
FREE
SIEA Pro MT4
Daniel Stein
3.67 (3)
Obtenga más información, como preguntas frecuentes, informes de backtest y consejos para la configuración correcta de DST/GMT   en nuestro FAQ público de SIEA Envía una captura de pantalla de tu compra, y obtendrás los archivos del set para SIEA ZEN y SIEA MAX . Así que tendrás 3 SIEAs en 1. MT4 no es capaz de ejecutar estrategias multisímbolo en su probador de estrategias. Recomendamos utilizar las   versiones de SIEA MT5   para ejecutar backtest multisímbolos realistas. Las claves
499 USD
SIEA MAX  proporciona una relación equilibrada de riesgo-recompensa y sobrevive fácilmente a todas las circunstancias del mercado, incluso a las más críticas como Corona, Brexit, etc. La paciencia y la disciplina del sistema se ven recompensadas con grandes beneficios para sus usuarios. Por eso lo llamamos MAX. MT4 no es capaz de ejecutar estrategias multisímbolo en su probador de estrategias. Recomendamos utilizar las   versiones de SIEA MT5   para ejecutar backtest multisímbolos realistas.
299 USD
Crosshair
Daniel Stein
Crosshair es una fantástica herramienta que simplifica nuestro análisis de los gráficos haciendo que las velas de precios estén perfectamente alineadas con los valores de los indicadores en las subventanas. Puede activarse y desactivarse a través de una sola pulsación en la "C" de su teclado, y proporciona un modo de regla para mediciones precisas que puede activarse y desactivarse a través de la tecla "R" de su teclado. Por favor, mire nuestro breve vídeo tutorial incrustado a continuación
66 USD
SIEA Max
Daniel Stein
1 (2)
Las claves del éxito en el comercio de Forex son la disciplina, la paciencia y una clara ventaja, como la que tenemos con nuestro exclusivo análisis de volumen de operaciones reales. Esa es nuestra experiencia de 10 años operando en Forex, y todos estos factores clave se resumen en la serie Stein Investments Expert Advisor (SIEA). SIEA MAX proporciona una relación equilibrada de riesgo-recompensa y sobrevive fácilmente a todas las circunstancias del mercado, incluso a las más críticas como Co
299 USD
SIEA Pro
Daniel Stein
4.46 (13)
Obtenga más información, como preguntas frecuentes, informes de backtest y consejos para la configuración correcta de DST/GMT  en nuestro FAQ público de SIEA Envía una captura de pantalla de tu compra, y obtendrás los archivos del set para SIEA ZEN y SIEA MAX. Así que tendrás 3 SIEAs en 1. Las claves del éxito en el comercio de Forex son la disciplina, la paciencia y una clara ventaja, como la que tenemos nosotros con nuestro exclusivo análisis de volumen de operaciones reales. Esa es nues
499 USD
Filtro:
Oliver Henry
585
Oliver Henry 2023.07.24 22:20 
 

Very good indicator and totally unique on the retail forex market. The insight a trader can get from this is a real edge for trading. The support is also very good as are the daily updates that are published on the chat group.

Daniel Stein
119707
Respuesta del desarrollador Daniel Stein 2023.07.24 22:28
Thank you so much for your positive feedback. It's highly appreciated. 🙏
bandelero
354
bandelero 2023.06.16 16:15 
 

I have now closed the second week of trading with FX Power and FX Volume with net gain of 2.7%. I am really pleased how the indicators gives me a quick overview of the market and help me to choose the relevant currency to trade for the day.

Daniel Stein
119707
Respuesta del desarrollador Daniel Stein 2023.06.17 12:54
Thank you so much for your wonderful feedback. 🙏
Khuman Bakhramirad
8827
Khuman Bakhramirad 2023.05.18 13:15 
 

its an amazing indicator, once you combine it with other tools its very good.

Daniel Stein
119707
Respuesta del desarrollador Daniel Stein 2023.05.18 13:23
Thank you so much for your positive feedback. It's highly appreciated. 🙏
Oliver Hesse
1021
Oliver Hesse 2022.09.22 21:26 
 

I am writing this review as an overall review of the FX Trend, FX Power and Lighthouse indicators, as the authors have combined them into the STS strategy as a whole set-up. I will not write the review as text, but will list the advantages and disadvantages. + good way to get the trend of different time frames at a glance (FXT) various visualized SL setting options (FXT) great opportunities to display the currency pair strengths based on freely selectable time periods and therefore also to place good entries (delta crosses/FXP) unique insight into the volume of individual currency pairs (FXV) - none of the Stein tools can be saved as a template in such a way that the panels of the various tools look the same or are in the same place after closing and reopening the template (all FX) Buttons remain objectively on the chart, although the respective indicator has been deleted (LH) if you use these tools on different screen sizes, it can happen that the font of the panel exceeds the frame of the panel (FXT and LH) If the authors decide to no longer provide the data for the volume indicator, all volume-based indicators and EAs by Stein will become unusable, no matter what promises are made on the official site (FXV) In principle, the LH indicator has 3 different display levels. However, these only give the trader a rough indication of where there might be significant SR levels. These levels are broken as often as they are resisted. They give the user a maximum 50/50 rating. Many users, including me, also complain about the inaccuracy of the SR lines. Drawn SR zones would also make more sense than delicate lines. No SR level focuses within a 1 pip line. In addition, it is also disturbing that the lines cross the entire chart and SR lines are visualized that are several hundred pips away from the current price (LH) there is a telegram chat where the functions and the interaction of the tools mentioned can be discussed. This chat is made up of 600 people, never more than the same 10 people posting (with slight fluctuation). In the meantime, the library is so full of images from past conversations that every question from newcomers is answered with: "look at the library". As a new chat member, you have to be prepared to no longer receive personal help, but to browse through tons of image and text material. Unfortunately, the chat rules are also strangely regulated by the author. On the one hand, masses of third-party tools can be found in the library, on the other hand, the author does not want any products linked that do not do justice to the purpose of the group... discussing the Stein Tools. This is strange in many respects, since, as I said, it has happened a thousand times before that foreign tools have been uploaded and, secondly, every new interested party should be absolutely clear that you definitely don't get a setup with the compilation of Stein tools, which one enough to get rich. Unfortunately, this is completely absent in the group. To work out a setup together (from Stein Tools and others) that can ultimately lead to success. The fact is that no money can be made with the STS strategy shown on the blueball side. That's simply not enough that you have to consider as a retailer (fundamentals, MM...) The biggest minus point for me, however, is that I addressed various things regarding object-related errors (template capability) several months ago. Unfortunately, the statement was already a year ago that this is known, but no more changes are made to these tools. All should be redisgned once, but without time limits. So it could be weeks or years. Anyone who would like to know more about what I mean is welcome to contact me personally. Finally, I can say that I have been using all the tools for 3 years and can live with the bugs. What I can't live with is that the authors have known these for several years, but they are not turned off and that the author basically assumes that I'm the only one with these problems.

Daniel Stein
119707
Respuesta del desarrollador Daniel Stein 2022.09.23 09:15
Oh, Oliver, I'm so tired of your childish attitude, but you force me to clarify some things for the public. You bought some tools and NOT us or our company. This means we do NOT have to code anything you think is an improvement. Of course, we take care of bugs if we can reproduce them. Try it yourself by opening a blank new chart and try to reproduce the issue you think of it's a bug. If everything works on this new chart, it's a problem with the setup you created. That's what we explained so often.
And then there are technical limitations of our current product series, which hundreds of other users can easily live with but not you. We know them and designed a new panel technique already available at FX Volume and will be available with the next generation of our other tools. You ignore that there are hundreds of other users besides you. A fundamental redesign of a productive tool is too risky, and that's why every creator, author and software company provides an entirely new version every now and then. So the "old" users are happy, and the new generation users are pleased with the new features. And everyone can switch or use both as they want. I doubt you'll ever understand that, but we honestly don't care. We had endless chats with you, and it's simply hopeless, so please accept that we, as a company, have our own plans for our customers and products. Our chat rules are fair and transparent, and doing marketing for other publishers is simply unacceptable. Besides that, everyone gets the help he needs, but it's clear that we don't have the time to offer individual coaching; hence we have the central Link Library with useful basic information for all users. If there are questions, users can drop them in the group, and other more experienced users or we answer. We're happy to have constantly profitable traders taking their trades solely based on our tools and sharing their knowledge with the crowd. If this isn't enough for you to get rich, we can't help you. Getting rich is a question of attitude and posting your "review" on all 4 product pages makes it even more evident that this is something personal because you don't get your will. Enjoy the audience. We're done with you.
Robert Torres Jr
1541
Robert Torres Jr 2022.06.15 07:07 
 

I am beyond impressed with the pre-purchase support that I have received thus far from Daniel. I've reviewed the telegram groups and I bought the Lighthouse, Powerplay Trade Manager, SIEA Pro, FX Power, FX Trend, and FX Volume (Did I miss any necessary tool?) I am excited to start learning to trade according to this strategy. I'll give more feedback as I start my trading journey with the Stein Investment Group of Traders.

Lester David Saldana Reyes
338
Lester David Saldana Reyes 2021.12.20 16:55 
 

Muy bueno, hace pocas horas lo instalé y está dando buenos resultados, espero siga así. Estaré actualizando la información y datos. La respuesta del creador de este indicador es rápida.

Nick167
49
Nick167 2021.05.22 00:27 
 

I purchased Stein Investments tools for MT5, also FX Volume. And they make a good impression. I learn to use them effectively. I already have a few questions that I will gladly ask after adding me to the forum :) I know for sure that one more application would be useful, which would give signals on the basis of all the others, connecting them together. I mean calculating the most precise inputs and outputs based on FX Power, FX Volume and FX Trend. Perhaps it will be an improved version of Trade Manager? That's a question for Daniel :)

Daniel Stein
119707
Respuesta del desarrollador Daniel Stein 2021.05.24 10:43
Hi Nick, I sent you the invitation to our group chat. In the Link Library of this chat, you'll find a link to the STS dashboard, a tool that summarizes the information of the individual indicators and alerts you based on your individual settings. Best regards, Daniel
Alex East
100
Alex East 2021.02.19 17:58 
 

I have been using FX Volume for around 4-5 months and I can not rate it highly enough. Along, with the rest of Stein's tools they were a real gamechanger for me after years of struggling to find an edge in the market and personally I feel that FX Volume is the most powerful of the lot. Customer service is superb - any issues at all and Daniel is always willing to help. Regular updates - the indicator just keeps on getting better. NB: Like with any indicator, Steins suite of tools are best used in conjuction with technical analysis. If used in this way they are extremely powerful.

Luke Perrett
3278
Luke Perrett 2021.02.09 23:05 
 

Amazing tool. Great insight into the market. Continually updating to get a closer edge. No crap telegram group. Great team behind all of Steins products. Find me a better product than this. Good luck. Keep up the amazing work Stein team, we need you!!

Andre Gomes
2475
Andre Gomes 2021.02.06 20:05 
 

Excellent tool. I cannot thank Daniel and Alain enough for building this amazing tool, which truly gives you and edge to trade forex markets.

CaesarX
304
CaesarX 2021.01.10 09:28 
 

FxVolume has become the most important tool at my disposal, I simply couldn't go without it

Boriwan
641
Boriwan 2020.10.26 20:10 
 

Отличная работа! Спасибо!

Joshua Jeffries
123
Joshua Jeffries 2020.10.22 15:31 
 

I have had this indicator now for the best part of 6 months. I find the insights extremely useful and has saved my skin a few times. Trades i would've normally taken nullified by this indicator. I find it great for swing trading as I can see the volume changing in real time and start to move in the direction i am anticipating. Used in conjunction with the other tools in the box you will find great results. The community is top notch and also run community projects for EA's and Dashboards, the subscription alone is worth that. There are several strategies to use the tools and suits every trader. We have low TF traders in the group M1-M5 and also people like me H1 - D1, and we all seem to be getting great results! For what you get, the price alone is absolutely a steal, it will add so much value to your trading i can't even describe. Since starting my account is up over 500% so yeah, speaks for itself. If you are interested in the closed thing you'll get to an institutional tool on MQL, well, this is it.

The most useful info are

LOTS

Percentage of long trades

Once you see these increasing for one pair, it is almost a sure thing the price is going to follow. The subscription is so cheap you can't not try it. I can't thank Daniel and the guys in the group enough!

Stephan Grobler
147
Stephan Grobler 2020.08.29 12:58 
 

Excellent tool!

Aravind Kolanupaka
8495
Aravind Kolanupaka 2020.06.27 18:59 
 

So many ways to use the data and confirm trades.

RDI
1482
RDI 2020.04.01 22:04 
 

Great Indicator . Thanks Daniel!!

Respuesta al comentario
Versión 4.55 2023.08.30
Fixed bug when symbols alert enabled
Versión 4.53 2023.08.01
Added INSTANCE_ID input parameter

Fixed GOLD bug, shifting all currencies data
Versión 4.52 2023.07.31
Fixed iCustom call, sometimes displaying the panel

Added Gold input parameters, and updated to use last framework changes
Versión 4.50 2023.07.26
Fixed invalid pointer, framework bug when no history lines are displayed

Fixed bug in loading FXV parameters
Versión 4.48 2023.07.24
Fixed minor bugs

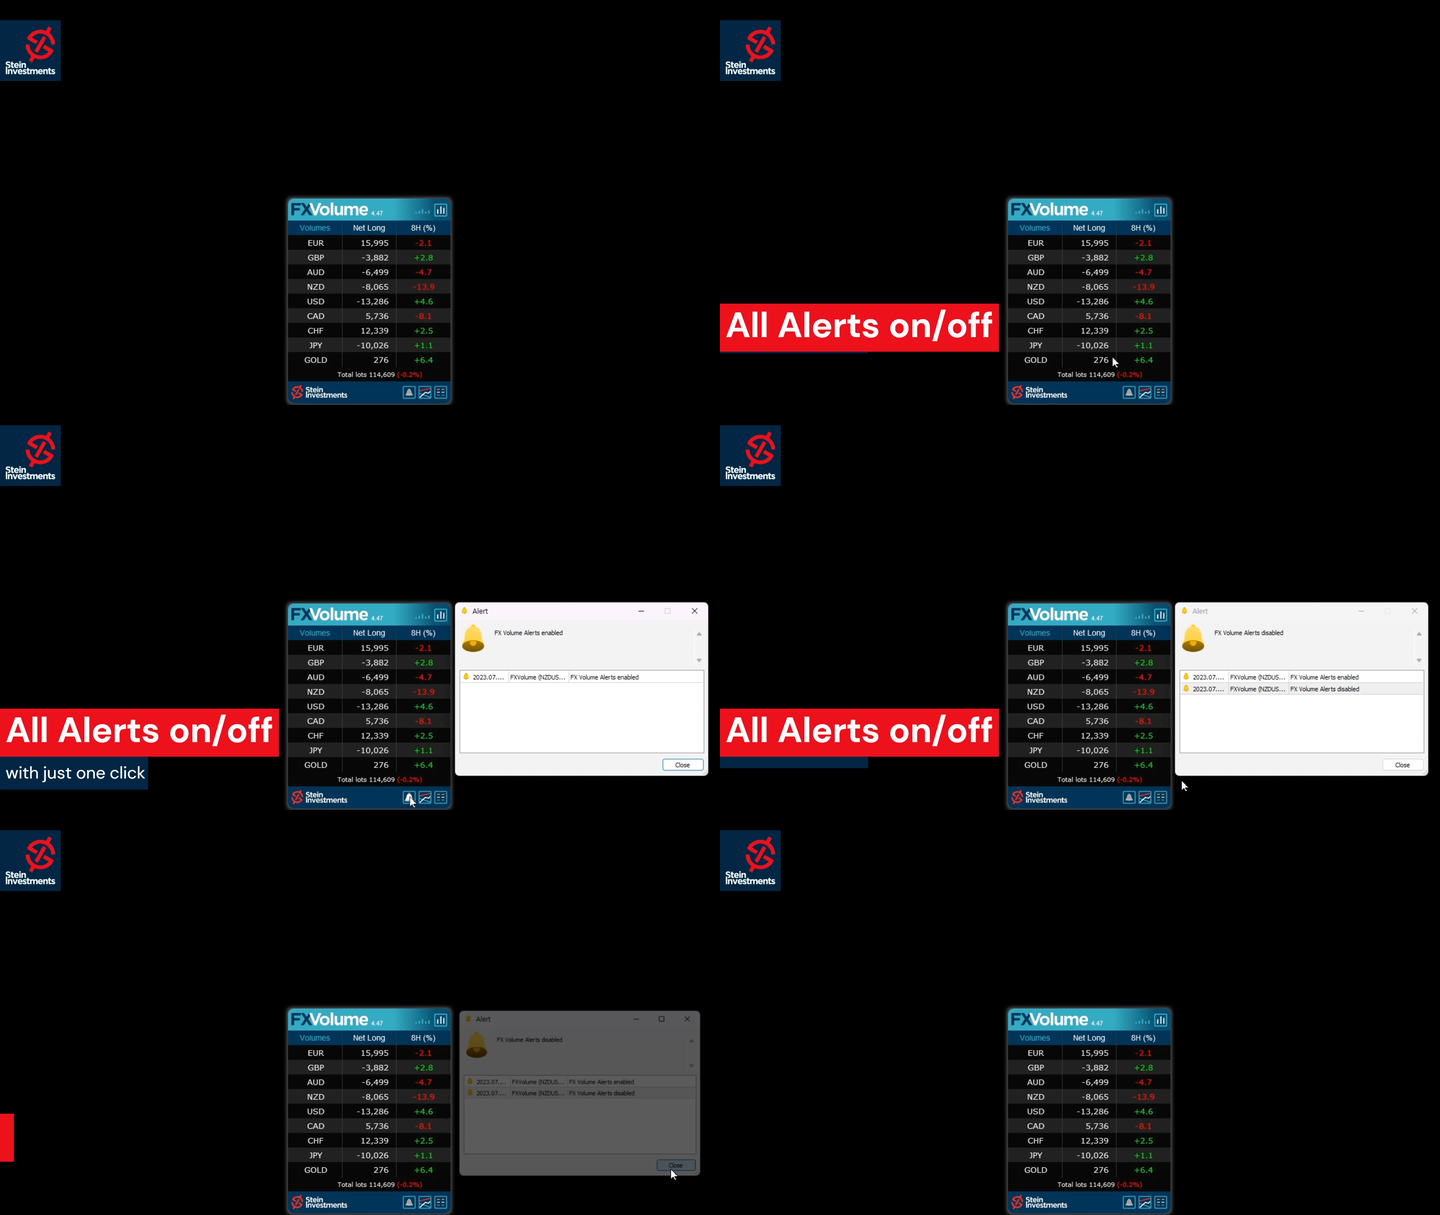
Added an alert button in the panel

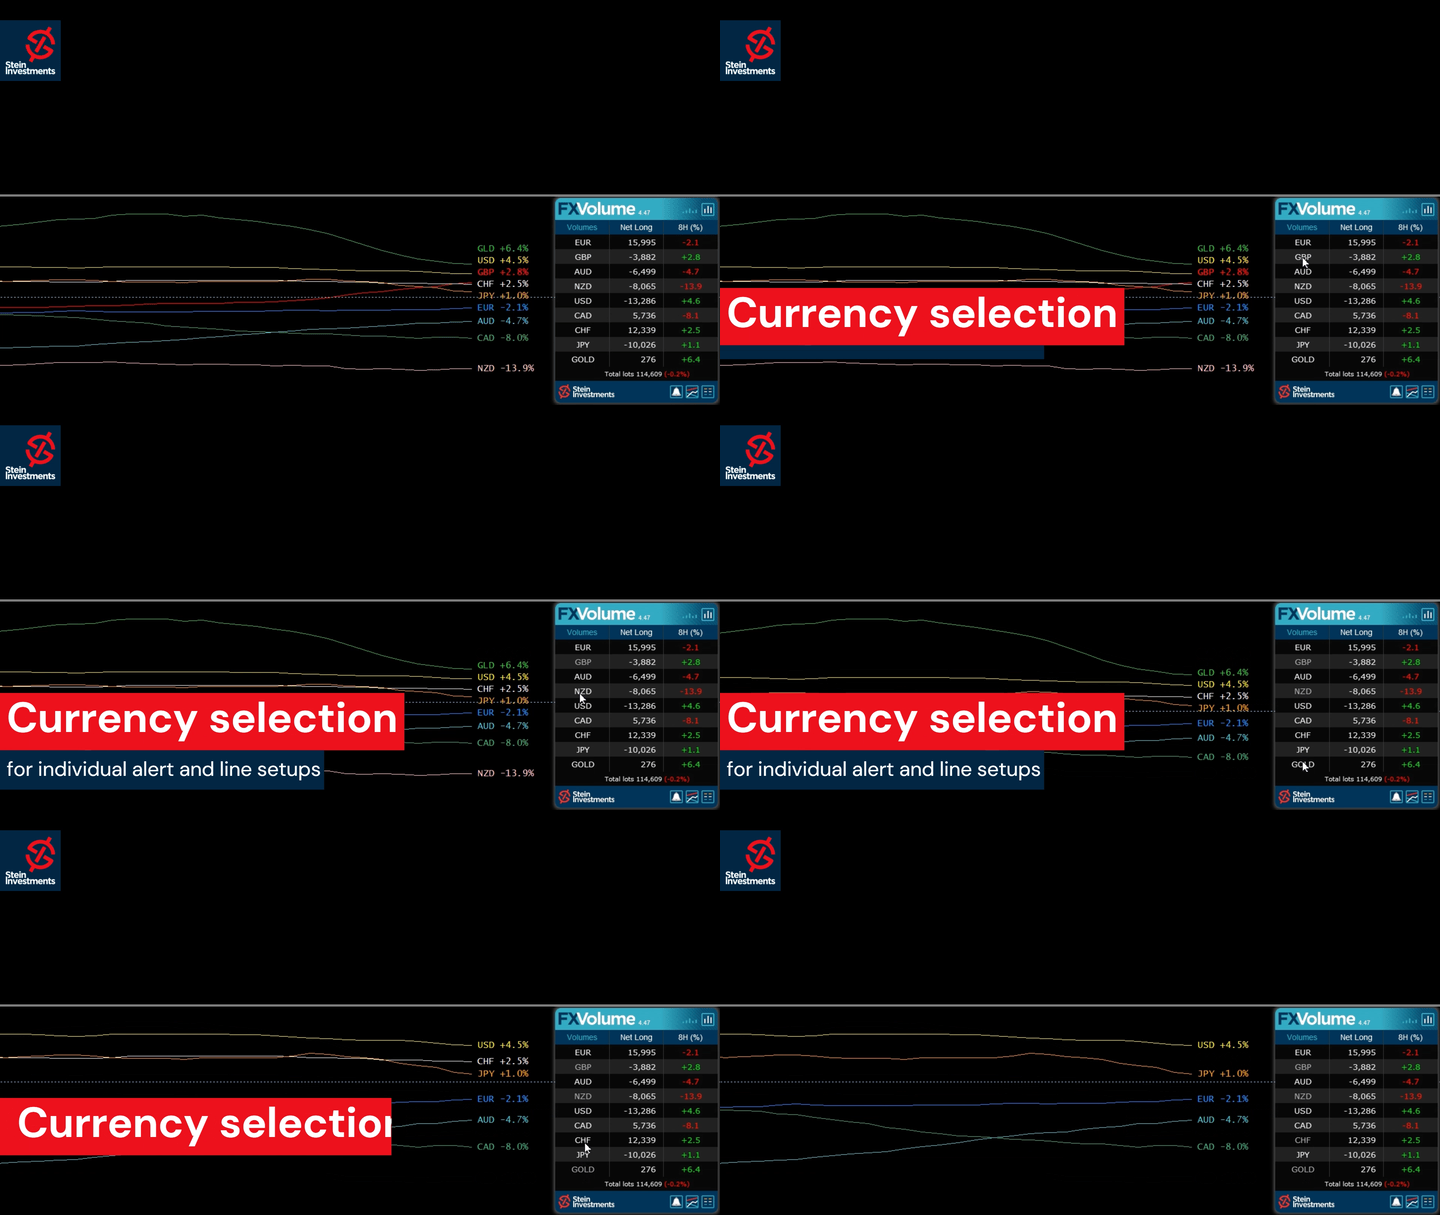
Alerts are now individually configurable according to currencies selected

Update with last framework and generic changes

Changed input parameters (without effect on iCustom requests)

Changed currency sorting in the panel following a logical convention for symbol names
Versión 4.42 2023.06.01
Fixed GUI DPI adjustment bug
Versión 4.41 2023.06.01
⚠️Due to necessary changes in our panel management, you have to reconfigure your charts once after the update⚠️

New Features
Added history mode "Net Long % change"
Added new main panel view "Net long % change"
Added alerts for "Net long % change" drop & rise

Changed indicator label on chart to display one decimal at % values
Changed indicator digits according to history mode
Changed the zoom factor to use % values
Symbols list refactoring as a new panel


Graphics
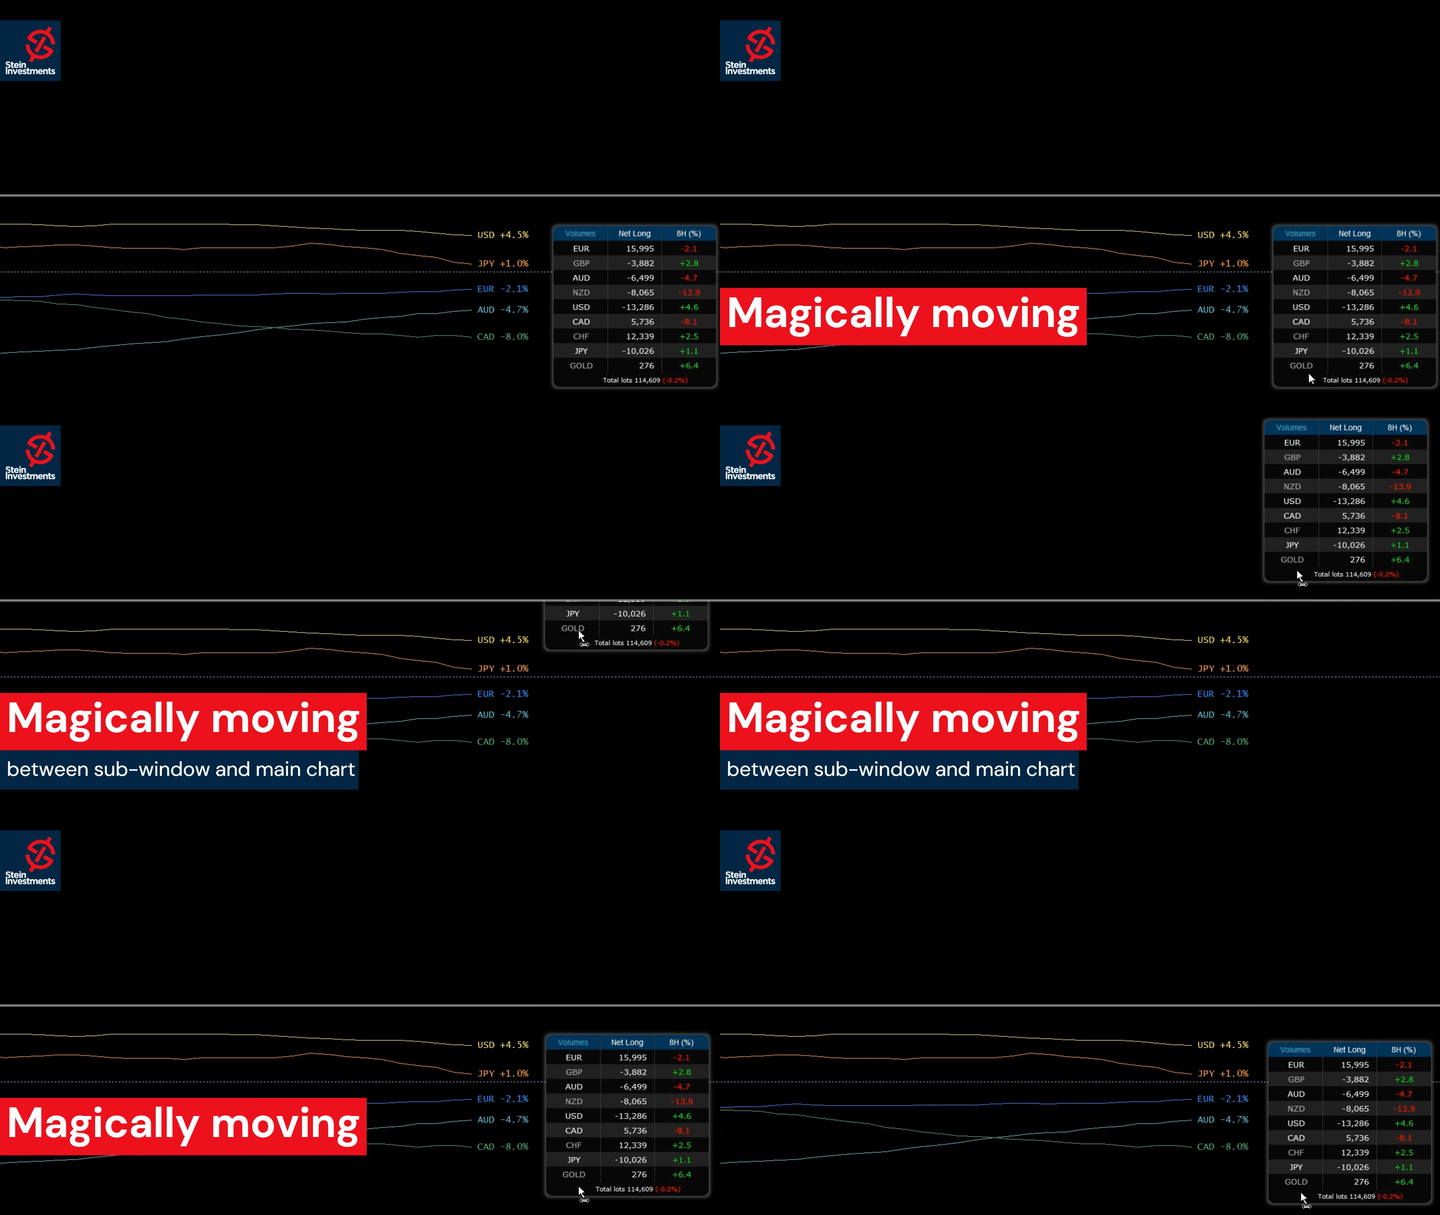
New rounded corner panel design.
Added a different color for the "Past" data column.
Added input for panel back color if the auto-scheme is disabled
Improved plot labels display to avoid overlapping. (MT5 only)


Under the hood
Apply complete internal refactoring
Apply the last framework update
Versión 4.10 2022.03.08
Fixed resource loading issue on some Mac/Linux systems

Fixed graphical panel bug when missing past data
Versión 4.0 2022.03.02
FX Volume 4.0 comes with two additional features.

1. The option to use the internal comparison calculation on a minute basis which allows comparison below our previous minimum of 1 hour.

2. Inspired by our fellow trader Luke, we created a Net Long Volume view including history lines to understand better how the Net Long volume correlates with the market moves we see on the chart.

Check our Stein Investments YouTube channel to see a video of the new features.

We're sure you'll like the new features.
Versión 3.58 2021.09.01
Optimized FX Volume to be fully compatible with MT4/MT5 templates
Versión 3.53 2021.05.08
Transition version to use data in common data folder

Fixed bug with GMT when running FX Volume on a weekend for the first time

Optimizations when used as free demo version in the strategy tester


Versión 3.50 2021.04.08
Fixed minor bug when alerts are enabled
Versión 3.49 2021.04.01
This update contains the following changes:

- New Alert options based on Long and Short Volume
- New Alert filters based on the dominance of one side available,
i.e. if Volume Long is bigger than Volume Short, you'll get only alerts for the Volume Long side
- Improved communication with the new SI Connect 2.x
- Optimized settings managements

and these changes are related to the strategy tester usage

- Fixed current candle update bug
- Added parameter to start with a focus on chart currencies
- Improved backtesting performance
Versión 3.35 2021.03.11
Fixed M1 issue when used in the strategy tester
Versión 3.34 2021.03.10
Fixed row labels in Changes view
Versión 3.33 2021.03.10
Internal refactoring
Changed SI Connect detection method
Improved performance when used in the strategy tester
Versión 3.28 2021.02.26
FX Volume GUI enabled in Strategy Tester visual mode when called via iCustom
Versión 3.27 2021.02.26
Besides various minor fixes and improvements, we made a few specific improvements when using FX Volume inside an EA and in the strategy tester like:

- Improve behaviour when called from iCustom
- Improved data processing (all modes)
- Fix minor display bugs while using the visual mode
- Disabled alerts in tester mode
Versión 3.25 2021.02.22
Optimized SI Connect EA detection in case of heavy usage (more than 20 instances)
Versión 3.24 2021.02.17
Fix symbols list display (top of the list possibly hidden)
Versión 3.23 2021.02.17
With this update, it's finally possible to combine different views AND comparison periods in just one chart.

In this way, you'll easily see if the short term volume is still dynamic and supporting the volume change of a higher period.
This offers an entirely new grade of precision because you now see exactly when to enter when to exit and if it's still worth to hold the position.

We hope you'll enjoy the new flexibility provided by FX Volume.
Versión 3.18 2021.02.10
Fixed bug resulting in orphan objects on the chart

Fixed bug of line style changes when using several instances
Versión 3.17 2021.02.04
This release is another huge step forward and provides the following new features.

- Additional colouration for the positive and negative percentage values

- History lines for Volume Total, Volume Long and Volume short are now available

- All history lines can be hidden completely via parameters in the indicator properties

- Use multiple instances of FX Volume in one chart to create individual comparison views.
Note: Every instance has to use a different "History lines and buffers" mode to manage all instances correctly.

- Volume Total, Volume Long and Volume Short are now available in the indicator buffers

IMPORTANT: Please note that the history lines and the panel information is managed independently!
If you switch to a different panel view, this does NOT change the volume history lines. You have to change them in the indicator properties.

Please note also that the value labels of the history lines differ from the information seen in the panel because the panel displays always the latest available information while the history line buffer provides an OHLC volume data average for the entire candle. Please visit our FX Volume info channel at https://t.me/SI_FX_Volume to get more detailed information
Versión 3.1 2021.02.01
Renamed view labels for a better usability
Versión 3.0 2021.02.01
This major update provides a deeper insight into the real trading market sentiment

Now you can see the total volume of the long and short side separately as well as how it changed during the selected comparison period. With this information, you can easily spot on which side of the market there is an upcoming dynamic in the real trading volume.

And because we are often asked for it we added all this information for GOLD as well.

Enjoy the new amazing features of FX Volume and leave a review if you like it.
Versión 2.26 2020.12.21
Fixed minor bug occurring rarely at a terminal restart
Versión 2.25 2020.12.18
Minor bug fixed causing an empty panel due to unchanged data

Added special section for the alert option in the indicator properties
Versión 2.24 2020.12.16
The following new features have been added:

-Alert on long ratio rise/drop
-Alert on total volume rise/drop
-Alert on delta increase/decrease

We hope you'll enjoy the new alert options.
Versión 2.22 2020.12.02
Disabled DEBUG mode
Versión 2.21 2020.11.23
Fixed empty panel bug
Versión 2.20 2020.09.18
Changed Delta calculation display to provide more accurate results

Added total volume buffer -> ask for the updated code snippets

FX Volume is now ready to be used in the MT4 strategy tester!
Versión 2.16 2020.06.24
The panel uses current and raw data only. OHLC is used only for history lines.

Fixed bug in panel update when data are not directly available.

Added an alert for insufficient Terminal "Max bars" settings.
Versión 2.0 2020.06.20
Dear customers, please welcome our fantastic FX Volume 2.0. We spent weeks of work designing this beautiful panel, adding excellent features, and providing more detailed information to offer you outstanding user experience and a real edge in trading.

To benefit from all improvements it is necessary that you update FX Volume and SI Connect to the latest available version!
Versión 1.26 2020.06.07
Metaquotes provided important fixes in MQL5 and asked us to recompile all our market tools.
So please update your local copy to the latest available to benefit from bug fixes and improvements.
Versión 1.25 2020.05.14
Use updated libraries
Versión 1.24 2020.03.09
Added security to avoid alert flooding

Fixed bug which checks and sends alert continuously if the data file can't be opened