• 概要
  • レビュー (16)
  • コメント (31)
  • 最新情報

FX Volume MT5

4.8

mql5と Telegramのモーニング・ブリーフィングで、詳細とスクリーンショットを含む毎日のマーケット・アップデートをご覧ください!

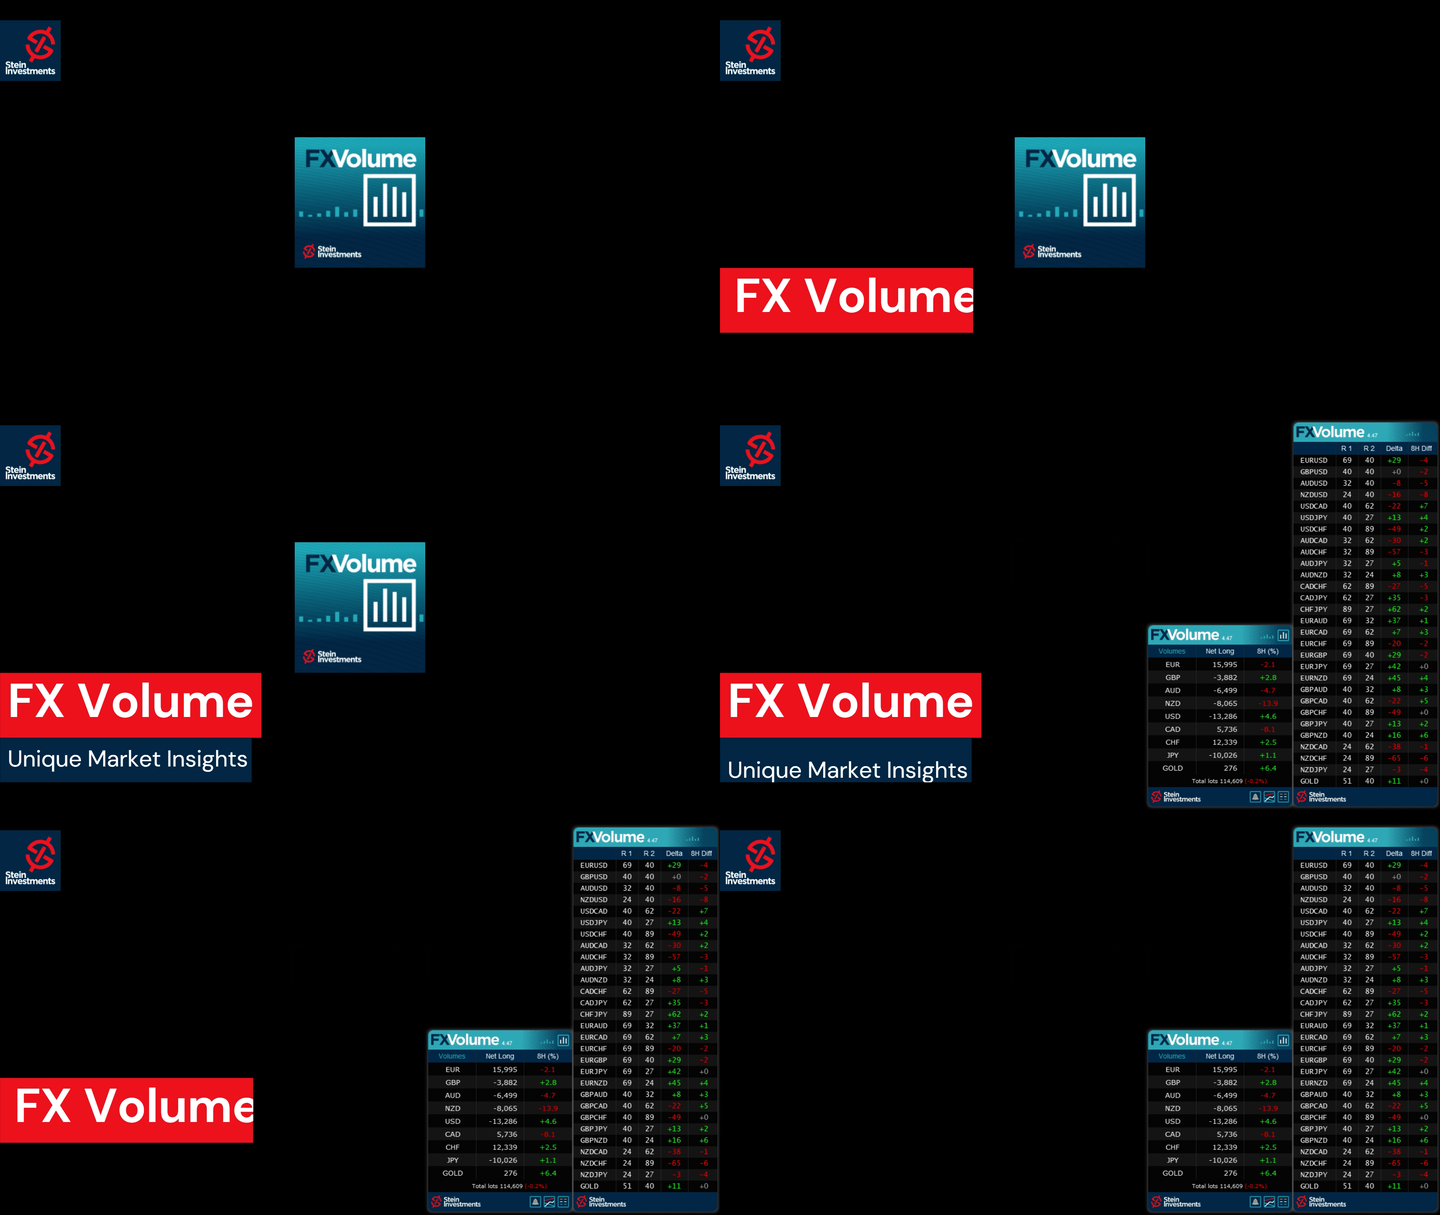
FX Volumeは、ブローカーの視点から市場のセンチメントをリアルに洞察する、最初で唯一の出来高インジケーターです。

ブローカーのような機関投資家が外国為替市場でどのようなポジションをとっているか、COTレポートよりもはるかに速く、素晴らしい洞察を提供します。
この情報をチャート上で直接見ることは、あなたの取引にとって真のゲームチェンジャーであり、画期的なソリューションです。

以下のようなユニークなマーケットデータ洞察から利益を得てください。

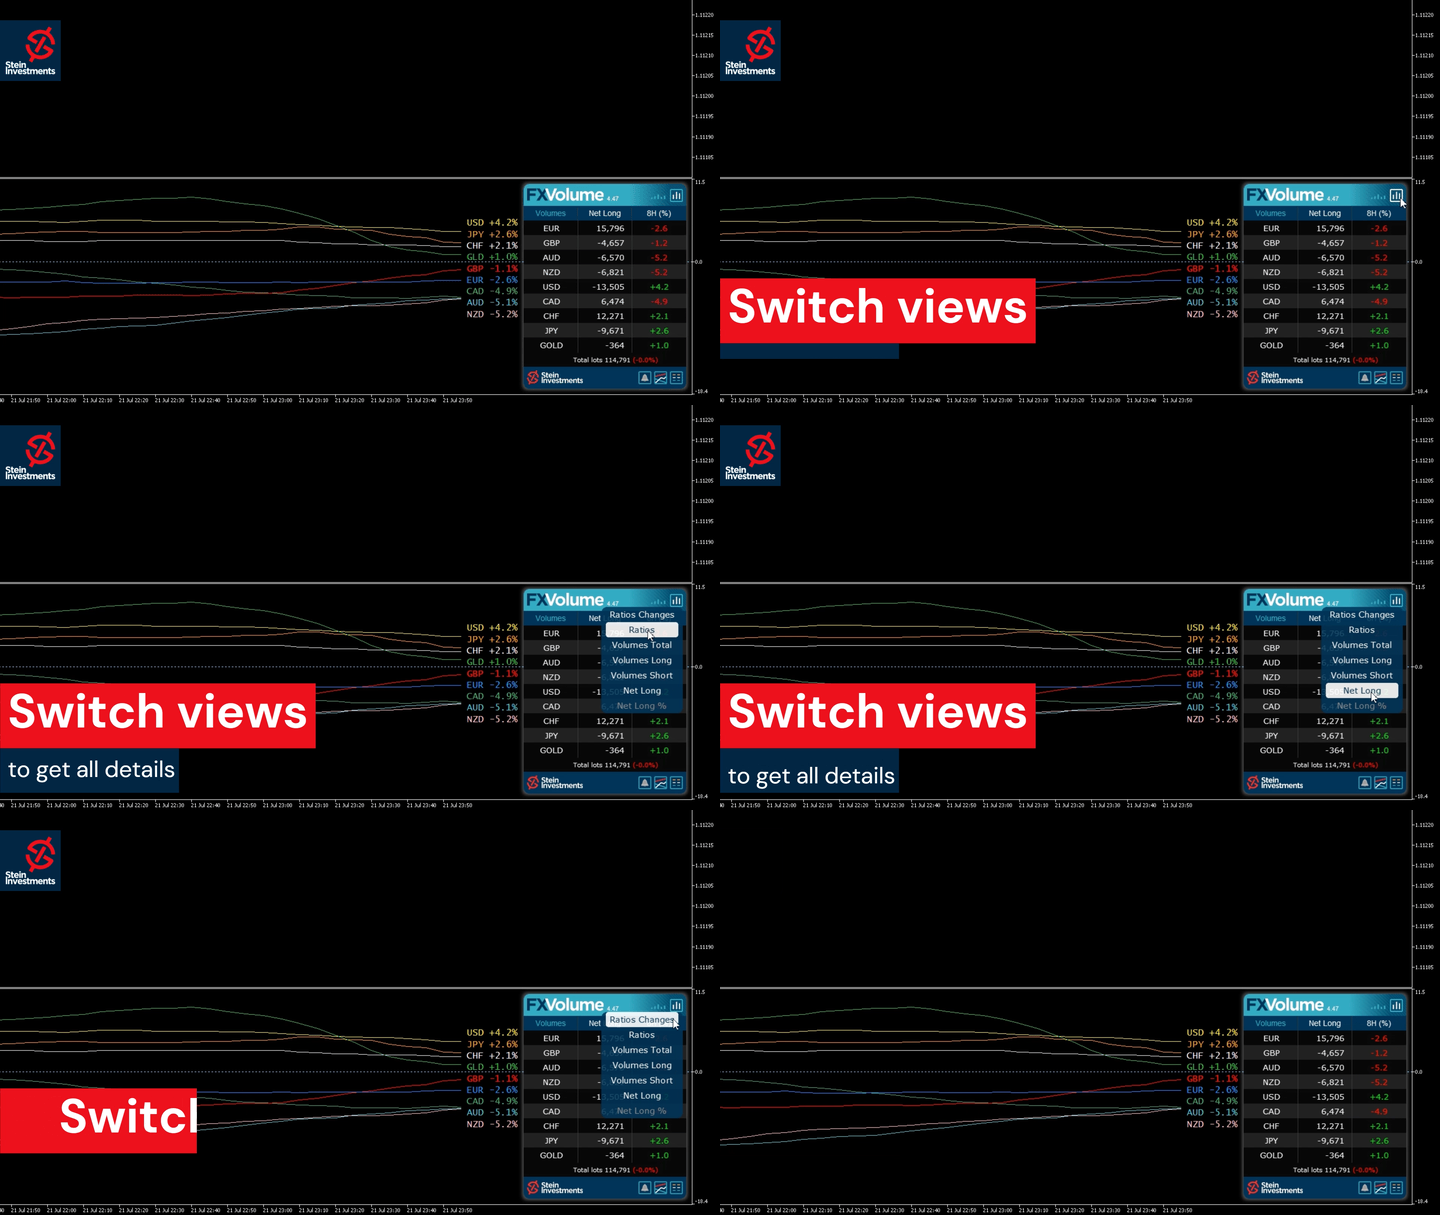
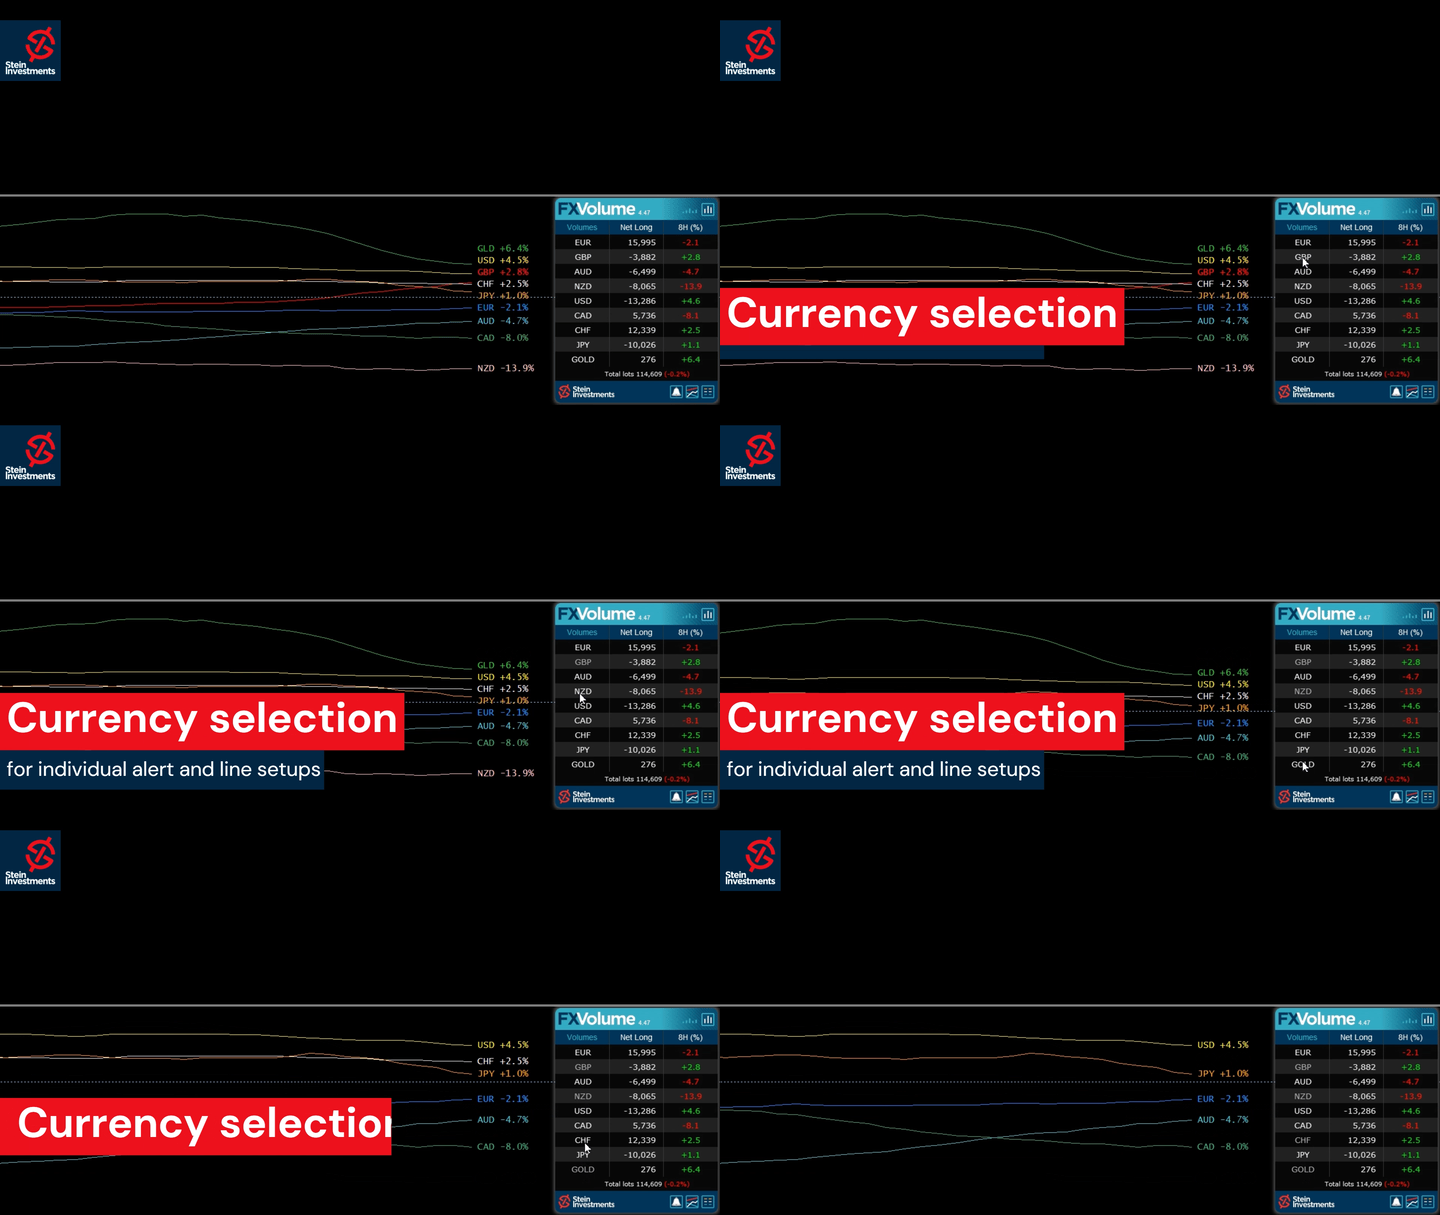
  • 比率は、通貨のロングポジションとショートポジションの比率をパーセントで表示します。
  • 比率の変化は、選択した期間内のロング比率とその変化率を表示します。
  • Volumes Totalは、通貨の取引量(ロングとショート)の合計をロット単位で表示します。
  • Volumes Long:全通貨のロングポジションの取引量を表示します。
  • Volumes(ショート)は、全通貨のショートポジションの取引量を表示します。
  • ネットロングは、ネットのロング取引量、すなわち、すべてのロングポジションからロット単位のすべてのショートポジションを差し引いた取引量を示す。
  • ネット・ロング・パーセントは、通貨のネット・ロング・ボリュームの変化を示す。

基本チュートリアルをお読みください -> "How to trade with FX Volume"

よくある質問、取引のヒント、チュートリアルビデオなどの詳細 情報は、FX Volume情報チャンネルでご覧ください。

弊社データセンターへの常時接続を確立するため、 SI Connect インストールし、実行してください。


背景情報

私たちは皆、FXが分散型市場であることを知っています。そのため、私たちは既成概念にとらわれず、ユニークなソリューションを開発し、この貴重な情報を私たちのチャートに取り込むために、これまでで最も複雑なプロジェクトをコード化する必要がありました。2018年10月以来、私たちのサーバーは、世界中のいくつかの異なるソースからの実際の取引量データフィードを分析し、記録しています。私たちはデータを収集し、取引量がどのように変化するかを分析し、最も重要なFX取引通貨のインデックスを計算しますが、これはほんの始まりに過ぎません。後に、金や原油のような他の取引商品についてもこのような情報を提供する予定です。


Stein Investmentsが提供する実際の取引量データを使うメリットは何ですか?

1.当社のブローカーの視点により、スマートマネーと簡単に取引することができます
2.このようなセンチメント市場データをお客様のチャート上で直接リアルタイムで入手できます
3.当社のリアルタイムで記録された履歴データベースにより、この情報の価値を簡単に確認することができます。

FX Volumeは、このデータをチャートに直接印刷できる唯一のツールです!


なぜレンタルのみ?

前述したように、FX Volumeはバックエンドのインフラストラクチャーと、バックグラウンドのデータベースやチャートに表示されるグラフィカルなフロントエンドのような構築全体を監視し、改善する管理者やコーダーのコストがかかる継続的なサービスです。

そのため、FX Volumeには相応の継続手数料がかかりますが、FX Volumeは簡単に元を取ることができます。
さらに、中・長期のご契約にはお得な割引をご用意しています。


FX Volumeインジケーターの設定

  • ブローカーのDSTゾーンとGMTシフト - 正しい値を取得するには、ググるか、ブローカーのサポートにお問い合わせください。
  • Compare with X hours back - レシオとデルタの比較に1時間ごとの値を設定します。デフォルトは24時間前です。
  • Display all history lines - シンボルに関連する通貨の履歴ラインのみを表示するには、"false" に設定します。
  • Default view - RatioとChangesのどちらかを選択します。
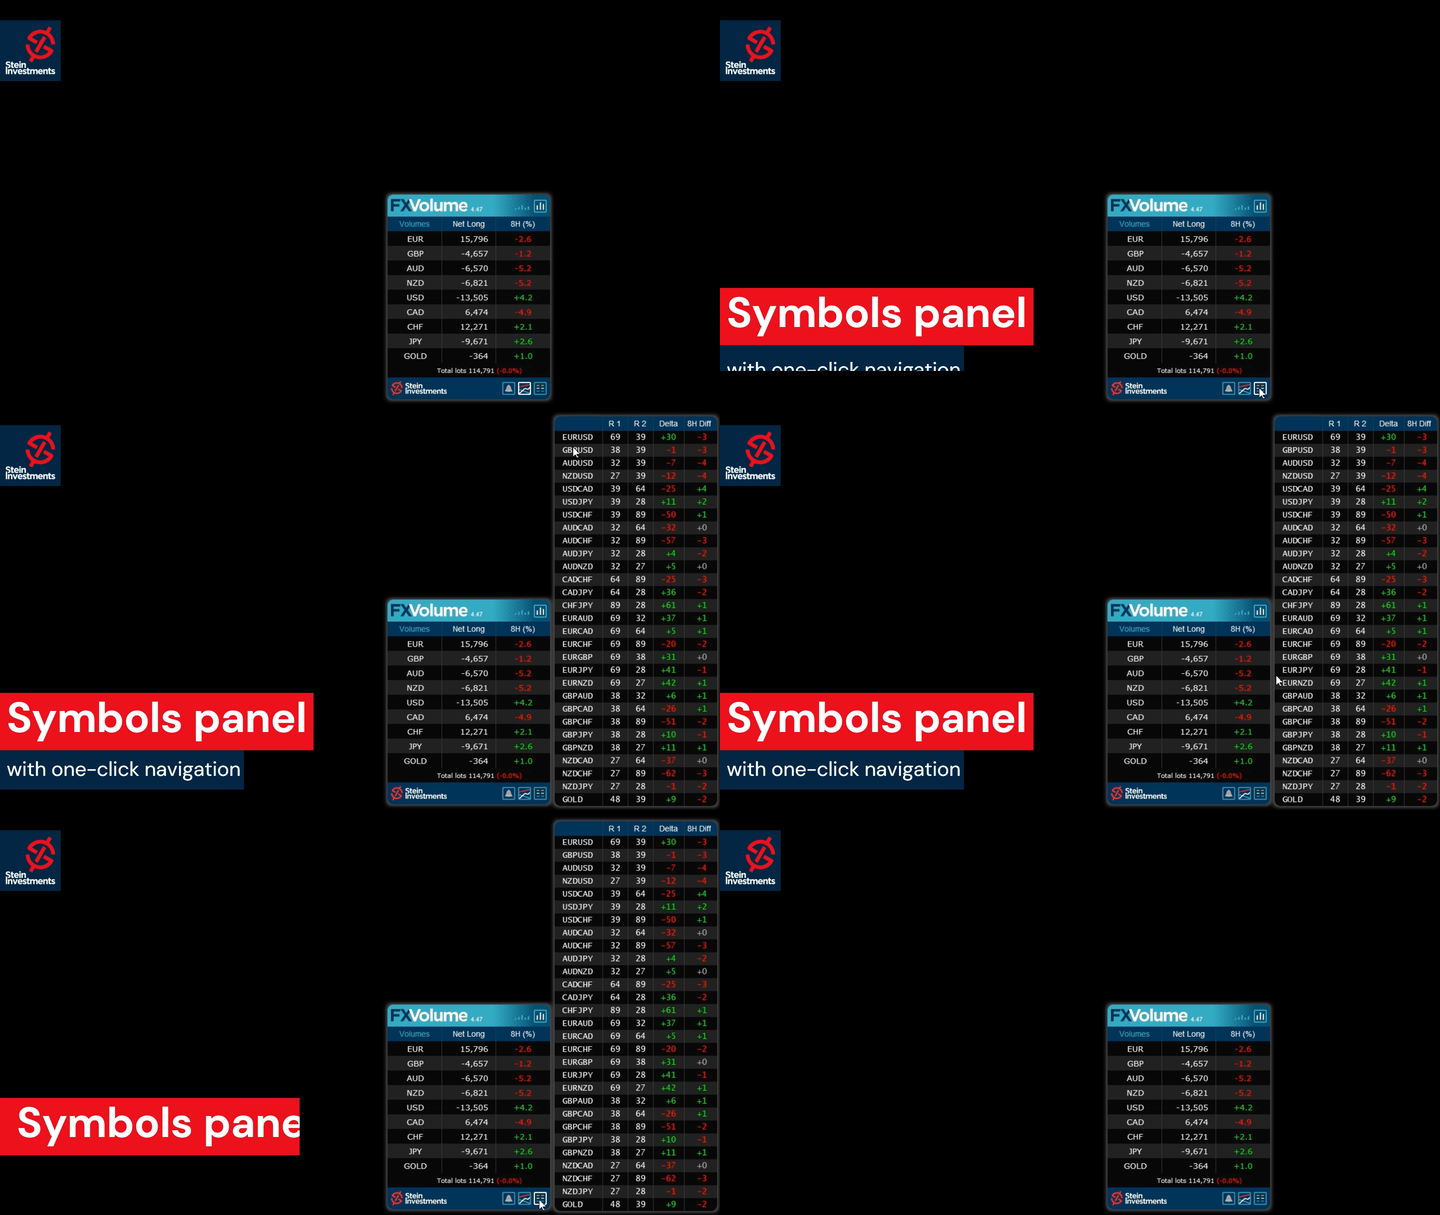
  • シンボルリストの表示 - "false" に設定すると、メインチャートの 28 のシンボルリストが非表示になります。
  • Zoom factor - 全てのグラフ要素のサイズを拡大・縮小する。


常に利益を上げ続ける5つ星FXトレーダーになりたいですか?

Stein Investmentsの取引ツールを入手 し、スクリーンショットをお送りください。


レビュー 16
Oliver Henry
585
Oliver Henry 2023.07.24 22:20 
 

Very good indicator and totally unique on the retail forex market. The insight a trader can get from this is a real edge for trading. The support is also very good as are the daily updates that are published on the chat group.

bandelero
354
bandelero 2023.06.16 16:15 
 

I have now closed the second week of trading with FX Power and FX Volume with net gain of 2.7%. I am really pleased how the indicators gives me a quick overview of the market and help me to choose the relevant currency to trade for the day.

Khuman Bakhramirad
8827
Khuman Bakhramirad 2023.05.18 13:15 
 

its an amazing indicator, once you combine it with other tools its very good.

おすすめのプロダクト
Simple Weis Wave
Jean Jacques Huve Ribeiro
4 (4)
One of the best tools for analyzing volume, Weis Wave was idelized by David Weis, to facilitate the reading of directional flow. For the VSA method disciples it is an evolution of the practices created by Richard Wycoff, facilitating a predictive reading of the market, always seeking an accumulation and distribution of the negotiated contracts. Cumulative wave volume  Range of wave ( removed) Average Wave volume Ref "Tim Ord lectures" ( removed)
FREE
The Volume Weighted ATR indicator is a helpful tool for measuring market activity. It is based on the idea of the Volume-Weighted ATR. Combining these two elements helps identify potential turning points or breakout opportunities. The indicator for the classification of the activity of the market uses the moving average and its multiples. Accordingly, where the VWATR bar is located (relative to the moving average), it is labelled as ultra-low, low, average, high, very high or ultra high. The Vo
FREE
White Weis Volume This indicator shows the sum of the volume in each wave, bulish or bearish, as idealized by David Weis , but it brings an important addition , which is the marking of the bar with the highest volume of the wave (White Bar)! In coding the indicator, it was sought to optimize the code to require minimal processing during use and not to overload mt5. The indicator can be used for pre-trading analysis and study, where the trader analyzes possible points of support and resi
30 USD
A countdown timer for the  Volume bar chart generator  and  Tick chart generator  products, which are available for download from the MQL5 Market: Tick chart generator: https://www.mql5.com/en/market/product/29215 Volume bar chart generator: https://www.mql5.com/en/market/product/47197 The counter conveniently displays the number of ticks or transactions (depending on the chart) that need to pass for a new bar to start printing. The user can set the following indicator inputs. Volume type
FREE
Sweet VWAP MT5
Francisco Gomes Da Silva
4.1 (10)
大手機関が取引している場所を発見し、無料のアンカードVWAPインジケーターで投資を最適化しましょう 当社の 無料アンカードVWAPインジケーター で大手機関が取引している価格を発見しましょう!市場のトップとボトムにアンカーされたVWAPのプロットを自動化することで、貴重な時間を節約できます。無料版では、マウスのポインターの動きに応じてリアルタイムでVWAPを簡単に表示できます。これにより、価格がVWAPに対してどのような位置にあるかを即座に発見して、より良い投資決定を行うことができます。 さらに、当社の有料版には、マウスのクリックでグラフの特定のポイントにアンカーされたVWAPを固定する機能などの追加機能が含まれており、市場のトップとボトムにアンカーされたVWAPをより簡単に配置できます。また、テクニカル分析のprice actionを使用してグラフのトップとボトムを自動的に見つけるための無料のインジケーターもあります。 もう探す必要はありません! マウスのクリックでVWAPをプロットする アンカーVWAPインジケーター を今すぐダウンロードして、あなたの分析をすぐに改善し始めましょう
FREE
Automatic Vwap Midas
Ricardo Almeida Branco
5 (1)
The 3 Automatic Vwap (Midas) Indicator can be used for Price and Volume studyers to map the movement of market drivers. It automatically plots 3 Vwaps, two of which are dynamic and will be updated throughout the day if new highs or new lows emerge. The third Vwap is daily and can help if the trend is up or down. Also, an auxiliary indicator that plots (also dynamic) points of interest with OHLC prices (Open, High and Low of the current day and Close of the previous day) was inserted. Success and
40 USD
VWAP Indicator
LUC JACOBUS A VERHEECKE
4.24 (17)
Volume Weighted Average Price (VWAP) The volume weighted average price (VWAP) is a   trading   benchmark   used by traders that gives the average price a security has traded at throughout the day, based on both volume and price. It is important because it provides traders with insight into both the trend and value of a security. This indicator VWAP V2 is free and is the manual version of the extended Easy VWAP indicator (30 Euro), where the date and time properties are automatically entered. Wit
FREE
Value Chart Candlesticks
Flavio Javier Jarabeck
4.8 (5)
The idea of a Value Chart indicator was presented in the very good book I read back in 2020 , " Dynamic Trading Indicators: Winning with Value Charts and Price Action Profile ", from the authors Mark Helweg and David Stendahl. The idea is simple and the result is pure genius: Present candlestick Price analysis in a detrended way! HOW TO READ THIS INDICATOR Look for Overbought and Oversold levels. Of course, you will need to test the settings a lot to find the "correct" one for your approach.
FREE
MIDAS Super VWAP
Flavio Javier Jarabeck
4.23 (13)
Imagine VWAP, MVWAP and MIDAS in one place... Well, you found it! Now you can track the movement of Big Players in various ways, as they in general pursue the benchmarks related to this measuring, gauging if they had good execution or poor execution on their orders. Traders and analysts use the VWAP to eliminate the noise that occurs throughout the day, so they can measure what prices buyers and sellers are really trading. VWAP gives traders insight into how a stock trades for that day and deter
FREE
VWAP and MVWAP
Flavio Javier Jarabeck
4.17 (6)
Volume Weighted Average Price (VWAP) is a trading benchmark commonly used by Big Players that gives the average price a Symbol has traded throughout the day. It is based on both Volume and price. Additionally we put in this indicator the MVWAP (Moving Volume Weighted Average Price). For those who do not know the usage and the importance od this indicator I recommend a great article about this subject at Investopedia ( https://www.investopedia.com/articles/trading/11/trading-with-vwap-mvwap.asp )
FREE
Weis Waves
Flavio Javier Jarabeck
3.24 (25)
The original author is David Weis, an expert in the Wyckoff Method. The Weis Wave is a modern adaptation of the 1930's Wyckoff Method, another expert in Tape Reading techniques and Chart Analysis. Weis Waves takes market volume and stacks it into waves according to price conditions giving the trader valuable insights about the market conditions. If you want to learn more about this subject you can find tons of videos in YouTube. Just look for "The Wickoff Method", "Weis Wave" and "Volume Spread
FREE
Aggression Volume
Flavio Javier Jarabeck
3.79 (19)
Aggression Volume Indicator is the kind of indicator that is rarely found in the MQL5 community because it is not based on the standard Volume data provided by the Metatrader 5 platform. It requires the scrutiny of all traffic Ticks requested on the platform... That said, Aggression Volume indicator requests all Tick Data from your Broker and processes it to build a very special version of a Volume Indicator, where Buyers and Sellers aggressions are plotted in a form of Histogram. Additionally,
FREE
Cybertrade Keltner Channels - MT5 Created by Chester Keltner, this is a volatility indicator used by technical analysis. It is possible to follow the trend of financial asset prices and generate support and resistance patterns. In addition, envelopes are a way of tracking volatility in order to identify opportunities to buy and sell these assets. It works on periods longer than the period visible on the chart. All values ​​are available in the form of buffers to simplify possible automations.
FREE
Weis Wave Double Side Alert
Eduardo Da Costa Custodio Santos
The Weis Wave Bouble Side Indicator for MT5 is part of the toolkit (Wyckoff Academy Wave Market) The Weis Wave Bouble side Indicator for MT5 was created based on the already established Weis Wave created by David Weis. The Weis Wave Double Side indicator reads the market in waves as R. Wyckoff did in 1900. It helps in the identification of effort x result, cause and effect, and Supply and demand Its differential is that it can be used below the zero axis and has a breakout alert showing Who is s
60 USD
This z-score indicator shows the correct z-score of an asset, as it uses the normalized price data for calculation, which is the only correct way. Z-score is only applicable for normal distributed data, therefore not the actual price is considered, but the normalised returns, which were assumed to follow a normal distribution. Returns are mean reverting and assumed to follow a normal distribution, therefore z-score calculation of returns is more reliable than z-score on price, as price is NOT m
99 USD
This indicator is stand alone version from  MP Pivot Levels  (All in one) containing Demark's Pivots. Calculations:     PP = X / 4     R1 = X / 2 - LOWprev     S1 = X / 2 - HIGHprev Uses: When the pair currency price may change the direction of movement. Possible constraints of support and resistance that creates plateaus for the currency pair prices. Tendency identification by comparing the present prices according to current day's pivot point and also the prior day's pivot points. ___________
FREE
Wave Box Market Frenquency
Jean Jacques Huve Ribeiro
4.75 (4)
Totally linked to the result of a movement and the duration he had. Its height records how many ticks the asset walked during a given movement, its width shows us the duration that movement had. Its configuration must be in line with the Weis Wave Indicator configuration to observe the movement force and can indicate a possible accumulation or distribution of the movement;
FREE
Stackable VWAP
Flavio Javier Jarabeck
3.8 (5)
Volume Weighted Average Price (VWAP) is a trading benchmark commonly used by Big Players that gives the average price a Symbol has traded throughout the day. It is based on both Volume and price. Additionally we put in this indicator the MVWAP (Moving Volume Weighted Average Price). For those who do not know the usage and the importance od this indicator I recommend a great article about this subject at Investopedia ( https://www.investopedia.com/articles/trading/11/trading-with-vwap-mvwap.asp
FREE
MW Volume
Martin Bittencourt
3.75 (4)
The Martinware Volume indicator plots a colored moving average over volume bars. The coloring uses three colors and can be done in different ways choosable by the user and is applied both to the average as to the volume bars. Three types of coloring are possible: None: no coloring is done Increasing or decreasing: changes the color depending on the current value being bigger or lesser than the previous one Volume relative to average: colors vary if the current volume is bigger or lesser then
FREE
This indicator sums up the difference between the sells aggression and the buys aggression that occurred in each Candle, graphically plotting the waves of accumulation of the aggression volumes.   Through these waves an exponential average is calculated that indicates the direction of the business flow. Note: This indicator DOES NOT WORK for Brokers and/or Markets WITHOUT the type of aggression (BUY or SELL).   Be sure to try our Professional version with configurable features and alerts:  Agr
FREE
Waves Sizer
Flavio Javier Jarabeck
3.67 (3)
Wyckoff fans, enjoy! Ideally to be used with the Weis Waves indicator, but it can be easily used alone, the Waves Sizer puts the range (in resulting Price movement) done by the Price on its market swings. You can control how accurate or loose will be the swings. This tool is very helpful for visually know how much the Price has traveled in your Timeframe. This way you can confront this level of effort with the resulting Volume, etc... Weis Waves indicator: https://www.mql5.com/en/market/pro
FREE
Santa Donchian
Marco Aurelio Cestari
4.2 (5)
Santa Donchian Indicator  is an efficient way to detect support, resistence and break outs in any market. The Donchian channel measures the high and the low of a previously defined range.  Typically, a trader would look for a well-defined range and then wait for the price to break out to either one side for a trade entry trigger. Advantages Never repaints, never backpaints, never recalculates. Works in all symbols and all timeframes. Perfect trend filter for any strategy or expert advisor. Fu
FREE
Weis Wave Double Side
Eduardo Da Costa Custodio Santos
The Weis Wave Bouble Side Indicator for MT5 is part of the toolkit (Wyckoff Academy Wave Market) The Weis Wave Bouble side Indicator for MT5 was created based on the already established Weis Wave created by David Weis. The Weis Wave Double Side indicator reads the market in waves as it was done by R. Wyckoff in 1900. It helps in the identification of effort x result, cause and effect, and Supply and demand Its differential is that it can be used below the zero axis, further improving plus operat
30 USD
The Weis Wave first takes the market volume and then organizes it with the price into Wave charts. It is the only software that will present the true picture of the market before you. If anyone of you, has watched an intraday price movement then you must know that it unfolds in a series of selling as well as buying waves-a procedures tearing down and building up. Wave analysis is an integral part of the trading method. The indicator helps to deal with today’s volatile market. Moreover, it works
FREE
Introduction The "Ultimate Retest" Indicator stands as the pinnacle of technical analysis made specially for support/resistance or supply/demand traders. By utilizing advanced mathematical computations, this indicator can swiftly and accurately identify the most powerful support and resistance levels where the big players are putting their huge orders and give traders a chance to enter the on the level retest with impeccable timing, thereby enhancing their decision-making and trading outcomes.
FREE
Volume Weighted Average Price or VWAP is an indicator wich shows different average prices on chart. This is very useful to find strong negotiation price areas and as trend following. Configurations: Day, Week and Month - Show different VWAPs according to the period. You can change each line style on "colors" tab. Any doubt or suggestion please contact us. Enjoy! This is a free indicator, but it took hours to develop. If you want to pay me a coffee, I appreciate a lot   <3 PayPal, Skrill, Ne
FREE
Donchian Pro
Paulo Henrique Faquineli Garcia
5 (1)
The Donchian Channel Channels are among the most popular tools of technical analysis, as they visually convey to the analyst the limits within which most price movement tends to occur. Channel users know that valuable information can be obtained at any time, whether prices are in the central region of a band or close to one of the border lines. One of the best known techniques to explore these concepts is Bollinger Bands. However, John Bollinger was not the only one to research the applicatio
FREE
AvgVolumes
Marco Montemari
5 (1)
This indicator is based on Volumes standard indicator, calculates the average of Volumes based on the last N bars set by users, and if the value of the volume is bigger then a set % respect the average a different color will be used. The indicator is shown in a separate indicator window. This version has now a limitation in setting the % about the threshold. If you are interested to set threshold consider to buy the PRO version ( https://www.mql5.com/en/market/product/35925 ) If you want to use
FREE
この指標は、こちらからダウンロードできるMy candleの完全版のデモ版です: Candle Patterns Creator 完全版では、独自のローソク足ルールを作成したり、従来のローソク足パターンを戦略に合わせてより正確に修正することができます。 この指標にはいくつかのローソク足ルールの例が含まれていますが、ここではいくつかをご紹介します: Pattern Rule Candle Green C > O Candle Red C < O Doji C = O Hammer (C > O and (C-O) *2 < O-L and (C-O) *0.5 > H-C) or (C < O and (O-C) *2 < C-L and (O-C) *0.5 > H-O) Hammer Green C > O and (C-O) *2 < O-L and (C-O) *0.5 > H-C Hammer Red C < O and (O-C) *2 < C-L and (O-C) *0.5 > H-O Marubozu  (C > O and C-O > (H-L) * 0.7 ) or
FREE
Description The indicator uses market profile theory to show the most relevant trading zones, on a daily basis. The zones to be shown are LVN (low volume nodes) and POC (point of control). An LVN zone is one which represents price areas with the least time or volume throughout the day. Typically, these areas indicate a supply or demand initiative, and in the future, they can turn into important breakout or retracement zones. A POC zone is one which represents price areas with the most time or vo
FREE
このプロダクトを購入した人は以下も購入しています
これはMT5のインジケーターで、再描画なしで取引に参入するための正確なシグナルを提供します。 外国為替、暗号通貨、金属、株式、インデックスなど、あらゆる金融資産に適用できます。かなり正確な見積もりを提供し、取引を開始して終了するのに最適な時期を教えてくれます。1つのシグナルを処理しただけでインジケーターの元が取れた例の 動画 (6:22)をご覧ください。Entry PointsPro インジケーターの助けを借りたほとんどのトレーダーの最初の1週間の結果が改善しています。 Telegramグループ に登録してください。Entry Points Proインジケーターのメリットは次の通りです。 再描画のないエントリーシグナル 再描画されるインジケーターでは一度表示されたシグナルが削除されて大きな金銭的損失につながることがありますが、これと異なり、表示されて確認されたシグナルは消えることがありません。 エラーなしの取引開始 インジケーターアルゴリズムによって取引を開始する(資産を売買する)理想的な瞬間を見つけることができます。それを使用するすべてのトレーダーの成功率が向上します。
125 USD
Price action trading, Trend trading strategies, Trend following indicators, Trend detection, Range identification, Smart Trend Trading System Indicator, Comprehensive trading system, Multi-indicator approach, Trend following strategy, Range reversal strategy, Smart Trend Cloud, Smart Reversal Zones, Trend Breakout Catcher, Smart Trailing Stop, Multi-timeframe trend finder, Complete trading toolkit, Market trend analysis, Range-bound market signals, Confident trading decisions, Price movement in
100 USD
Was: $299    Now: $149   Supply Demand uses previous price action to identify potential imbalances between buyers and sellers. The key is to identify the better odds zones, not just the untouched ones. Blahtech Supply Demand indicator delivers functionality previously unavailable on any trading platform. This 4-in-1 indicator not only highlights the higher probability zones using a multi-criteria strength engine, but also combines it with multi-timeframe trend analysis, previously confirmed swi
149 USD
Robos
Namu Makwembo
5 (2)
Big promotion on the Robos, Get yours now Robos Indicator The   ROBOS   indicator is a multi timeframe oscillator that targets the   overbought   and   oversold  regions of a price chart, a signal is indicated by the two lines crossing, compatible with all tradable instruments Latest Release The latest release is the version 4.0 #What's new in version 4.0 ? Features Extreme oversold and overbought levels ROBOS version  4.0  comes with cool new feature , the ability to target on
255 USD
ICT Analysis, SMC Trading Strategies, Smart Money Concepts, Smart Money Insights,   Institutional Perspective,     Banks and Institutions Liquidity,   Liquidity Analysis, Institutional Trading, Market Predictions, Price Movement Analysis,   Trading with Institutions,  Trend Analysis Tool, Price Action Indicator, Market Structure Analysis, Order Block Detection,   Support and Resistance Levels,   BOS and CHoCH Patterns,  Momentum Shift Indicator, Supply and Demand Zones Locator, Strong Imbalance
100 USD
Was: $249    Now: $149   Market Profile defines a number of day types that can help the trader to determine market behaviour. A key feature is the Value Area, representing the range of price action where 70% of trading took place. Understanding the Value Area can give traders valuable insight into market direction and establish the higher odds trade. It is an excellent addition to any system you may be using. Blahtech Limited presents their Market Profile indicator for the MetaTrader community.
149 USD
Support and Resistance, Trading System, Indicator, Candlestick Patterns, VWAP, Trend Catcher, Multi-Timeframe Trend, Support Levels, Resistance Levels, Trading Strategies, Complete Trading System, Technical Analysis, Forex Trading, Price Action, Market Trends, Trading Signals, Trend Identification, Swing Trading, Day Trading, Swing Trading Strategies, Technical Indicators, Trading Tools, Trend Confirmation, Entry and Exit Points, Trading Panel, Forex Signals, Trend Reversals, Trading Algorithms
100 USD
現在33%オフ 初心者にもエキスパートトレーダーにも最適なソリューション このインジケーターは独自の機能と新しい公式を多数内蔵しており、ユニークで高品質かつ手頃な取引ツールです。このアップデートでは、2つの時間枠ゾーンを表示できるようになります。より長いTFだけでなく、チャートTFとより長いTF(ネストゾーンを表示)の両方を表示できます。すべてのSupply Demandトレーダーの皆さんのお気に召すはずです。:) 重要情報の公開 Advanced Supply Demandの可能性を最大化するには、 https://www.mql5.com/ja/blogs/post/720245 にアクセスしてください。   エントリーまたはターゲットの正確なトリガーポイントを正確に特定できれば取引がどのように改善されるか想像してみてください。新しい基盤となるアルゴリズムに基づいて構築されているため、買い手と売り手の間の潜在的な不均衡をさらに簡単に特定できます。これは、最も強い需要と供給のゾーンと、過去のパフォーマンス(古いゾーンを表示)がグラフィカルに表現されるためです。これらの機能は、最適
199 USD
IVISTscalp5
Vadym Zhukovskyi
5 (1)
iVISTscalp5インジケーターをご紹介します。このインジケーターは、トレーディングにおいて独自でありながら効果的です。時間データに基づくこのインジケーターは、多年にわたる経験と金融市場の深い分析の結果です。iVISTscalp5インジケーターは、手動トレーディングにとって優れたツールです。便利さ、簡単さ、可視化 - すべての複雑さが内部に隠されています。私たちは、iVISTscalp5インジケーターの設定と使用を最大限に簡素化しました。このインジケーターは、MT5ターミナルにあるすべての金融商品に適しています。 稼働時間は、4時から20時(UTC+3)です。 iVISTscalp5インジケーターメニュー(スクリーンショット1を参照): History - 引用を計算する週数 dT_min - 時間間隔の選択(分) TFline - 水平ボリュームの作成(時間枠) BARSline - 水平ボリュームの作成(バー数) TFtrend1 - デイリーチャンネルの作成(時間枠) BARStrend1 - デイリーチャンネルの作成(バー数) TFtrend2 - 週次チャンネルの作成(時
500 USD
TPA True Price Action indicator reveals the true price action of the market makers through 100% non-repainting signals strictly at the close of a candle! TPA shows entries and re-entries, every time the bulls are definitely stronger than the bears and vice versa. Not to confuse with red/green candles. The shift of power gets confirmed at the earliest stage and is ONE exit strategy of several. There are available now two free parts of the TPA User Guide for our customers. The first "The Basics"
168 USD
The High Way Channel indicator for MetaTrader is a dynamic forex trading tool that identifies and plots price channels on your chart.  Unlike the regular channel indicator, this indicator (Forex Wave Liberator indicator) comes with two different zones where the price is expected to reverse within the channel. The Green and Orange zones are the first and second potential reversal points respectively. This technical indicator is the best channel indicator; it helps you to identify optimal entry/ex
125 USD
これはほぼ間違いなく、MetaTraderプラットフォームで見つけることができる最も完全な調和価格形成自動認識インジケーターです。 19種類のパターンを検出し、フィボナッチプロジェクションをあなたと同じように真剣に受け止め、潜在的逆転ゾーン(PRZ)を表示し、適切なストップロスとテイクプロフィットレベルを見つけます。 [ インストールガイド | 更新ガイド | トラブルシューティング | よくある質問 | すべての製品 ] 19の異なる調和価格形成を検出します プライマリ、派生および補完フィボナッチ投影(PRZ)をプロットします 過去の価格行動を評価し、過去のすべてのパターンを表示します この指標は、独自の品質とパフォーマンスを分析します 適切なストップロスとテイクプロフィットのレベルを表示します ブレイクアウトを使用して適切な取引を通知します すべてのパターン比をグラフにプロットします 電子メール/音声/視覚アラートを実装します スコット・M・カーニーの本に着想を得て、この指標は最も純粋で急を要するトレーダーのニーズを満たすように設計されています。ただし、トレードを
299 USD
XQ Indicator MT5
Marzena Maria Szmit
3.25 (4)
The signal conditions are a combination of three indicators, and XQ Forex Indicators only display  medium and long-term trends . The indicator's efficacy has been improved with the addition of a filter that blocks out false signals. The XQ Forex Indicator can be used on  FX pairs, CFDs, and Cryptocurrencies . There are two type of signals:  Buy or Sell and Big Long or Big Short It is possible to enable sending emails when a major trend-change signal is detected, as well as to display the alerts
179 USD
The Volume by Price Indicator for MetaTrader 5 features Volume Profile and Market Profile TPO (Time Price Opportunity). Get valuable insights out of currencies, equities and commodities data. Gain an edge trading financial markets. Volume and TPO histogram bar, line and metric charts. TPO letter and block marker charts including split structures. Positioning and styling options to suit the user's needs and context. Volume Profile and Market Profile TPO Point of Control (VPOC and TPOC), Imbalanc
259 USD
Introduction to X3 Chart Pattern Scanner X3 Cherart Pattern Scanner is the non-repainting and non-lagging indicator detecting X3 chart patterns including Harmonic pattern, Elliott Wave pattern, X3 patterns, and Japanese Candlestick patterns. Historical patterns match with signal patterns. Hence, you can readily develop the solid trading strategy in your chart. More importantly, this superb pattern scanner can detect the optimal pattern of its kind. In addition, you can switch on and off individu
250 USD
サポート線と抵抗線のプロットにうんざりしていませんか? サポートレジスタンス は、非常に興味深いひねりを加えてチャート内のサポートとレジスタンスラインを自動検出およびプロットするマルチタイムフレームインジケーターです。価格レベルは時間とともにテストされ、その重要性が高まるにつれて、ラインは太くなり、暗くなります。 [ インストールガイド | 更新ガイド | トラブルシューティング | よくある質問 | すべての製品 ] 一晩でテクニカル分析を強化 チャートを閲覧せずに重要な価格レベルを検出 一目ですべての価格レベルの相対的な強さを認識する すべての取引で最大30時間のプロットラインを節約 インジケーターは、すべての価格レベルの年齢を表示します インジケーターは再描画されていません 過去および現在の価格レベルは近接によって崩壊し、現在の市場行動に合わせて調整されます。動作は、必ずしもピークではない場所に線が引かれます。 価格レベルは、時間とともに拒否されるにつれて、より暗く、より広くなります ノイズを避けるために、重要でない価格レベルは定期的にクリアされます カスタマイズ可能な時間枠の
149 USD
RubdFx Perfect Reversal , The reversal indicator is used to determine areas of support and resistance by Drawing an arrow with a level of supply and demand ( ReversalZones ). - You will catch more swings by reducing the period, and less swings if you increase period - Mobile, computer and email alerts available . it is not pushed by price which means the arrow will stay in one place,suitable for scalping and long term trading  Also Compatible with all forex paris , BUY RULES;  open a buy positio
159 USD
Introduction to Fractal Pattern Scanner Fractal Indicator refers to the technical indicator that makes use of the fractal geometry found in the financial market. Fractal Pattern Scanner is the advanced Fractal Indicator that brings the latest trading technology after the extensive research and development work in the fractal geometry in the financial market. The most important feature in Fractal Pattern Scanner is the ability to measure the turning point probability as well as the trend probabil
185 USD
"The Squeeze indicator attempts to identify periods of consolidation in a market. In general the market is either in a period of quiet consolidation or vertical price discovery. By identifying these calm periods, we have a better opportunity of getting into trades with the potential for larger moves. Once a market enters into a "squeeze," we watch the overall market momentum to help forecast the market direction and await a release of market energy." The Modified TTM Squeeze Indicator is a modi
149 USD
Gartley Hunter - Indicator for finding harmonic patterns (Gartley patterns) and their projections. The indicator is equipped with an alert system. List of patterns At the moment, the indicator contains patterns:     Alternative bat     Bat     Butterfly     Crab     Cypher     Deep crab     Gartley Indicator control panel The pattern control panel is located in the lower left corner of the screen. See the picture below for a description of the panel. There are Russian and English version
149 USD
このインジケーターは、実際の取引に最適なウェーブ自動分析インジケーターです。 バンドの標準化された定義は、もはや異なる人々の波ではなく、人為的な干渉の描画が排除されます。これは、アプローチの厳密な分析において重要な役割を果たします。         現在購入割引!   => Increase the choice of international style mode, (red fall green rise style) インデックスの内容: 1.1。     基本波: まず、価格変動過程で基本変動の変曲点を見つけましたが、もちろん、彼の注文はそれほど強くないので、次の計算の基礎になります。 2.2。     二次帯域 :基本波に基づいて、アルゴリズム分析を通じてより明白な二次帯域が得られ、二次帯域は波解析の基礎を提供します 3.3。     波: より明確な傾向とより明確で直感的な方向性があります。波が続くかどうかを分析するには、二次波帯の形状を調べ、二次波の組成を分析して、その後の予測を取得する必要があります。波。 4.4。     チャネル: チャネル計算で
188 USD
発見が困難で頻度が少ないため、分岐は最も信頼できる取引シナリオの1つです。このインジケーターは、お気に入りのオシレーターを使用して、通常の隠れた分岐点を自動的に見つけてスキャンします。 [ インストールガイド | 更新ガイド | トラブルシューティング | よくある質問 | すべての製品 ] 取引が簡単 通常の隠れた発散を見つけます 多くのよく知られている発振器をサポート ブレイクアウトに基づいて取引シグナルを実装します 適切なストップロスおよび利益レベルを表示します 設定可能なオシレーターパラメーター カスタマイズ可能な色とサイズ バー単位でサイズ別に分岐をフィルタリング パフォーマンス統計を実装します 電子メール/音声/視覚アラートを実装します 幅広い市場の見通しを提供するために、異なるオシレーターを使用して、干渉なしで同じチャートにインジケーターを何度もロードできます。このインジケーターは、次のオシレーターをサポートしています。 RSI CCI MACD オスマ 確率的 勢い 素晴らしい発振器 加速器発振器 ウィリアムズパーセントレンジ 相対活力指数 特に外国為替市
249 USD
Golden Spikes Detector This indicator is based on an advanced strategy primarily for trading spikes on Boom and Crash Indices. Complex algorithms were implanted to detect high probability entries only. It alerts on potential Buy and Sell entries. To trade spikes on the Deriv or Binary broker, only take Buy Boom and Sell Cash alerts. It was optimised for 5-minute timeframe. Features ·          Sends push notifications to mobile phone ·          Pop up and sound alerts on computer or laptop ·     
150 USD
Offer 249 down from 350 for the next 1 copies. then back to 350 $ Are you tired of using outdated indicators that leave you guessing where to set your profit targets? Look no further than the AK CAP Opening Range Breakout Indicator. This powerful tool is backed by a US patent and has already helped countless traders pass funded challenges like FTMO. We use it daily on our prop traders and internal funds, and now it's available to you as well. The calculation behind the indicator is incredibly
249 USD
The Classic Pivot Points indicator is fully configurable and can be adjusted to work in different ways. If you are a manual trader and prefer a clean chart, you can configure the indicator so that it only draws pivot points for the current session. Otherwise if you are developing an expert advisor that uses pivot points, you can configure the indicator to show historical pivot points as well. Another unique feature of this indicator is that, when calculating daily pivots, it is possible to set a
125 USD
KT Renko Patterns scans the Renko chart brick by brick to find some famous chart patterns that are frequently used by traders across the various financial markets. Compared to the time-based charts, patterns based trading is easier and more evident on Renko charts due to their uncluttered appearance. KT Renko Patterns features multiple Renko patterns, and many of these patterns are extensively explained in the book titled Profitable Trading with Renko Charts by Prashant Shah. A 100% automate
145 USD
Bill Williams Advanced is designed to analyze the chart according to Bill Williams' Profitunity system. The indicator analyzes the signals of the AO, AC indicators and places them in the panel in the upper left corner of the chart. In addition, using hot keys, the indicator instantly displays / hides the AO and AC indicators (for more details, see the video instructions). Description Each line of the indicator table represents the signals of the Profitunity system that are valid on the last fi
199 USD
Ace Supply Demand Zone Indicator The concept of supply demand relies on the quantity mismatching between buying and selling volumes in the financial market. Supply and demand zone can provide the good entry and exit. A zone is easier to trade than a line. The supply demand zone can provide the detailed trading plan and the risk management. Its ability to predict market direction is high. There are two distinctive points about Ace Supply Demand Zone Indicator. Ace Supply Demand Zone indicator was
100 USD
The Price Action Finder Multi indicator is a multi-currency and multi-timeframe indicator. It searches for patterns of the Price Action system on all standard time frames at once and on a large (up to 60) number of instruments (currencies, stocks, metals, etc.). The resulting patterns are placed by the indicator in a table at the bottom of the screen. Patterns: At the moment, the indicator contains the following patterns: Outside bar , Inside bar , Pin bar , Force bar , PPR , as well as the In
149 USD
Introduction to Fibonacci Volatility Indicator Volatility indicator can help you to detect any statistical advantage for your trading. Especially, if you are trading with Price Action and Price Patterns, then we recommend to use the Volatility indicator together with your strategy. Especically, Fibonacci Volatility indicator combines the market volatiltiy with Fibonacci Analysis to provide you more advanced volatiltiy indicator. Main Features Fibonacci Volatility in Z score Configuration Mode Fi
100 USD
作者のその他のプロダクト
mql5と Telegramの モーニング・ブリーフィングで、詳細とスクリーンショットを含む毎日のマーケット・アップデートをご覧 ください! FX Power MT5 NGは 、長年の人気を誇る通貨強度計FX Powerの次世代モデルです。 この次世代ストレングスメーターは何を提供するのでしょうか?初代FXパワーの魅力すべて プラス GOLD/XAUの強さ分析 より正確な計算結果 個別に設定可能な分析期間 カスタマイズ可能な計算上限値により、さらに優れたパフォーマンスを実現 もっと見たい人のための特別なマルチインスタンス設定 すべてのチャートでお好みの色を無限に設定可能 数え切れないほどの通知オプションにより、重要なことを見逃すことはありません。 Windows 11とmacOSのスタイルで角を丸くした新しいデザイン 魔法のように動くインジケーターパネル FXパワーの主な機能 すべての主要通貨の強さの完全な履歴 すべての時間枠における通貨の強さの履歴 すべてのブローカーとチャートで同一の計算結果 100%信頼できるリアルタイム計算 -> リペイントなし ドロップダウン・リストから
99 USD
mql5と Telegramの モーニング・ブリーフィングで、詳細とスクリーンショットを含む毎日のマーケット・アップデートをご覧 ください! FX Power MT4 NGは 、長年の人気を誇る通貨強度計FX Powerの次世代モデルです。 この次世代ストレングスメーターは何を提供するのでしょうか?初代FXパワーの魅力すべて プラス GOLD/XAUの強さ分析 より正確な計算結果 個別に設定可能な分析期間 カスタマイズ可能な計算上限値により、さらに優れたパフォーマンスを実現 もっと見たい人のための特別なマルチインスタンス設定 すべてのチャートでお好みの色を無限に設定可能 数え切れないほどの通知オプションにより、重要なことを見逃すことはありません。 Windows 11とmacOSのスタイルで角を丸くした新しいデザイン 魔法のように動くインジケーターパネル FXパワーの主な機能 すべての主要通貨の強さの完全な履歴 すべての時間枠における通貨の強さの履歴 すべてのブローカーとチャートで同一の計算結果 100%信頼できるリアルタイム計算 -> リペイントなし ドロップダウン・リストから
99 USD
FX Volume
Daniel Stein
4.59 (34)
mql5と Telegramの モーニング・ブリーフィングで、詳細とスクリーンショットを含む毎日のマーケット・アップデートをご覧 ください! FX Volumeは、ブローカーの視点から市場のセンチメントをリアルに洞察する、最初で唯一の出来高インジケーターです。 ブローカーのような機関投資家が外国為替市場でどのようなポジションをとっているか、COTレポートよりもはるかに速く、素晴らしい洞察を提供します。 この情報をチャート上で直接見ることは、あなたの取引にとって真のゲームチェンジャーであり、画期的なソリューションです。 以下のようなユニークなマーケットデータ洞察から利益を得てください。 比率は 、通貨のロングポジションとショートポジションの比率をパーセントで表示します。 比率の変化は 、選択した期間内のロング比率とその変化率を表示します。 Volumes Totalは 、通貨の取引量(ロングとショート)の合計をロット単位で表示します。 Volumes Long :全通貨のロングポジションの取引量を表示します。 Volumes(ショート )は、全通貨のショートポジションの取引量を表示
99 USD
FX Trend MT5
Daniel Stein
4.62 (34)
常に利益を出し続ける5つ星FXトレーダーになりたいですか? 購入時のスクリーンショットを送信して、専用トレーディングチャットへの個人的な招待を受ける FXトレンド は、すべての時間枠のトレンド方向、期間、強度、その結果のトレンド評価をリアルタイムで表示します。 トレンドがどの方向に動いているか、どのくらい続いているか、どのくらい強力かが一目瞭然です。 これらにより初心者、上級者およびプロのトレーダーにとって使いやすいトレンド取引システムとなって います 。 分析機能 全時間軸のリアルタイムトレンド分析 すべてのタイムフレームで同一の計算結果 時間枠を個別に設定することが可能 トレンドの計算パラメータをカスタマイズ可能 グラフィック機能 コンパクトモード、詳細モード、ダッシュボードモードをワンクリックで切り替え可能 コンパクトモードでは、基本的なトレンド情報を縮小パネルで表示します。 詳細モードでは、基礎となるシンボルの詳細なトレンド分析が可能です。 ダッシュボードモードは、すべてのメジャー銘柄やお気に入りの取引銘柄をカバーします。 パネル内でワンクリックするだけで、すべて
66 USD
常に利益を出し続ける5つ星FXトレーダーになりたいですか? 1. 私たちのシンプルな取引   システムの   基本的な説明と   2020年の主要な戦略の更新を   読む 2.   購入時のスクリーンショットを送信して、私たちの独占取引チャットへの個人的な招待状を取得 します。 Lighthouse   は、驚くほど精密で信頼性の高いサポート&レジスタンス指標です。 最も重要な取引レベルを表示し、その関連性に応じて描画します。 レベルが明らかに破られると、その役割と色を 変えます。 サポートがレジスタンスになり、その逆も然りです。 主な機能 基調となる時間枠に自動調整 重要な支持線と抵抗線のみを表示 レベルが明らかにブレイクした場合、グラフィカルに即座に反応 薄く描かれたSRレベルより、厚く描かれたSRレベルの方が重要である 一般設定 分析モード:   3つの異なるスキャンモード(日中、中、高時間枠)から選択するか、デフォルトで設定されている自動調整を使用します。 自動モードは、基本となるチャートの時間枠に基づいて、使用する分析モードを調整します。 センシティブモー
66 USD
常に利益を上げる5つ星FXトレーダーになりたいですか? 1. シンプルな取引 システムと 2020年のメジャーストラテジーアップデートの 基本説明を読む 2. 購入時のスクリーンショットを送信して、専用取引チャットへの個人的な招待を受ける このトレードマネージャーは 、 全自動取引管理を使用したいすべての FXトレンド ユーザーにとって理想的な追加機能です。 手動で開いた取引を直ちに検出し、FXトレンドのトレンドラインに沿って自動的にストップを管理 します。 お客様のトレードは、トレードマネージャーのプロパティで設定された固定計算設定に基づいて管理されています。 適切なEAマジックナンバーを設定することで、これらのEA注文をあなたの個人的なトレンド取引スタイルに従って管理することができます。 有効な注文の自動検出 イニシャルストップの自動設定 トレーリングストップの自動化 Expert Advisorsの注文の自動検出 アクティブなExpert Advisor注文の自動管理 カウンタートレンドのトレードのためのセキュリティ・ストップロス ブレークイーブン・ストップロ
66 USD
FX Trend
Daniel Stein
4.84 (94)
常に利益を出し続ける5つ星FXトレーダーになりたいですか? 購入時のスクリーンショットを送信して、専用トレーディングチャットへの個人的な招待を受ける FXトレンド は、すべての時間枠のトレンド方向、期間、強度、その結果のトレンド評価をリアルタイムで表示します。 トレンドがどの方向に動いているか、どのくらい続いているか、どのくらい強力かが一目瞭然です。 これらにより初心者、上級者およびプロのトレーダーにとって使いやすいトレンド取引システムとなって います 。 分析機能 全時間軸のリアルタイムトレンド分析 すべてのタイムフレームで同一の計算結果 時間枠を個別に設定することが可能 トレンドの計算パラメータをカスタマイズ可能 グラフィック機能 コンパクトモード、詳細モード、ダッシュボードモードをワンクリックで切り替え可能 コンパクトモードでは、基本的なトレンド情報を縮小パネルで表示します。 詳細モードでは、基礎となるシンボルの詳細なトレンド分析が可能です。 ダッシュボードモードは、すべてのメジャー銘柄やお気に入りの取引銘柄をカバーします。 パネル内でワンクリックするだけで、すべて
66 USD
FX取引で成功するための鍵は、規律、忍耐力、そして私たちが独自に開発したリアルな取引量分析のような明確なエッジです。 これは私たちの10年間のFX取引の経験であり、これらの重要な要素はすべてStein Investments Expert Advisor(SIEA)シリーズにまとめられています。 SIEA ZEN は、非常にバランスのとれたリスク・リターン比を提供し、すべての市場の状況を容易に生き抜くことができます-コロナ、ブレグジットなどの最も重大なものでさえも。 このシステムの堅牢性は、素晴らしいパフォーマンスに加えて、ユーザーにとってより重要な「安心感」をもたらします。それが、私たちが「ZEN」と呼ぶ理由です。 MT4では、ストラテジーテスターでマルチシンボルのストラテジーを実行することができません。現実的なリアルティックのマルチシンボルのバックテストを実行するには、 SIEA MT5 バージョンの使用をお勧めします。 FAQ(よくある質問)、バックテストレポート、正しいDST/GMT設定のためのヒントなどの詳細情報は、 SIEA FAQ をご覧ください。
599 USD
SIEA Zen
Daniel Stein
4 (4)
FX取引で成功するための鍵は、規律、忍耐力、そして私たちが独自に開発したリアルな取引量分析のような明確なエッジです。 これは私たちの10年間のFX取引の経験であり、これらの重要な要素はすべてStein Investments Expert Advisor(SIEA)シリーズにまとめられています。 SIEA ZENは、非常にバランスのとれたリスク・リターン比を提供し、すべての市場の状況を容易に生き抜くことができます-コロナ、ブレグジットなどの最も重大なものでさえも。 このシステムの堅牢性は、素晴らしいパフォーマンスに加えて、ユーザーにとってより重要な「安心感」をもたらします。それが、私たちが「ZEN」と呼ぶ理由です。 FAQ(よくある質問)、バックテストレポート、正しいサマータイム設定のためのヒントなど、より詳しい情報は SIEA FAQ をご覧ください。 トレーディングスタイル SIEA ZENは、USD、CAD、EUR、CHF、GBP、AUD、NZD、JPYの8つの主要通貨をベースとした28の取引ペアすべてを取引します。 当社独自の出来高分析により、市場の不均衡とそ
599 USD
Get your daily market update with details and screenshots via our Morning Briefing  here on mql5  and  on Telegram ! Do you want to become a constantly profitable 5-star forex trader? Then  get our Stein Investments trading tools  and send us a screenshot to get your personal invitation to our exclusive trading chat with 500+ members. Crosshair is a fantastic tool that simplifies our chart analysis by bringing the price candles perfectly in line with the indicator values in the subwindows.
66 USD
常に利益を上げる5つ星FXトレーダーになりたいですか? 1. シンプルな取引   システムと   2020年のメジャーストラテジーアップデートの   基本説明を読む 2.   購入時のスクリーンショットを送信して、専用取引チャットへの個人的な招待を受ける このトレードマネージャーは 、 全自動取引管理を使用したいすべての FXトレンド ユーザーにとって理想的な追加機能です。 手動で開いた取引を直ちに検出し、FXトレンドのトレンドラインに沿って自動的にストップを管理 します。 お客様のトレードは、トレードマネージャーのプロパティで設定された固定計算設定に基づいて管理されています。 適切なEAマジックナンバーを設定することで、これらのEA注文をあなたの個人的なトレンド取引スタイルに従って管理することができます。 有効な注文の自動検出 イニシャルストップの自動設定 トレーリングストップの自動化 Expert Advisorsの注文の自動検出 アクティブなExpert Advisor注文の自動管理 カウンタートレンドのトレードのためのセキュリティ・ストップロス ブレークイーブ
66 USD
Lighthouse
Daniel Stein
4.85 (93)
常に利益を出し続ける5つ星FXトレーダーになりたいですか? 1. 私たちのシンプルな取引   システムの   基本的な説明と   2020年の主要な戦略の更新を   読む 2.   購入時のスクリーンショットを送信して、私たちの独占取引チャットへの個人的な招待状を取得 します。 Lighthouse   は、驚くほど精密で信頼性の高いサポート&レジスタンス指標です。 最も重要な取引レベルを表示し、その関連性に応じて描画します。 レベルが明らかに破られると、その役割と色を 変えます。 サポートがレジスタンスになり、その逆も然りです。 主な機能 基調となる時間枠に自動調整 重要な支持線と抵抗線のみを表示 レベルが明らかにブレイクした場合、グラフィカルに即座に反応 薄く描かれたSRレベルより、厚く描かれたSRレベルの方が重要である 一般設定 分析モード:   3つの異なるスキャンモード(日中、中、高時間枠)から選択するか、デフォルトで設定されている自動調整を使用します。 自動モードは、基本となるチャートの時間枠に基づいて、使用する分析モードを調整します。 センシティブモード
66 USD
SI Connectは、FX VolumeやSIEAの取引システムを利用するために、当社のサーバーへの接続を確立するユーティリティです。 SI Connectを使用するために端末を準備する技術的な手順 Web リクエストを許可し、[ Terminal Options ] -> [Subcategory Expert Advisors ] で許可された URL のリストに https://stein.investments を挿入してください。 ターミナルごとに1つのEAインスタンスを実行する必要がありますが、当社のデータセンターから最新のデータを取得するため、バックグラウンドで常に実行する必要があります。 ご質問がある場合は、プライベートメッセージを送信してください。
FREE
SIEA Pro MT4
Daniel Stein
3.67 (3)
FAQ(よくある質問)、バックテストレポート、正しいDST/GMT設定のためのヒントなどの詳細情報は、 SIEA FAQ をご覧ください。 ご購入のスクリーンショットをお送りいただくと、「 SIEA ZEN 」と「 SIEA MAX 」のセットファイルをお届けします。これで3つのSIEAが1つになりました。 MT4では、ストラテジーテスターでマルチシンボルのストラテジーを実行することができません。現実的なリアルティックのマルチシンボルのバックテストを実行するには、 SIEA MT5 バージョンの使用をお勧めします。 FX取引で成功するためには、規律、忍耐力、そして私たちが独自に開発したリアル・トレーディング・ボリューム・アナリシスのような明確なエッジが必要です。 これは、私たちの10年にわたるFX取引の経験であり、これらの重要な要素はすべて、スタイン・インベストメント・エキスパート・アドバイザー(SIEA)シリーズにまとめられています。 SIEA PRO は、バランスのとれたリスク・リターンを提供し、あらゆる市場の状況を容易に生き抜くことができます-コロナ、Bre
499 USD
FX取引で成功するための鍵は、規律、忍耐力、そして私たちが独自に開発したリアルな取引量分析のような明確なエッジです。 これは私たちの10年間のFX取引の経験であり、これらの重要な要素はすべてStein Investments Expert Advisor(SIEA)シリーズにまとめられています。 SIEA MAX は、バランスのとれたリスク・リターンを提供し、あらゆる市場の状況を容易に生き延びることができます-コロナ、Brexitなどの最も重大な状況でさえも。 このシステムの忍耐力と規律は、ユーザーに大きな利益で報われます。それが、私たちが「MAX」と呼ぶ理由です。 MT4では、ストラテジーテスターでマルチシンボルのストラテジーを実行することができません。現実的なリアルティックのマルチシンボルのバックテストを実行するには、 SIEA MT5 バージョンの使用をお勧めします。 FAQ(よくある質問)、バックテストレポート、正しいDST/GMT設定のためのヒントなどの詳細情報は、 SIEA FAQ をご覧ください。 トレーディングスタイル SIEA MAX は、U
299 USD
Get your daily market update with details and screenshots via our Morning Briefing  here on mql5  and  on Telegram ! Do you want to become a constantly profitable 5-star forex trader? Then  get our Stein Investments trading tools  and send us a screenshot to get your personal invitation to our exclusive trading chat with 500+ members. Crosshair is a fantastic tool that simplifies our chart analysis by bringing the price candles perfectly in line with the indicator values in the subwindows. Yo
66 USD
SIEA Max
Daniel Stein
1 (2)
FX取引で成功するための鍵は、規律、忍耐力、そして私たちが独自に開発したリアルな取引量分析のような明確なエッジです。 これは私たちの10年間のFX取引の経験であり、これらの重要な要素はすべてStein Investments Expert Advisor(SIEA)シリーズにまとめられています。 SIEA MAXは、バランスのとれたリスク・リターンを提供し、あらゆる市場の状況を容易に生き延びることができます-コロナ、Brexitなどの最も重大な状況でさえも。 このシステムの忍耐力と規律は、ユーザーに大きな利益で報われます。それが、私たちが「MAX」と呼ぶ理由です。 FAQ(よくある質問)、バックテストレポート、正しいDST/GMT設定のためのヒントなどの詳細情報は、 SIEA FAQ をご覧ください。 トレーディングスタイル SIEA MAXは、USD、CAD、EUR、CHF、GBP、AUD、NZD、JPYの8つの主要通貨をベースに、28の取引ペアすべてを取引します。 当社独自のリアルトレードボリューム分析により、市場の不均衡とその度合いを判断し、逆張りの機会を見つけ
299 USD
SIEA Pro
Daniel Stein
4.46 (13)
FAQ(よくある質問)、バックテストレポート、正しいサマータイム設定のためのヒントなどの詳細情報は、 SIEA FAQをご覧ください 。 ご購入のスクリーンショットをお送りいただくと、「SIEA ZEN」と「SIEA MAX」のセットファイルをお届けします。これで3つのSIEAが1つになりました。 FX取引で成功するためには、規律、忍耐力、そして私たちが独自に開発したリアル・トレーディング・ボリューム・アナリシスのような明確なエッジが必要です。 これは、私たちの10年にわたるFX取引の経験であり、これらの重要な要素はすべて、スタイン・インベストメント・エキスパート・アドバイザー(SIEA)シリーズにまとめられています。 SIEA PRO は、バランスのとれたリスク・リターンを提供し、あらゆる市場の状況を容易に生き抜くことができます-コロナ、Brexitなどの最も重要なものでさえも。 SIEA ZENやSIEA MAXのように運用することもできますし、プロのトレーダーのように自由に設定して自分の口座に完全に合わせることもできます。これがPROと名付けた理由です。 トレ
499 USD
フィルタ:
Oliver Henry
585
Oliver Henry 2023.07.24 22:20 
 

Very good indicator and totally unique on the retail forex market. The insight a trader can get from this is a real edge for trading. The support is also very good as are the daily updates that are published on the chat group.

Daniel Stein
119693
開発者からの返信 Daniel Stein 2023.07.24 22:28
Thank you so much for your positive feedback. It's highly appreciated. 🙏
bandelero
354
bandelero 2023.06.16 16:15 
 

I have now closed the second week of trading with FX Power and FX Volume with net gain of 2.7%. I am really pleased how the indicators gives me a quick overview of the market and help me to choose the relevant currency to trade for the day.

Daniel Stein
119693
開発者からの返信 Daniel Stein 2023.06.17 12:54
Thank you so much for your wonderful feedback. 🙏
Khuman Bakhramirad
8827
Khuman Bakhramirad 2023.05.18 13:15 
 

its an amazing indicator, once you combine it with other tools its very good.

Daniel Stein
119693
開発者からの返信 Daniel Stein 2023.05.18 13:23
Thank you so much for your positive feedback. It's highly appreciated. 🙏
Oliver Hesse
1021
Oliver Hesse 2022.09.22 21:26 
 

I am writing this review as an overall review of the FX Trend, FX Power and Lighthouse indicators, as the authors have combined them into the STS strategy as a whole set-up. I will not write the review as text, but will list the advantages and disadvantages. + good way to get the trend of different time frames at a glance (FXT) various visualized SL setting options (FXT) great opportunities to display the currency pair strengths based on freely selectable time periods and therefore also to place good entries (delta crosses/FXP) unique insight into the volume of individual currency pairs (FXV) - none of the Stein tools can be saved as a template in such a way that the panels of the various tools look the same or are in the same place after closing and reopening the template (all FX) Buttons remain objectively on the chart, although the respective indicator has been deleted (LH) if you use these tools on different screen sizes, it can happen that the font of the panel exceeds the frame of the panel (FXT and LH) If the authors decide to no longer provide the data for the volume indicator, all volume-based indicators and EAs by Stein will become unusable, no matter what promises are made on the official site (FXV) In principle, the LH indicator has 3 different display levels. However, these only give the trader a rough indication of where there might be significant SR levels. These levels are broken as often as they are resisted. They give the user a maximum 50/50 rating. Many users, including me, also complain about the inaccuracy of the SR lines. Drawn SR zones would also make more sense than delicate lines. No SR level focuses within a 1 pip line. In addition, it is also disturbing that the lines cross the entire chart and SR lines are visualized that are several hundred pips away from the current price (LH) there is a telegram chat where the functions and the interaction of the tools mentioned can be discussed. This chat is made up of 600 people, never more than the same 10 people posting (with slight fluctuation). In the meantime, the library is so full of images from past conversations that every question from newcomers is answered with: "look at the library". As a new chat member, you have to be prepared to no longer receive personal help, but to browse through tons of image and text material. Unfortunately, the chat rules are also strangely regulated by the author. On the one hand, masses of third-party tools can be found in the library, on the other hand, the author does not want any products linked that do not do justice to the purpose of the group... discussing the Stein Tools. This is strange in many respects, since, as I said, it has happened a thousand times before that foreign tools have been uploaded and, secondly, every new interested party should be absolutely clear that you definitely don't get a setup with the compilation of Stein tools, which one enough to get rich. Unfortunately, this is completely absent in the group. To work out a setup together (from Stein Tools and others) that can ultimately lead to success. The fact is that no money can be made with the STS strategy shown on the blueball side. That's simply not enough that you have to consider as a retailer (fundamentals, MM...) The biggest minus point for me, however, is that I addressed various things regarding object-related errors (template capability) several months ago. Unfortunately, the statement was already a year ago that this is known, but no more changes are made to these tools. All should be redisgned once, but without time limits. So it could be weeks or years. Anyone who would like to know more about what I mean is welcome to contact me personally. Finally, I can say that I have been using all the tools for 3 years and can live with the bugs. What I can't live with is that the authors have known these for several years, but they are not turned off and that the author basically assumes that I'm the only one with these problems.

Daniel Stein
119693
開発者からの返信 Daniel Stein 2022.09.23 09:15
Oh, Oliver, I'm so tired of your childish attitude, but you force me to clarify some things for the public. You bought some tools and NOT us or our company. This means we do NOT have to code anything you think is an improvement. Of course, we take care of bugs if we can reproduce them. Try it yourself by opening a blank new chart and try to reproduce the issue you think of it's a bug. If everything works on this new chart, it's a problem with the setup you created. That's what we explained so often.
And then there are technical limitations of our current product series, which hundreds of other users can easily live with but not you. We know them and designed a new panel technique already available at FX Volume and will be available with the next generation of our other tools. You ignore that there are hundreds of other users besides you. A fundamental redesign of a productive tool is too risky, and that's why every creator, author and software company provides an entirely new version every now and then. So the "old" users are happy, and the new generation users are pleased with the new features. And everyone can switch or use both as they want. I doubt you'll ever understand that, but we honestly don't care. We had endless chats with you, and it's simply hopeless, so please accept that we, as a company, have our own plans for our customers and products. Our chat rules are fair and transparent, and doing marketing for other publishers is simply unacceptable. Besides that, everyone gets the help he needs, but it's clear that we don't have the time to offer individual coaching; hence we have the central Link Library with useful basic information for all users. If there are questions, users can drop them in the group, and other more experienced users or we answer. We're happy to have constantly profitable traders taking their trades solely based on our tools and sharing their knowledge with the crowd. If this isn't enough for you to get rich, we can't help you. Getting rich is a question of attitude and posting your "review" on all 4 product pages makes it even more evident that this is something personal because you don't get your will. Enjoy the audience. We're done with you.
Robert Torres Jr
1541
Robert Torres Jr 2022.06.15 07:07 
 

I am beyond impressed with the pre-purchase support that I have received thus far from Daniel. I've reviewed the telegram groups and I bought the Lighthouse, Powerplay Trade Manager, SIEA Pro, FX Power, FX Trend, and FX Volume (Did I miss any necessary tool?) I am excited to start learning to trade according to this strategy. I'll give more feedback as I start my trading journey with the Stein Investment Group of Traders.

Lester David Saldana Reyes
338
Lester David Saldana Reyes 2021.12.20 16:55 
 

Muy bueno, hace pocas horas lo instalé y está dando buenos resultados, espero siga así. Estaré actualizando la información y datos. La respuesta del creador de este indicador es rápida.

Nick167
49
Nick167 2021.05.22 00:27 
 

I purchased Stein Investments tools for MT5, also FX Volume. And they make a good impression. I learn to use them effectively. I already have a few questions that I will gladly ask after adding me to the forum :) I know for sure that one more application would be useful, which would give signals on the basis of all the others, connecting them together. I mean calculating the most precise inputs and outputs based on FX Power, FX Volume and FX Trend. Perhaps it will be an improved version of Trade Manager? That's a question for Daniel :)

Daniel Stein
119693
開発者からの返信 Daniel Stein 2021.05.24 10:43
Hi Nick, I sent you the invitation to our group chat. In the Link Library of this chat, you'll find a link to the STS dashboard, a tool that summarizes the information of the individual indicators and alerts you based on your individual settings. Best regards, Daniel
Alex East
100
Alex East 2021.02.19 17:58 
 

I have been using FX Volume for around 4-5 months and I can not rate it highly enough. Along, with the rest of Stein's tools they were a real gamechanger for me after years of struggling to find an edge in the market and personally I feel that FX Volume is the most powerful of the lot. Customer service is superb - any issues at all and Daniel is always willing to help. Regular updates - the indicator just keeps on getting better. NB: Like with any indicator, Steins suite of tools are best used in conjuction with technical analysis. If used in this way they are extremely powerful.

Luke Perrett
3278
Luke Perrett 2021.02.09 23:05 
 

Amazing tool. Great insight into the market. Continually updating to get a closer edge. No crap telegram group. Great team behind all of Steins products. Find me a better product than this. Good luck. Keep up the amazing work Stein team, we need you!!

Andre Gomes
2475
Andre Gomes 2021.02.06 20:05 
 

Excellent tool. I cannot thank Daniel and Alain enough for building this amazing tool, which truly gives you and edge to trade forex markets.

CaesarX
304
CaesarX 2021.01.10 09:28 
 

FxVolume has become the most important tool at my disposal, I simply couldn't go without it

Boriwan
641
Boriwan 2020.10.26 20:10 
 

Отличная работа! Спасибо!

Joshua Jeffries
123
Joshua Jeffries 2020.10.22 15:31 
 

I have had this indicator now for the best part of 6 months. I find the insights extremely useful and has saved my skin a few times. Trades i would've normally taken nullified by this indicator. I find it great for swing trading as I can see the volume changing in real time and start to move in the direction i am anticipating. Used in conjunction with the other tools in the box you will find great results. The community is top notch and also run community projects for EA's and Dashboards, the subscription alone is worth that. There are several strategies to use the tools and suits every trader. We have low TF traders in the group M1-M5 and also people like me H1 - D1, and we all seem to be getting great results! For what you get, the price alone is absolutely a steal, it will add so much value to your trading i can't even describe. Since starting my account is up over 500% so yeah, speaks for itself. If you are interested in the closed thing you'll get to an institutional tool on MQL, well, this is it.

The most useful info are

LOTS

Percentage of long trades

Once you see these increasing for one pair, it is almost a sure thing the price is going to follow. The subscription is so cheap you can't not try it. I can't thank Daniel and the guys in the group enough!

Stephan Grobler
147
Stephan Grobler 2020.08.29 12:58 
 

Excellent tool!

Aravind Kolanupaka
8495
Aravind Kolanupaka 2020.06.27 18:59 
 

So many ways to use the data and confirm trades.

RDI
1482
RDI 2020.04.01 22:04 
 

Great Indicator . Thanks Daniel!!

レビューに返信
バージョン 4.55 2023.08.30
Fixed bug when symbols alert enabled
バージョン 4.53 2023.08.01
Added INSTANCE_ID input parameter

Fixed GOLD bug, shifting all currencies data
バージョン 4.52 2023.07.31
Fixed iCustom call, sometimes displaying the panel

Added Gold input parameters, and updated to use last framework changes
バージョン 4.50 2023.07.26
Fixed invalid pointer, framework bug when no history lines are displayed

Fixed bug in loading FXV parameters
バージョン 4.48 2023.07.24
Fixed minor bugs

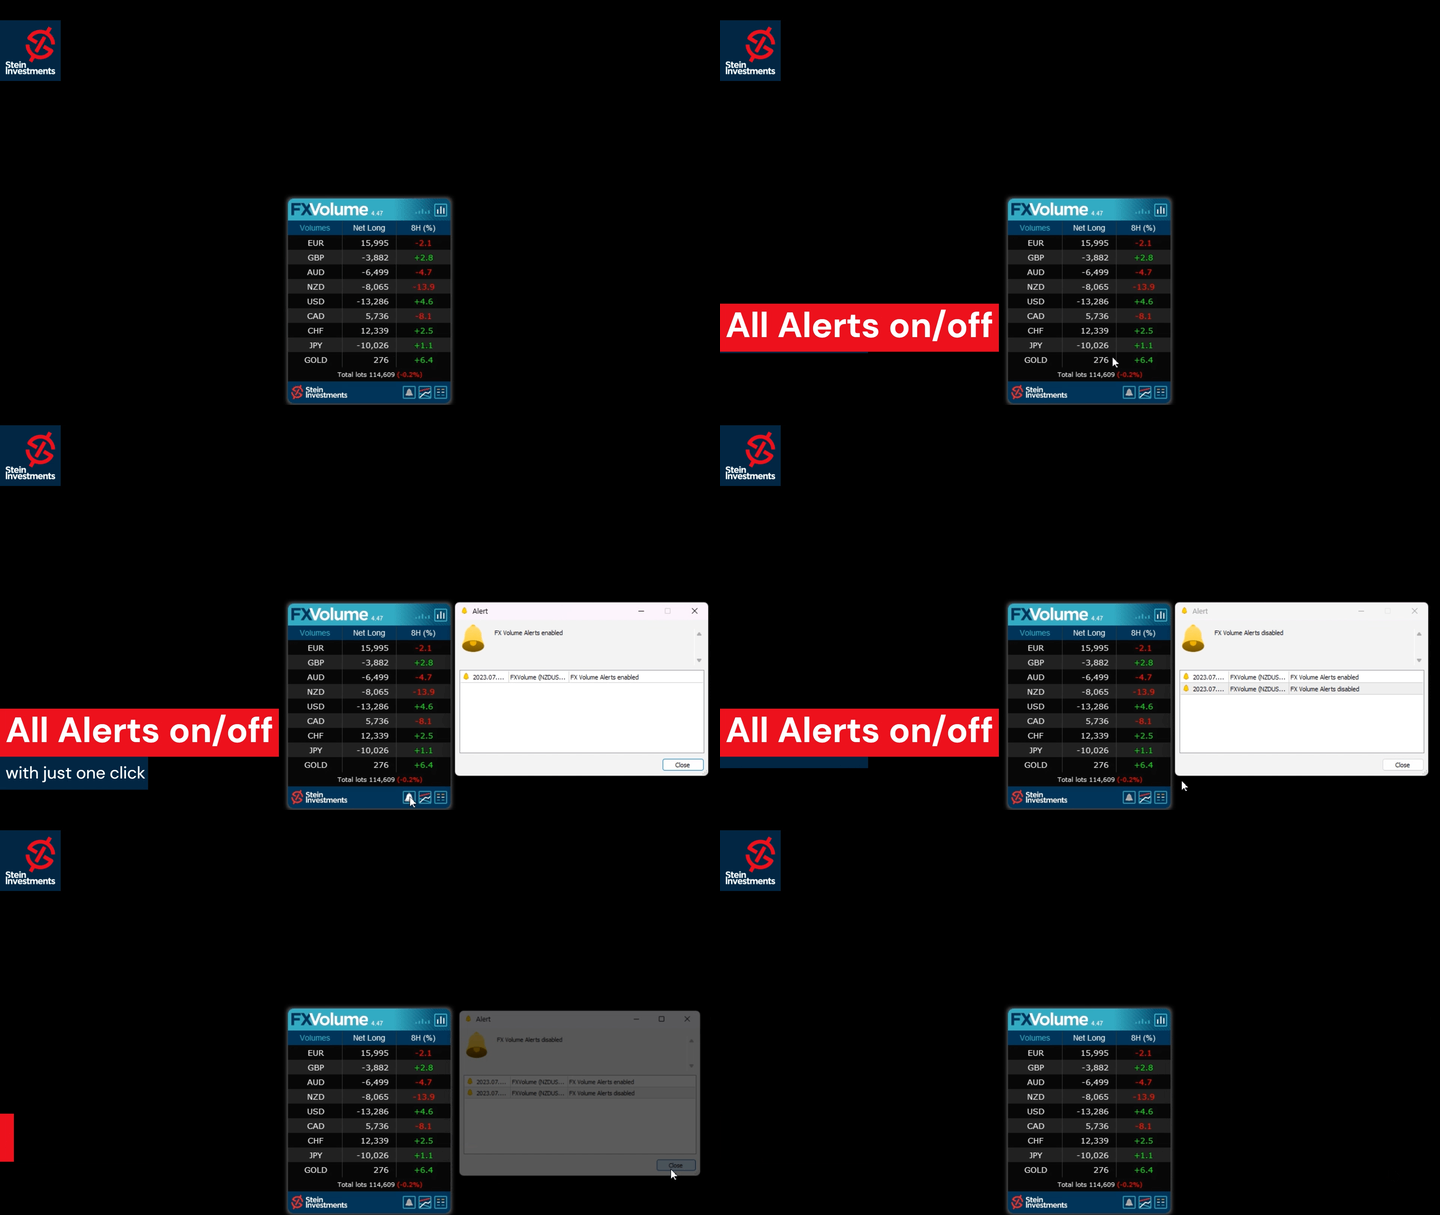
Added an alert button in the panel

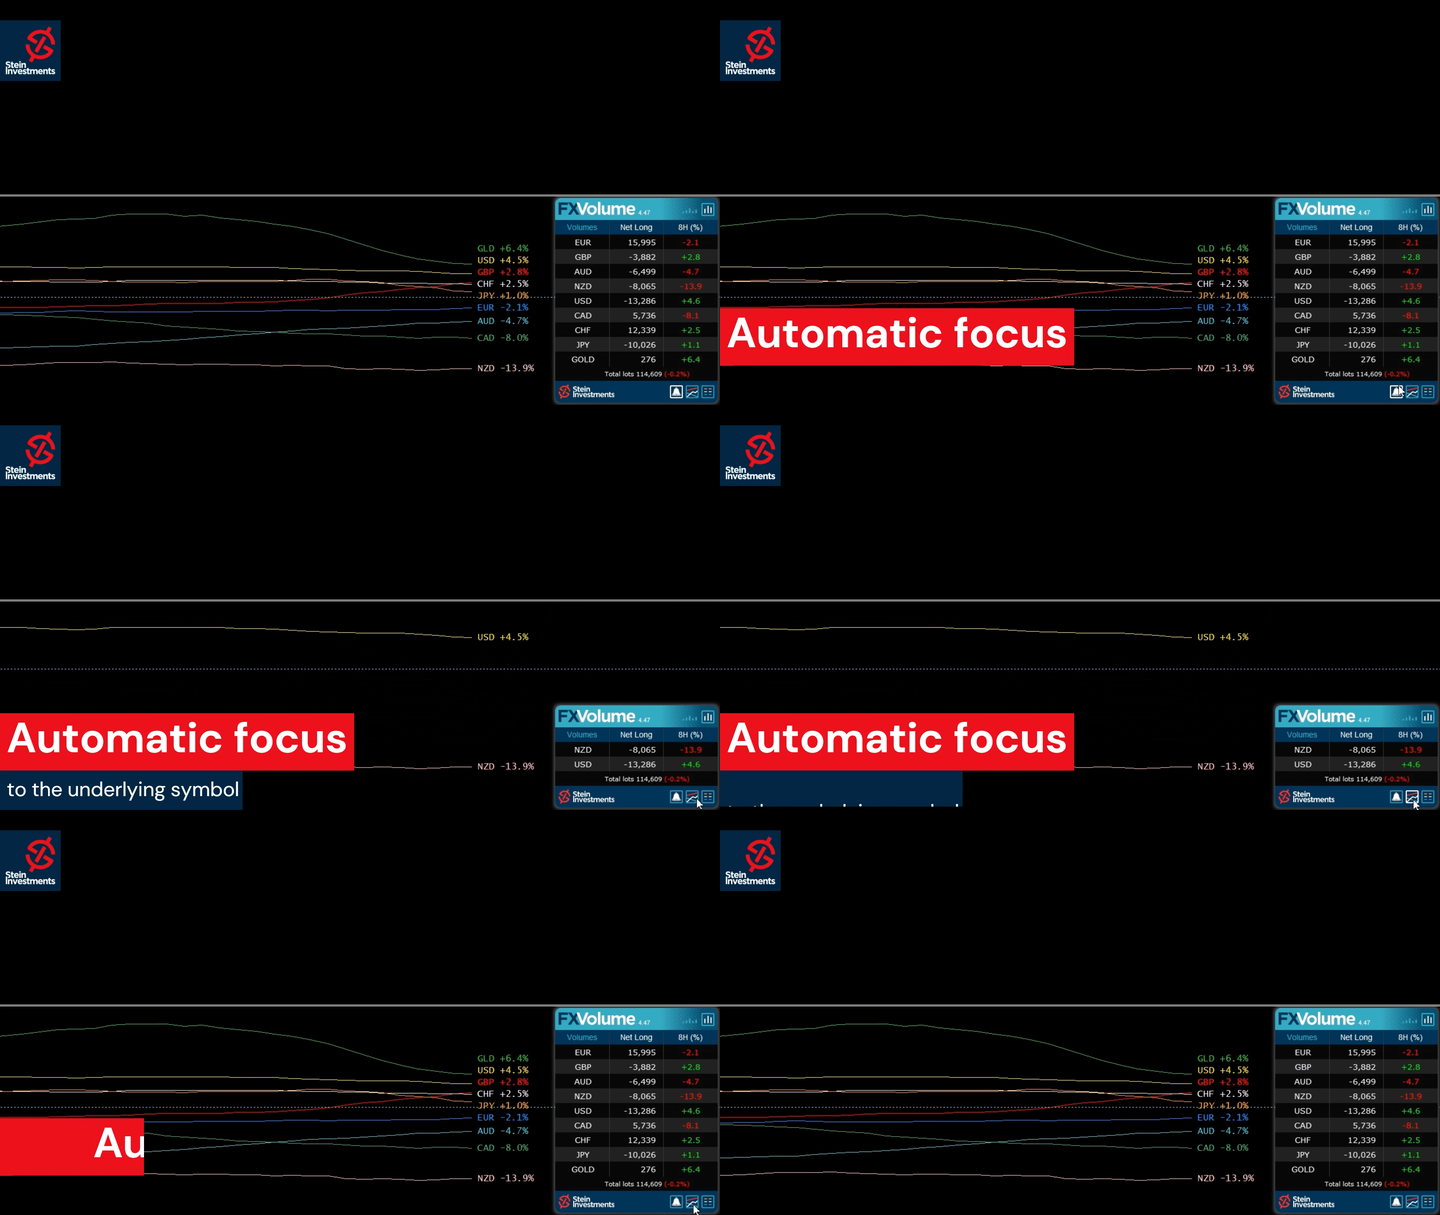
Alerts are now individually configurable according to currencies selected

Update with last framework and generic changes

Changed input parameters (without effect on iCustom requests)

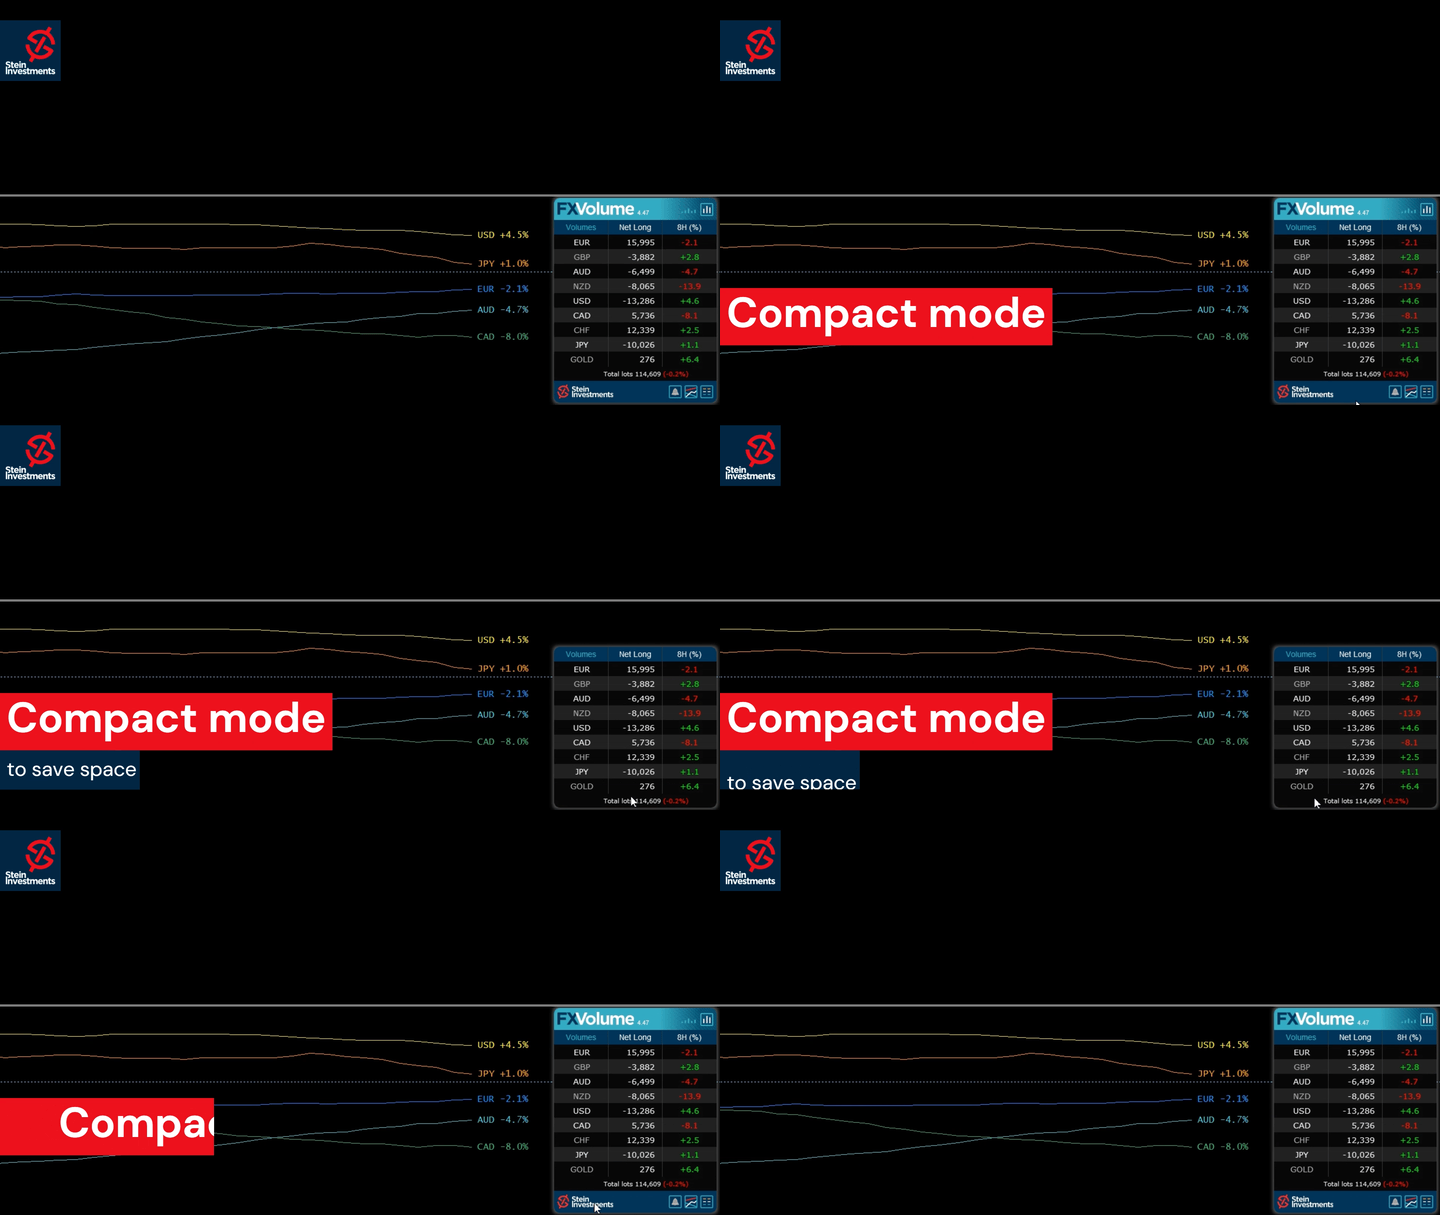
Changed currency sorting in the panel following a logical convention for symbol names
バージョン 4.42 2023.06.01
Fixed GUI DPI adjustment bug
バージョン 4.41 2023.06.01
⚠️Due to necessary changes in our panel management, you have to reconfigure your charts once after the update⚠️

New Features
Added history mode "Net Long % change"
Added new main panel view "Net long % change"
Added alerts for "Net long % change" drop & rise

Changed indicator label on chart to display one decimal at % values
Changed indicator digits according to history mode
Changed the zoom factor to use % values
Symbols list refactoring as a new panel


Graphics
New rounded corner panel design.
Added a different color for the "Past" data column.
Added input for panel back color if the auto-scheme is disabled
Improved plot labels display to avoid overlapping. (MT5 only)


Under the hood
Apply complete internal refactoring
Apply the last framework update
バージョン 4.10 2022.03.08
Fixed resource loading issue on some Mac/Linux systems

Fixed graphical panel bug when missing past data
バージョン 4.0 2022.03.02
FX Volume 4.0 comes with two additional features.

1. The option to use the internal comparison calculation on a minute basis which allows comparison below our previous minimum of 1 hour.

2. Inspired by our fellow trader Luke, we created a Net Long Volume view including history lines to understand better how the Net Long volume correlates with the market moves we see on the chart.

Check our Stein Investments YouTube channel to see a video of the new features.

We're sure you'll like the new features.
バージョン 3.58 2021.09.01
Optimized FX Volume to be fully compatible with MT4/MT5 templates
バージョン 3.53 2021.05.08
Transition version to use data in common data folder

Fixed bug with GMT when running FX Volume on a weekend for the first time

Optimizations when used as free demo version in the strategy tester


バージョン 3.50 2021.04.08
Fixed minor bug when alerts are enabled
バージョン 3.49 2021.04.01
This update contains the following changes:

- New Alert options based on Long and Short Volume
- New Alert filters based on the dominance of one side available,
i.e. if Volume Long is bigger than Volume Short, you'll get only alerts for the Volume Long side
- Improved communication with the new SI Connect 2.x
- Optimized settings managements

and these changes are related to the strategy tester usage

- Fixed current candle update bug
- Added parameter to start with a focus on chart currencies
- Improved backtesting performance
バージョン 3.35 2021.03.11
Fixed M1 issue when used in the strategy tester
バージョン 3.34 2021.03.10
Fixed row labels in Changes view
バージョン 3.33 2021.03.10
Internal refactoring
Changed SI Connect detection method
Improved performance when used in the strategy tester
バージョン 3.28 2021.02.26
FX Volume GUI enabled in Strategy Tester visual mode when called via iCustom
バージョン 3.27 2021.02.26
Besides various minor fixes and improvements, we made a few specific improvements when using FX Volume inside an EA and in the strategy tester like:

- Improve behaviour when called from iCustom
- Improved data processing (all modes)
- Fix minor display bugs while using the visual mode
- Disabled alerts in tester mode
バージョン 3.25 2021.02.22
Optimized SI Connect EA detection in case of heavy usage (more than 20 instances)
バージョン 3.24 2021.02.17
Fix symbols list display (top of the list possibly hidden)
バージョン 3.23 2021.02.17
With this update, it's finally possible to combine different views AND comparison periods in just one chart.

In this way, you'll easily see if the short term volume is still dynamic and supporting the volume change of a higher period.
This offers an entirely new grade of precision because you now see exactly when to enter when to exit and if it's still worth to hold the position.

We hope you'll enjoy the new flexibility provided by FX Volume.
バージョン 3.18 2021.02.10
Fixed bug resulting in orphan objects on the chart

Fixed bug of line style changes when using several instances
バージョン 3.17 2021.02.04
This release is another huge step forward and provides the following new features.

- Additional colouration for the positive and negative percentage values

- History lines for Volume Total, Volume Long and Volume short are now available

- All history lines can be hidden completely via parameters in the indicator properties

- Use multiple instances of FX Volume in one chart to create individual comparison views.
Note: Every instance has to use a different "History lines and buffers" mode to manage all instances correctly.

- Volume Total, Volume Long and Volume Short are now available in the indicator buffers

IMPORTANT: Please note that the history lines and the panel information is managed independently!
If you switch to a different panel view, this does NOT change the volume history lines. You have to change them in the indicator properties.

Please note also that the value labels of the history lines differ from the information seen in the panel because the panel displays always the latest available information while the history line buffer provides an OHLC volume data average for the entire candle. Please visit our FX Volume info channel at https://t.me/SI_FX_Volume to get more detailed information
バージョン 3.1 2021.02.01
Renamed view labels for a better usability
バージョン 3.0 2021.02.01
This major update provides a deeper insight into the real trading market sentiment

Now you can see the total volume of the long and short side separately as well as how it changed during the selected comparison period. With this information, you can easily spot on which side of the market there is an upcoming dynamic in the real trading volume.

And because we are often asked for it we added all this information for GOLD as well.

Enjoy the new amazing features of FX Volume and leave a review if you like it.
バージョン 2.26 2020.12.21
Fixed minor bug occurring rarely at a terminal restart
バージョン 2.25 2020.12.18
Minor bug fixed causing an empty panel due to unchanged data

Added special section for the alert option in the indicator properties
バージョン 2.24 2020.12.16
The following new features have been added:

-Alert on long ratio rise/drop
-Alert on total volume rise/drop
-Alert on delta increase/decrease

We hope you'll enjoy the new alert options.
バージョン 2.22 2020.12.02
Disabled DEBUG mode
バージョン 2.21 2020.11.23
Fixed empty panel bug
バージョン 2.20 2020.09.18
Changed Delta calculation display to provide more accurate results

Added total volume buffer -> ask for the updated code snippets

FX Volume is now ready to be used in the MT4 strategy tester!
バージョン 2.16 2020.06.24
The panel uses current and raw data only. OHLC is used only for history lines.

Fixed bug in panel update when data are not directly available.

Added an alert for insufficient Terminal "Max bars" settings.
バージョン 2.0 2020.06.20
Dear customers, please welcome our fantastic FX Volume 2.0. We spent weeks of work designing this beautiful panel, adding excellent features, and providing more detailed information to offer you outstanding user experience and a real edge in trading.

To benefit from all improvements it is necessary that you update FX Volume and SI Connect to the latest available version!
バージョン 1.26 2020.06.07
Metaquotes provided important fixes in MQL5 and asked us to recompile all our market tools.
So please update your local copy to the latest available to benefit from bug fixes and improvements.
バージョン 1.25 2020.05.14
Use updated libraries
バージョン 1.24 2020.03.09
Added security to avoid alert flooding

Fixed bug which checks and sends alert continuously if the data file can't be opened