버전 4.85
2025.01.23
Enhancements:
- Updated to the latest framework for improved performance and compatibility.
- Introduced Net Long Delta Plot Customization to give you more control over how you visualize delta data.
Fixes:
- Resolved an issue causing loss of saved settings on the chart.
- Fixed input inconsistencies to streamline configuration.
- Corrected the Delta History Line Calculation to enhance the accuracy of displayed data.
- Addressed an issue in FXVSymbolsView.mqh (line 146) to improve functionality.
버전 4.82
2024.10.16
Fixed alerts that were incorrectly turned off.
버전 4.78
2024.09.28
FX Volume 4.78 contains the following changes:
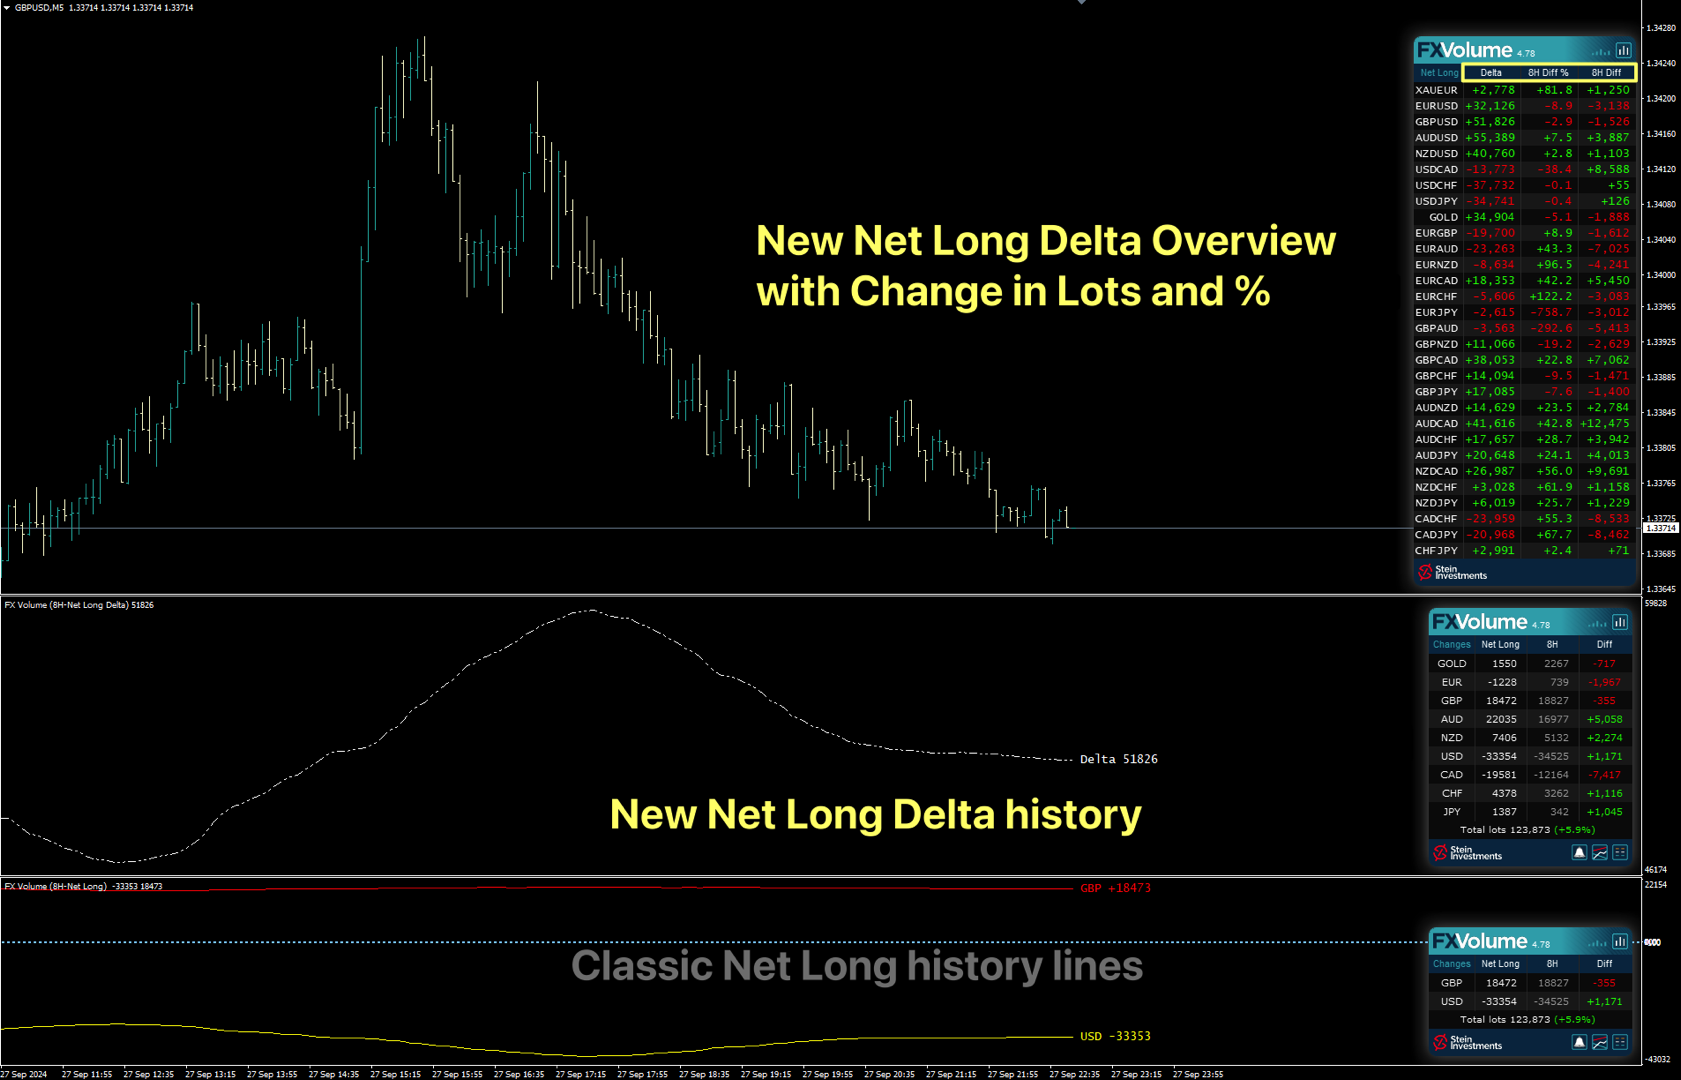
All views have been reconstructed using the updated SI framework. The Net Long Delta History Mode has been introduced as new History Line Mode.
The Net Long Delta Overview has been added as an alternative view in the Symbol List panel, and has been established as the default view for the symbol list when any of the three Net Long options is chosen in the properties.
Gold has been set to display by default.
Additionally, saved settings will now be cleared when a chart is closed.
버전 4.68
2024.07.12
New Features:
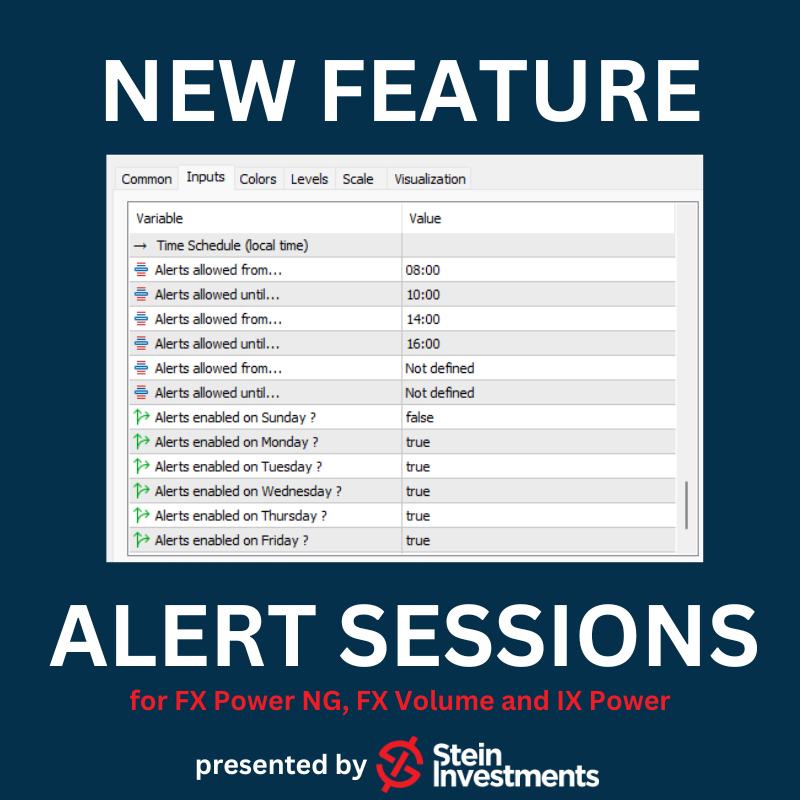
- Alert Scheduler: Now you can customize the timing for indicator signals to fit your daily routine without being disturbed when you're busy.
Bug Fixes:
- Fixed occasional loss of history line colours, width, and style.
- Removed "Gold" plot visibility when not used by settings.
Improvements:
- Enhanced data reliability in extreme cases.
- Improved processing for "full" updates.
버전 4.55
2023.08.30
Fixed bug when symbols alert enabled
버전 4.53
2023.08.01
Added INSTANCE_ID input parameter
Fixed GOLD bug, shifting all currencies data
버전 4.52
2023.07.31
Fixed iCustom call, sometimes displaying the panel
Added Gold input parameters, and updated to use last framework changes
버전 4.50
2023.07.26
Fixed invalid pointer, framework bug when no history lines are displayed
Fixed bug in loading FXV parameters
버전 4.48
2023.07.24
Fixed minor bugs
Added an alert button in the panel
Alerts are now individually configurable according to currencies selected
Update with last framework and generic changes
Changed input parameters (without effect on iCustom requests)
Changed currency sorting in the panel following a logical convention for symbol names
버전 4.42
2023.06.01
Fixed GUI DPI adjustment bug
버전 4.41
2023.06.01
⚠️Due to necessary changes in our panel management, you have to reconfigure your charts once after the update⚠️
New Features
Added history mode "Net Long % change"
Added new main panel view "Net long % change"
Added alerts for "Net long % change" drop & rise
Changed indicator label on chart to display one decimal at % values
Changed indicator digits according to history mode
Changed the zoom factor to use % values
Symbols list refactoring as a new panel
Graphics
New rounded corner panel design.
Added a different color for the "Past" data column.
Added input for panel back color if the auto-scheme is disabled
Improved plot labels display to avoid overlapping. (MT5 only)
Under the hood
Apply complete internal refactoring
Apply the last framework update
버전 4.10
2022.03.08
Fixed resource loading issue on some Mac/Linux systems
Fixed graphical panel bug when missing past data
버전 4.0
2022.03.02
FX Volume 4.0 comes with two additional features.
1. The option to use the internal comparison calculation on a minute basis which allows comparison below our previous minimum of 1 hour.
2. Inspired by our fellow trader Luke, we created a Net Long Volume view including history lines to understand better how the Net Long volume correlates with the market moves we see on the chart.
Check our Stein Investments YouTube channel to see a video of the new features.
We're sure you'll like the new features.
버전 3.58
2021.09.01
Optimized FX Volume to be fully compatible with MT4/MT5 templates
버전 3.53
2021.05.08
Transition version to use data in common data folder
Fixed bug with GMT when running FX Volume on a weekend for the first time
Optimizations when used as free demo version in the strategy tester
버전 3.50
2021.04.08
Fixed minor bug when alerts are enabled
버전 3.49
2021.04.01
This update contains the following changes:
- New Alert options based on Long and Short Volume
- New Alert filters based on the dominance of one side available,
i.e. if Volume Long is bigger than Volume Short, you'll get only alerts for the Volume Long side
- Improved communication with the new SI Connect 2.x
- Optimized settings managements
and these changes are related to the strategy tester usage
- Fixed current candle update bug
- Added parameter to start with a focus on chart currencies
- Improved backtesting performance
버전 3.35
2021.03.11
Fixed M1 issue when used in the strategy tester
버전 3.34
2021.03.10
Fixed row labels in Changes view
버전 3.33
2021.03.10
Internal refactoring
Changed SI Connect detection method
Improved performance when used in the strategy tester
버전 3.28
2021.02.26
FX Volume GUI enabled in Strategy Tester visual mode when called via iCustom
버전 3.27
2021.02.26
Besides various minor fixes and improvements, we made a few specific improvements when using FX Volume inside an EA and in the strategy tester like:
- Improve behaviour when called from iCustom
- Improved data processing (all modes)
- Fix minor display bugs while using the visual mode
- Disabled alerts in tester mode
버전 3.25
2021.02.22
Optimized SI Connect EA detection in case of heavy usage (more than 20 instances)
버전 3.24
2021.02.17
Fix symbols list display (top of the list possibly hidden)
버전 3.23
2021.02.17
With this update, it's finally possible to combine different views AND comparison periods in just one chart.
In this way, you'll easily see if the short term volume is still dynamic and supporting the volume change of a higher period.
This offers an entirely new grade of precision because you now see exactly when to enter when to exit and if it's still worth to hold the position.
We hope you'll enjoy the new flexibility provided by FX Volume.
버전 3.18
2021.02.10
Fixed bug resulting in orphan objects on the chart
Fixed bug of line style changes when using several instances
버전 3.17
2021.02.04
This release is another huge step forward and provides the following new features.
- Additional colouration for the positive and negative percentage values
- History lines for Volume Total, Volume Long and Volume short are now available
- All history lines can be hidden completely via parameters in the indicator properties
- Use multiple instances of FX Volume in one chart to create individual comparison views.
Note: Every instance has to use a different "History lines and buffers" mode to manage all instances correctly.
- Volume Total, Volume Long and Volume Short are now available in the indicator buffers
IMPORTANT: Please note that the history lines and the panel information is managed independently!
If you switch to a different panel view, this does NOT change the volume history lines. You have to change them in the indicator properties.
Please note also that the value labels of the history lines differ from the information seen in the panel because the panel displays always the latest available information while the history line buffer provides an OHLC volume data average for the entire candle. Please visit our FX Volume info channel at https://t.me/SI_FX_Volume to get more detailed information
버전 3.1
2021.02.01
Renamed view labels for a better usability
버전 3.0
2021.02.01
This major update provides a deeper insight into the real trading market sentiment
Now you can see the total volume of the long and short side separately as well as how it changed during the selected comparison period. With this information, you can easily spot on which side of the market there is an upcoming dynamic in the real trading volume.
And because we are often asked for it we added all this information for GOLD as well.
Enjoy the new amazing features of FX Volume and leave a review if you like it.
버전 2.26
2020.12.21
Fixed minor bug occurring rarely at a terminal restart
버전 2.25
2020.12.18
Minor bug fixed causing an empty panel due to unchanged data
Added special section for the alert option in the indicator properties
버전 2.24
2020.12.16
The following new features have been added:
-Alert on long ratio rise/drop
-Alert on total volume rise/drop
-Alert on delta increase/decrease
We hope you'll enjoy the new alert options.
버전 2.22
2020.12.02
Disabled DEBUG mode
버전 2.21
2020.11.23
Fixed empty panel bug
버전 2.20
2020.09.18
Changed Delta calculation display to provide more accurate results
Added total volume buffer -> ask for the updated code snippets
FX Volume is now ready to be used in the MT4 strategy tester!
버전 2.16
2020.06.24
The panel uses current and raw data only. OHLC is used only for history lines.
Fixed bug in panel update when data are not directly available.
Added an alert for insufficient Terminal "Max bars" settings.
버전 2.0
2020.06.20
Dear customers, please welcome our fantastic FX Volume 2.0. We spent weeks of work designing this beautiful panel, adding excellent features, and providing more detailed information to offer you outstanding user experience and a real edge in trading.
To benefit from all improvements it is necessary that you update FX Volume and SI Connect to the latest available version!
버전 1.26
2020.06.07
Metaquotes provided important fixes in MQL5 and asked us to recompile all our market tools.
So please update your local copy to the latest available to benefit from bug fixes and improvements.
버전 1.25
2020.05.14
Use updated libraries
버전 1.24
2020.03.09
Added security to avoid alert flooding
Fixed bug which checks and sends alert continuously if the data file can't be opened


(in December) I rented this FX Volume Indicator for six months. Now at the end of January after just more than a month, I have purchased it, as the insights that it provides into what the institutional players are actually doing is exact and is not available anywhere else.... I also rented FX Power NG and the Custom Alerts Indicators and they have fit right into and confirm my strategy, so I have also purchased them.... I am so pleased I have done so.... Thank you Daniel..