Flipa Setups

NEXT price Actions - Series One

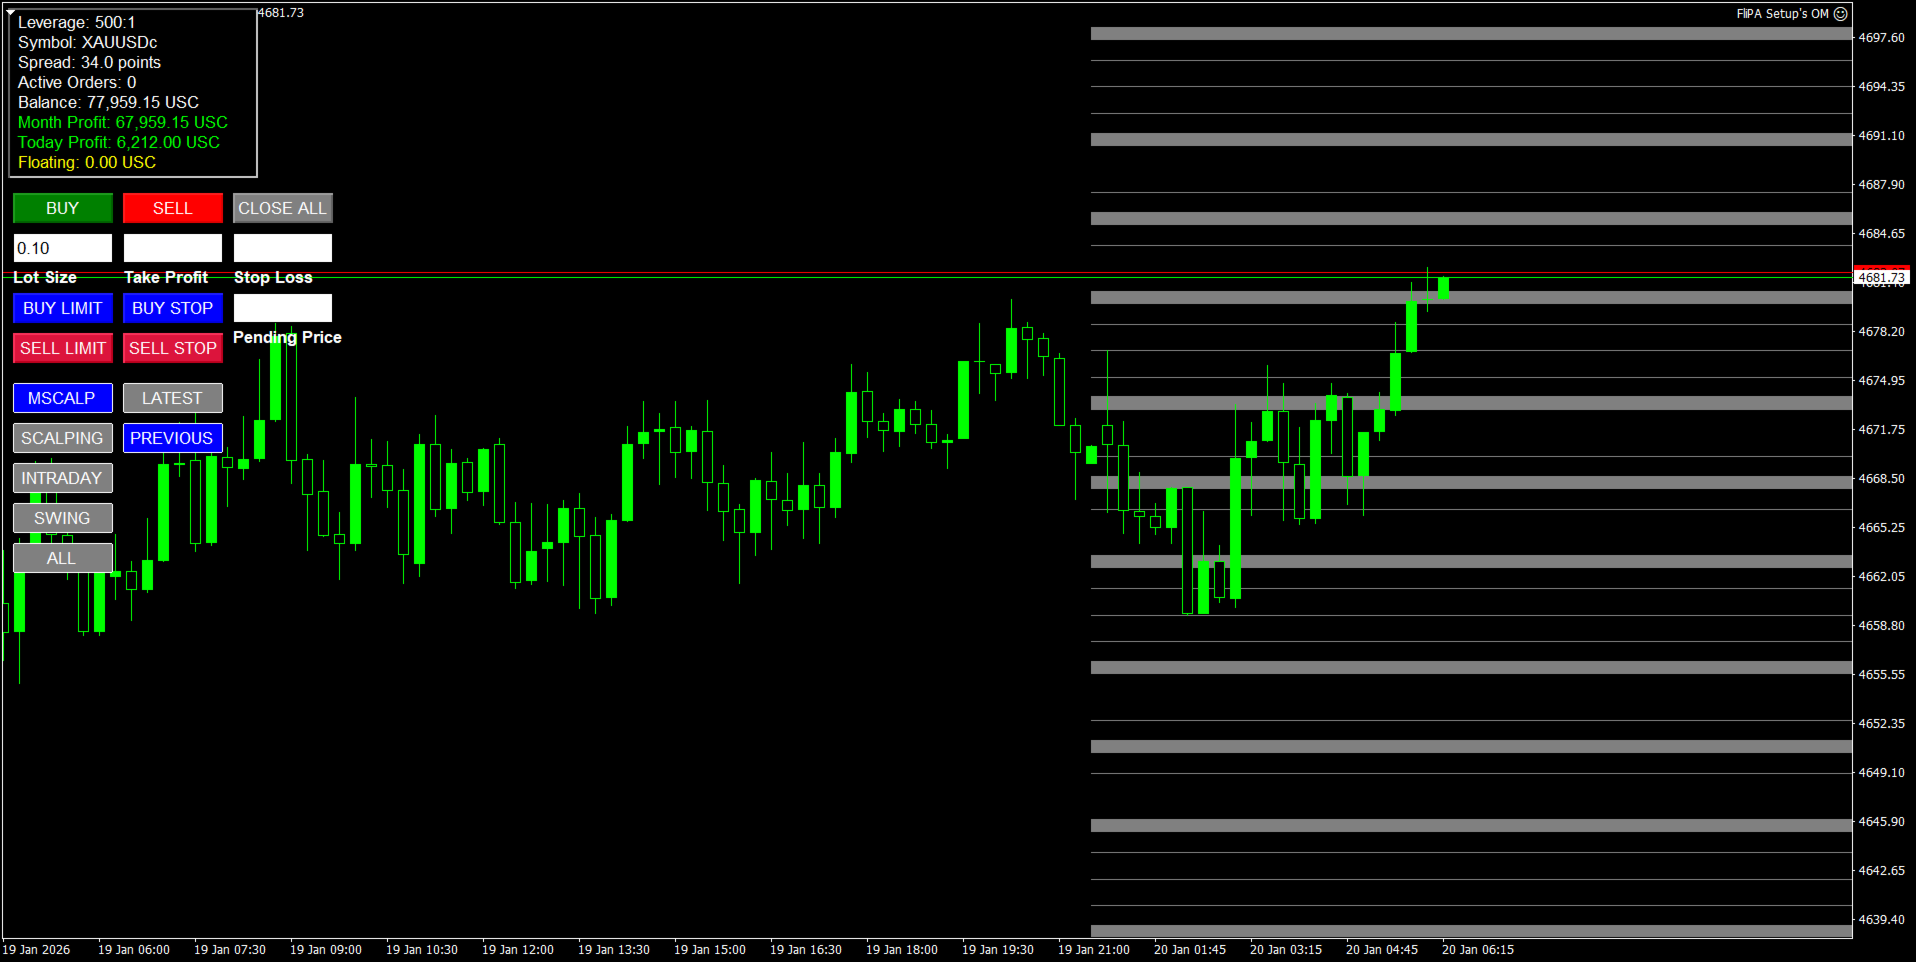
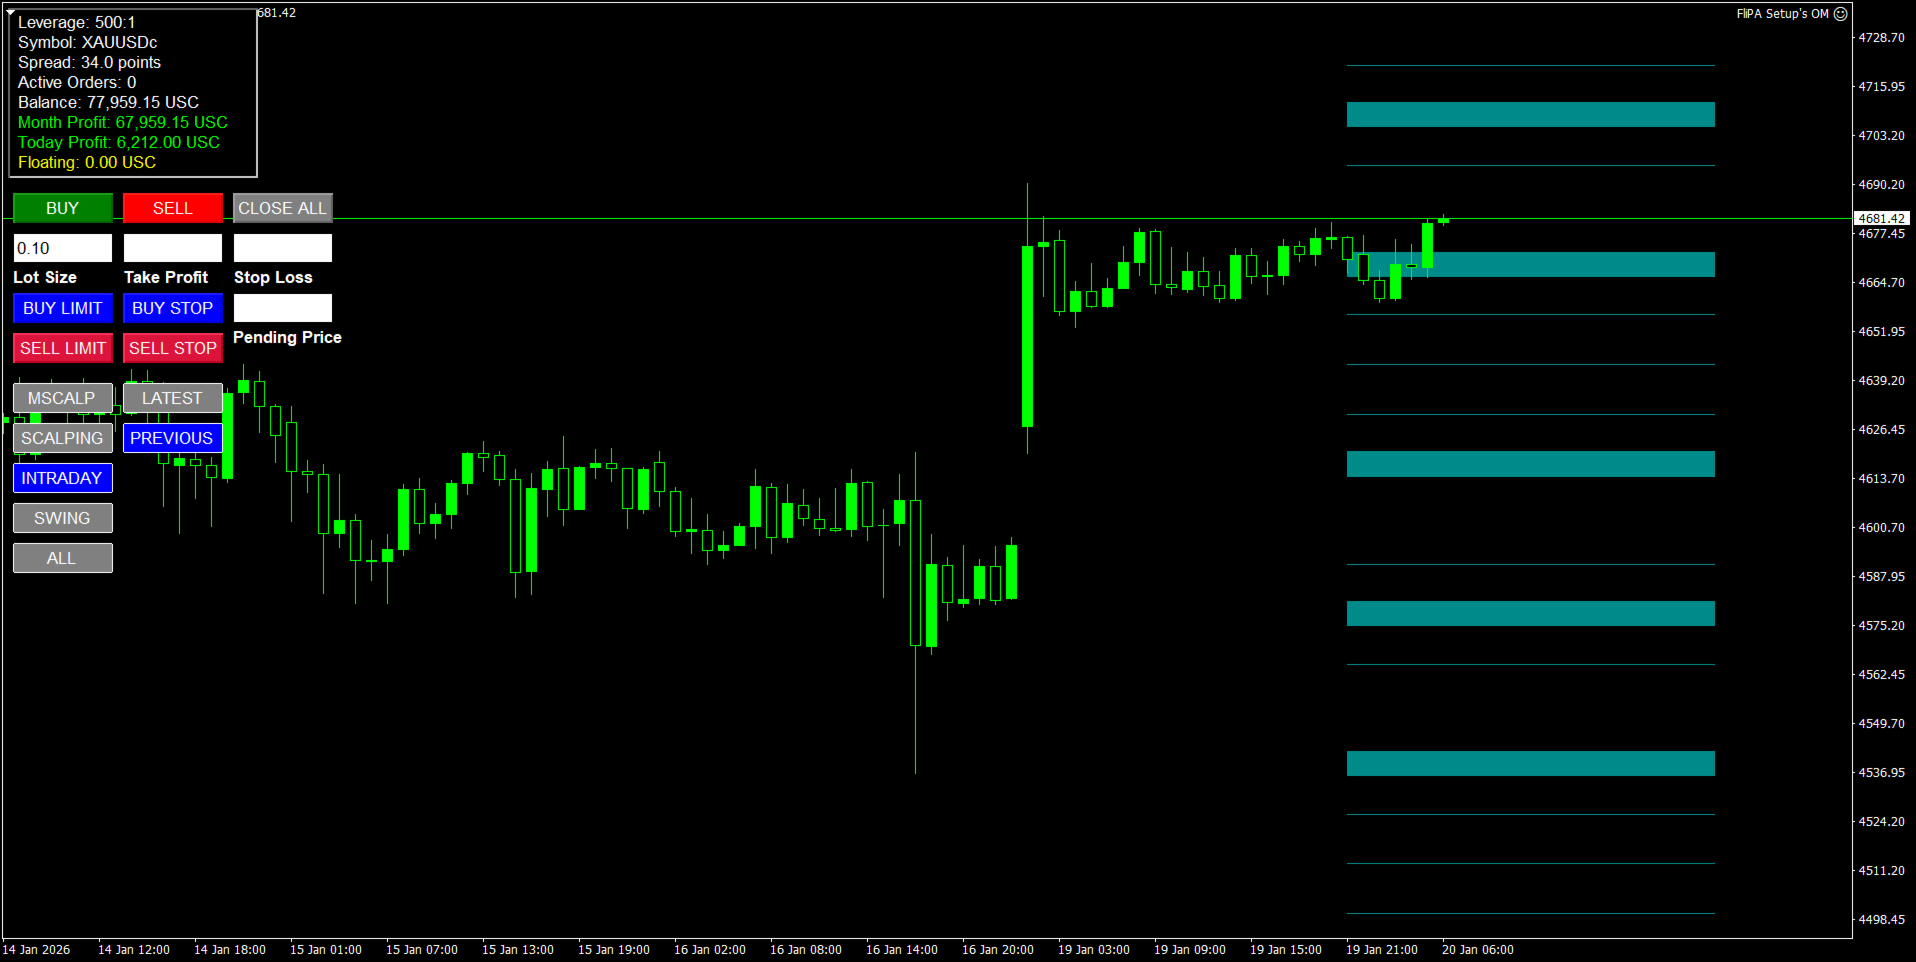
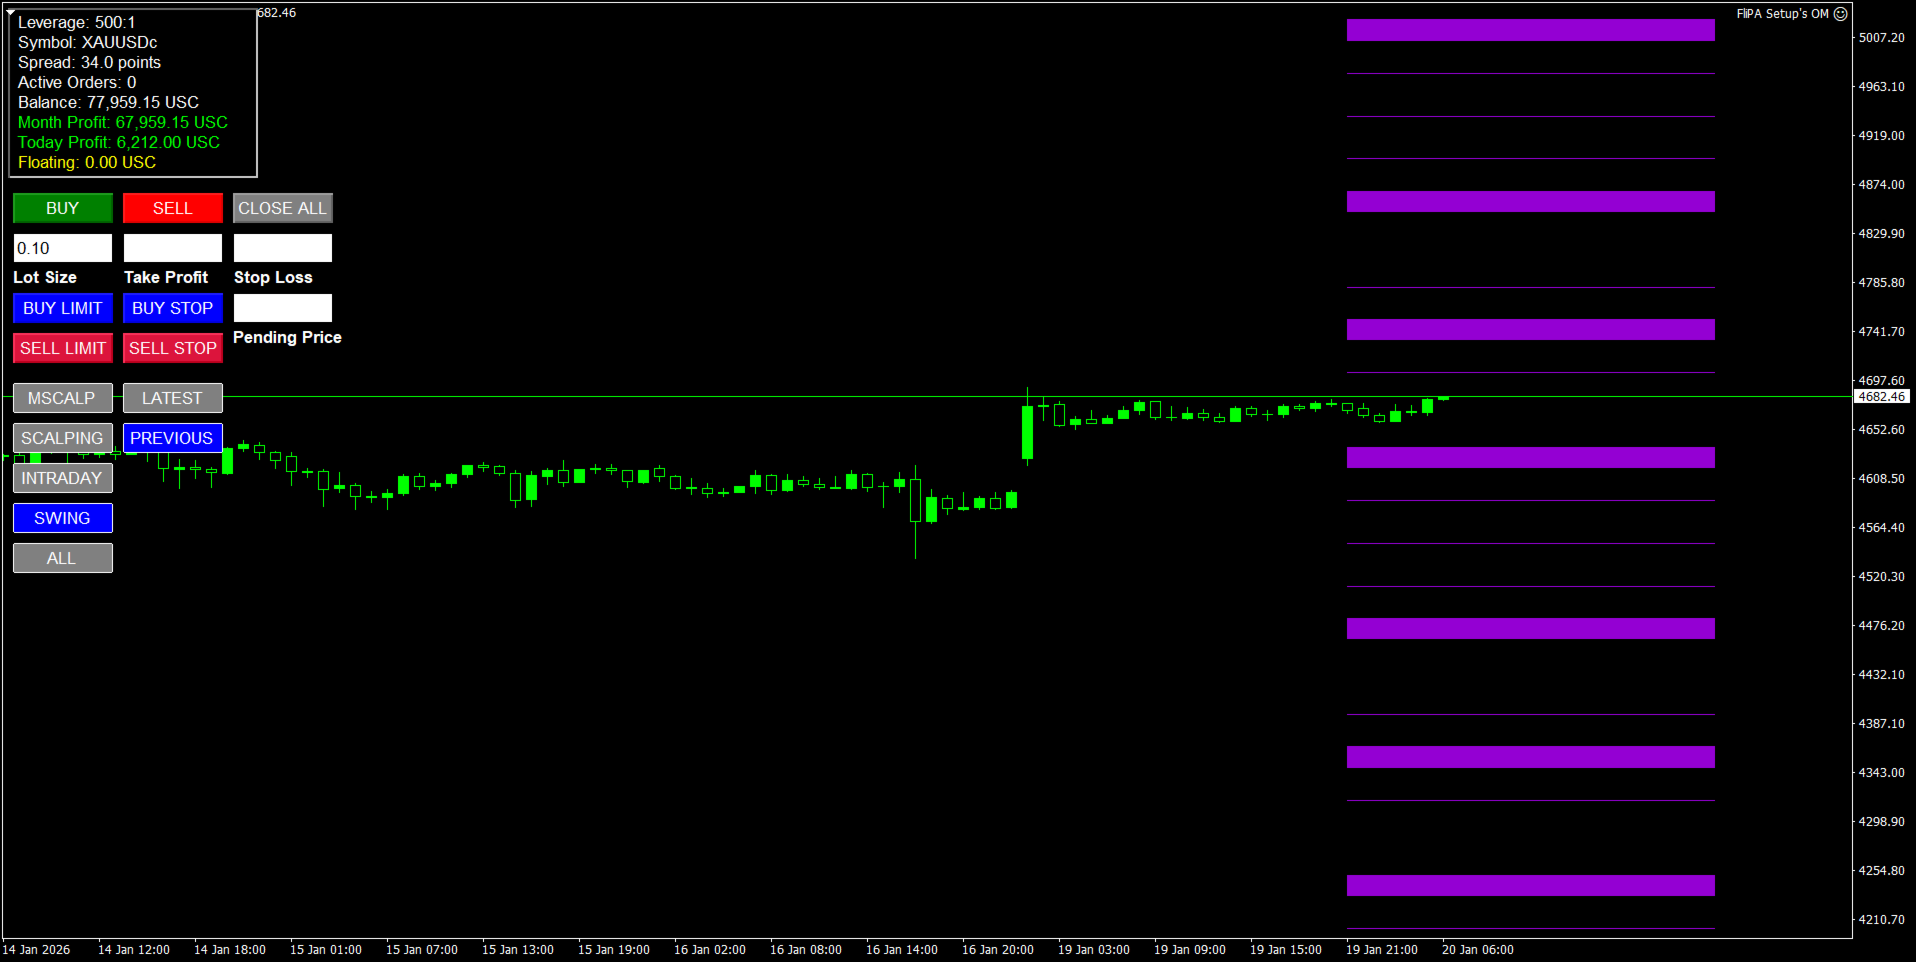
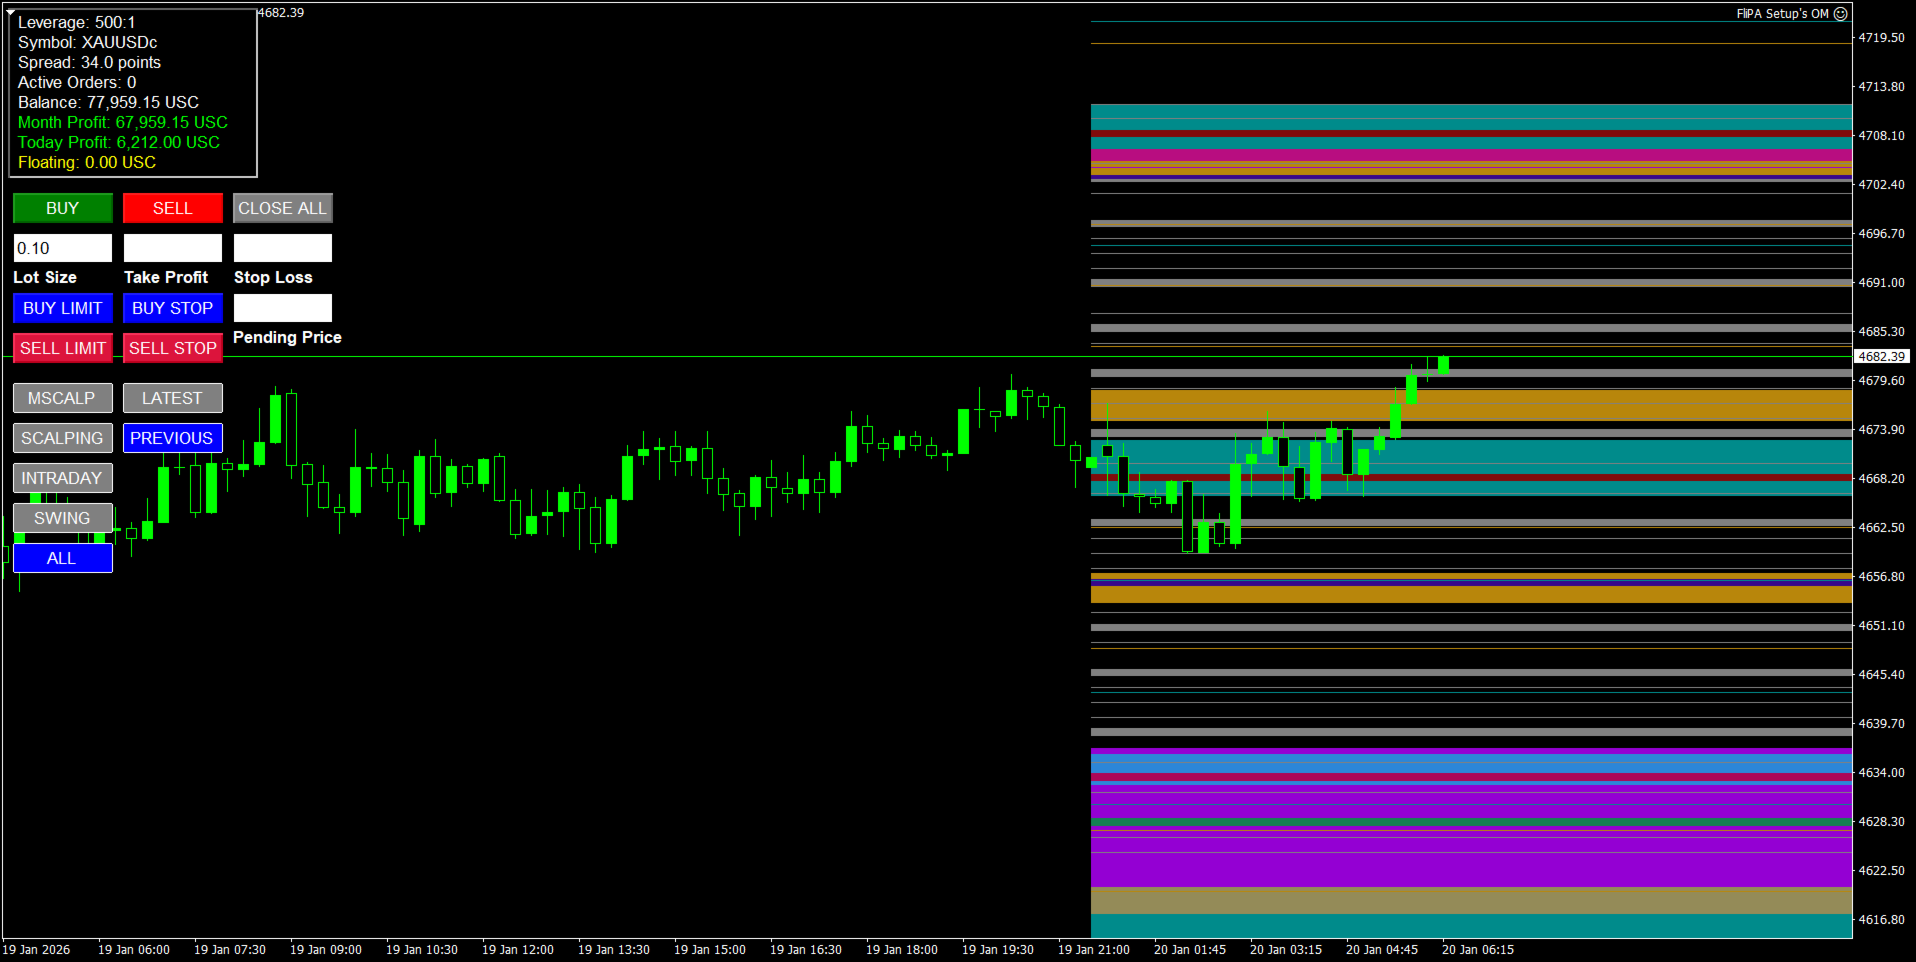
1. Auto Mapping Projection Price Action XAUUSD to get the most accurate setup for each Entry Zone.

2. The tool used has been customized according to Swap Zones setup.

3. The setup that results after Mapping is all setups, namely Scalping, Intraday, and Swing.

4. This setup does not need a marking and depends on SNR & SND.

5. This setup only depends 100% on the tool used.

6. This setup is very suitable for getting an Entry in a shadow candle stick.

7. This setup will also follow the market direction & can see changes in the market direction more accurately.

8. To entry, wait for Breakout or Rejection at the zone.


Prodotti consigliati
M W Pattern Pro
Noiros Tech
4.14 (7)
M & W Pattern Pro is an advanced scanner for M and W patters , it uses extra filters to ensure scanned patterns are profitable. The indicator can be used with all symbols and time frames. The indicator is a non repaint indicator with accurate statistics calculations. To use , simply scan the most profitable pair using the statistics dashboard accuracy , then enter trades on signal arrow and exit at the TP and SL levels. STATISTICS : Accuracy 1 : This is the percentage of the times price hits TP
Next level of trend trading here. Possibility 75%, the indicator analyzes the current market to determine short (small dot), middle (circle with a dot inside) and long (cross with a circle and a dot inside) trends.  Wingdings characters of  Aqua color represents the beginning of the UP trend. Wingdings characters of  Orange color represents the beginning of the DOWN trend. Possibility 75% Indicator will improve your trading in the world of forex, commodities, cryptocurrencies and indices.
Sweet Waffle
Christophe Godart
The arrows are calculated with: -     2 Parabolic  parameters -     2 ADX parameters -     4 Stochastic parameters We recommend to combine it with Parabolic, ZigZag or Elliot waves indicator. Always trade the trend! If you make sure to draw your trend lines and support/resistance zones you will just have to wait for the signal to appear. Take the trade. For Binary Options it is advisable to set the expiry time to 5-15 min in M1 chart. THIS INDICATOR IS ZERO REPAINT Best assets to trade: - EUR
PZ Harmonacci Patterns
PZ TRADING SLU
3.17 (6)
Trade smarter, not harder: Empower your trading with Harmonacci Patterns This is arguably the most complete harmonic price formation auto-recognition indicator you can find for the MetaTrader Platform. It detects 19 different patterns, takes fibonacci projections as seriously as you do, displays the Potential Reversal Zone (PRZ) and finds suitable stop-loss and take-profit levels. [ Installation Guide | Update Guide | Troubleshooting | FAQ | All Products ] It detects 19 different harmonic pric
WanaScalper MT4
Isaac Wanasolo
1 (1)
A scalping indicator based on mathematical patterns, which on average gives signals with relatively small SL, and also occasionally helps to catch big moves in the markets (more information in the video) This indicator has three main types of notifications: The first type warns of a possible/upcoming signal on the next bar The second type indicates the presence of a ready signal to enter the market/open a position The third type is for SL and TP levels - you will be notified every time price re
Mean Reversion Supply Demand Indicator Mean Reversion Supply Demand is the indicator to detect the important supply demand zone in your chart. The concept of supply demand trading relies on the quantity mismatching between buying and selling volumes in the financial market. Typically, supply demand zone serves to predict the turning point. The wave pattern, for any supply demand zone to work as an successful trade, looks like the price must touch the base zone, move away and then return to zone
Gold Titan King Scalper
Dodong Christian Arnon
Indicator Description GOLD TITAN KING SIGNAL INDICATOR High-Precision Gold Scalping Buy/Sell Signals – Manual Trading Assistant Overview The Gold Titan King Signal Indicator is a manual trading assistant tool designed for high-frequency scalping on Gold (XAUUSD) and other major pairs. It generates clear BUY/SELL signals with precise entry levels, along with adjustable Stop Loss and Take Profit levels displayed directly on the chart. ️ This tool is NOT an EA. It does not execute trades
Antabod Gamechanger
Rev Anthony Olusegun Aboderin
*Antabod GameChanger Indicator – Transform Your Trading!*   Are you tired of chasing trends too late or second-guessing your trades? The *Antabod GameChanger Indicator* is here to *revolutionize your trading strategy* and give you the edge you need in the markets!   Why Choose GameChanger? *Accurate Trend Detection* – GameChanger identifies trend reversals with *pinpoint accuracy*, ensuring you enter and exit trades at the optimal time.   *Clear Buy & Sell Signals* – No more guesswork! T
L'indicatore SMC Venom Model BPR è uno strumento professionale per i trader che operano nell'ambito del concetto di Smart Money (SMC). Identifica automaticamente due modelli chiave sul grafico dei prezzi: FVG   (Fair Value Gap) è una combinazione di tre candele, in cui c'è un gap tra la prima e la terza candela. Forma una zona tra livelli in cui non c'è supporto di volume, il che spesso porta a una correzione dei prezzi. BPR   (Balanced Price Range) è una combinazione di due modelli FVG che for
Shark Deal Book
Philip Pankaj Suthagar
4 (3)
Term  "shark"  in the business world denotes a high volume investor who just made a good investment in a highly Potential business deal.So, sharks are the ones who make the market move. In our case, if an American shark bought a Japanese company, he/she has to convert American dollars into Japanese yen to make the deal. So, the demand for the Japanese yen will increase sharply. Thus USD/JPY will go short rapidly if the deal was from the shark. Another example, In the case of forex, if fed increa
Trend Ray
Andriy Sydoruk
The indicator shows the potential trend direction by cyclical-wave dependence. Thus, all the rays of the intersection will be optimal rays, in the direction of which the price is expected to move, taking into account the indicator period. Rays can be used as a direction for potential market movement. But we must not forget that the approach must be comprehensive, the indicator signals require additional information to enter the market.
Alpha Trend sign has been a very popular trading tool in our company for a long time. It can verify our trading system and clearly indicate trading signals, and the signals will not drift. Main functions: Based on the market display of active areas, indicators can be used to intuitively determine whether the current market trend belongs to a trend market or a volatile market. And enter the market according to the indicator arrows, with green arrows indicating buy and red arrows indicating se
Night ghost
Dmitriy Kashevich
Night Ghost - Indicatore a freccia per opzioni binarie. Questo è un assistente affidabile per te in futuro! - Nessun ridisegno sul grafico -Funziona alla grande su tutte le coppie di valute! -Precisione dell'indicatore fino al 90% (soprattutto di notte) -Non c'è bisogno di impostare per molto tempo (impostato perfettamente per le opzioni binarie) - Segnali non in ritardo - La comparsa di un segnale sulla candela corrente -Perfetto per il periodo M1 (non più!) - Colore della candela ad
Scalper trend giornaliero (DTS) DTS è un indicatore di tendenza giornaliero che utilizza Price Action, Dynamic Support e Resistances. È progettato per essere utilizzato da chiunque, anche il principiante assoluto nel trading può usarlo. NON ridipinge MAI. Le indicazioni sono date da vicino a vicino. Progettato per essere utilizzato da solo, non sono necessari altri indicatori. Ti dà la tendenza e il potenziale Take Profit all'inizio della giornata. Come funziona DTS utilizza una strategia di
EARLY REMINDER: The Starting price is 65 price will rise soon up to 365$ and then 750$ after first 10 copies of sales. Grab this offer now! Introduction Hello, traders! Welcome to the demonstration of the Forex Beast Indicator , a comprehensive tool designed to assist aspiring traders in navigating the complexities of the forex market. This indicator incorporates seven essential components to provide a well-rounded trading experience: Moving Averages Colored Zones Support and Resistance Levels
PZ Trend Trading
PZ TRADING SLU
4.8 (5)
Capture every opportunity: your go-to indicator for profitable trend trading Trend Trading is an indicator designed to profit as much as possible from trends taking place in the market, by timing pullbacks and breakouts. It finds trading opportunities by analyzing what the price is doing during established trends. [ Installation Guide | Update Guide | Troubleshooting | FAQ | All Products ] Trade financial markets with confidence and efficiency Profit from established trends without getting whip
PZ Mean Reversion MT4
PZ TRADING SLU
3 (4)
Indicatore unico che implementa un approccio professionale e quantitativo al trading di reversione. Sfrutta il fatto che il prezzo devia e ritorna alla media in modo prevedibile e misurabile, il che consente regole di entrata e uscita chiare che superano di gran lunga le strategie di trading non quantitative. [ Installation Guide | Update Guide | Troubleshooting | FAQ | All Products ] Segnali di trading chiari Incredibilmente facile da scambiare Colori e dimensioni personalizzabili Implementa l
Chart Patterns Detect 15 patterns (Ascending Triangle, Descending Triangle, Rising Wedge, Falling Wedge, Bullish Flag, Bearish Flag, Bullish Rectangle, Bearish Rectangle Symmetrical triangle, Head and Shoulders, Inverted Head and Shoulders, Triple top, Triple Bottom, Double Top, Double Bottom) Use historical data to calculate the probability of each pattern to succeed (possibility to filter notification according to the chance of success) gives graphic indication about the invalidation level and
QuantumEdge Trader
Hossam Ali Ahmed Ali
QuantumEdge Trader v1.0 AI-Powered Precision Signals for Serious Traders QuantumEdge Trader is a smart and reliable indicator that delivers accurate BUY and SELL signals using advanced market analysis and trend detection. Designed for M1 to M60 timeframes, it's ideal for scalping and intraday strategies. --- Key Features: No Repaint – Signals never change after appearing Smart trend filters to reduce noise Adjustable sensitivity and alerts Perfect for XAUUSD, EURUSD, and m
VR Cub
Vladimir Pastushak
VR Cub è un indicatore per ottenere punti di ingresso di alta qualità. L'indicatore è stato sviluppato per facilitare i calcoli matematici e semplificare la ricerca dei punti di ingresso in una posizione. La strategia di trading per la quale è stato scritto l'indicatore ha dimostrato la sua efficacia per molti anni. La semplicità della strategia di trading è il suo grande vantaggio, che consente anche ai trader alle prime armi di commerciare con successo con essa. VR Cub calcola i punti di apert
Blahtech Market Profile
Blahtech Limited
4.53 (15)
Was: $249  Now: $99   Market Profile defines a number of day types that can help the trader to determine market behaviour. A key feature is the Value Area, representing the range of price action where 70% of trading took place. Understanding the Value Area can give traders valuable insight into market direction and establish the higher odds trade. It is an excellent addition to any system you may be using. Blahtech Limited presents their Market Profile indicator for the MetaTrader community. Ins
This is a new strategy for SUPPLY DEMAND areas It is based on a calculation using the tick volume to detect the big price action in market for both bear /bull actions this smart volume action candles are used to determine the supply and demand areas prices in between main supply and demand lines indicate sideway market  up arrows will be shown when prices moves above the main supply and the secondary supply lines Down arrows will be shown when prices moves below the main demand and the secondary
ACB Breakout Arrows
KEENBASE SOFTWARE SOLUTIONS
4.15 (34)
L’indicatore ACB Breakout Arrows fornisce un segnale di ingresso cruciale rilevando uno specifico pattern di breakout. Monitora costantemente il grafico alla ricerca di un momentum stabile in una direzione e segnala con precisione l’ingresso poco prima del movimento principale.  Ottieni lo scanner multi-simbolo e multi-timeframe qui - Scanner per ACB Breakout Arrows MT4 Caratteristiche principali Lo Stop Loss e il Take Profit sono calcolati automaticamente dall'indicatore. Include una dashboard
Gartley Projection D
Oleksandr Medviediev
3.71 (7)
The indicator identifies the harmonic patterns (XABCD) according to developments of H.M.Gartley ( "Profits in the Stock Market" , 1935г). It projects D-point as a point in the perspective projection (specify ProjectionD_Mode = true in the settings). Does not redraw. When a bar of the working timeframe closes, if the identified pattern point has not moved during Patterns_Fractal_Bars bars, an arrow appears on the chart (in the direction of the expected price movement). From this moment on, the ar
This indicator is designed for scalping on low timeframes (M1-M15) in volatile markets like major forex pairs (e.g., EURUSD, GBPUSD). It generates non-repainting buy (green up arrow) and sell (red down arrow) signals based on EMA crossover confirmed by RSI momentum and MACD crossovers, minimizing false signals in ranging markets. How to Use: Attach the indicator to your MT4 chart. Look for arrows on the chart: Buy on green up arrow, Sell on red down arrow. Signals appear at the open of the new
The main idea of this indicator is rates analysis and prediction by Fourier transform. Indicator decomposes exchange rates into main harmonics and calculates their product in future. You may use the indicator as a standalone product, but for better prediction accuracy there is another related indicator - FreqoMaster - which uses FreqoMeterForecast as a backend engine and combines several instances of FreqoMeterForecast for different frequency bands. Parameters: iPeriod - number of bars in the ma
Happy Scalping Indicator
Leandro Bernardez Camero
Questo indicatore è stato progettato per uno scalping aggressivo e per entrate rapide nelle opzioni binarie , generando segnali su ogni candela in modo da sapere esattamente cosa sta succedendo in ogni momento. Unisciti al canale Happy Scalping: MQL5 Non ripinta : il segnale della candela attuale viene generato in tempo reale , il che significa che può cambiare mentre la candela è ancora in formazione, a seconda che il prezzo salga o scenda rispetto alla chiusura della candela precedente. Tutt
This is an arrow indicator without a future function,developed based on the most advanced profit trading algorithms.It has the most innovative and advanced dual trend analysis module, as well as the latest and highly effective market trend prediction algorithm.Trends are your friends, and following larger trends can earn the maximum profit in foreign exchange. This indicator helps traders identify current trends and track them. Someone once made a profit of 10 times in a week by relying on it.No
Auto Fibo Pro m
DMITRII GRIDASOV
Indicatore "Auto FIBO Pro" Crypto_Forex: è un ottimo strumento ausiliario nel trading! - L'indicatore calcola e posiziona automaticamente sul grafico i livelli di Fibo e le linee di tendenza locali (colore rosso). - I livelli di Fibonacci indicano le aree chiave in cui il prezzo può invertirsi. - I livelli più importanti sono 23,6%, 38,2%, 50% e 61,8%. - Puoi usarlo per lo scalping di inversione o per il trading di zone grid. - Ci sono molte opportunità per migliorare il tuo sistema attuale us
This is the complete REX package. It consists of the lite, pro and ULTRA version.  Perfect for beginners and intermediates. REX complete is 100% non repaint. The strategy is based on a mix of different strategies, statistics, including pivot points, oscillators and patterns.  As the trading idea consists of a variety of some classic indicators like Momentum, Williams Percent Range, CCI, Force Index, WPR, DeMarker, CCI, RSI and Stochastic, it is clear that the fundamental indicators have being u
Gli utenti di questo prodotto hanno anche acquistato
FFx Engulfing Setup Alerter gives trade suggestions with Entry, Target 1, Target 2 and StopLoss. Below are the different options available: Entry suggestion - pips to be added over the break for the entry 3 different options to calculate the SL - by pips, by ATR multiplier or at the pattern High/Low 3 different options to calculate the 2 TPs - by pips, by ATR multiplier or at Risk/Reward Offset the dashboard - any place on the chart Remove the suggestion once the price reached the SL line Lines
FFx InsideBar Setup Alerter gives trade suggestions with Entry, Target 1, Target 2 and StopLoss. Below are the different options available: Entry suggestion - pips to be added over the break for the entry Minimum candle size - to avoid too close buy/sell entry suggestions 3 different options to calculate the SL - by pips, by ATR multiplier or at the pattern High/Low 3 different options to calculate the 2 TPs - by pips, by ATR multiplier or at Risk/Reward Offset the dashboard - any place on the c
FFx OutsideBar Setup Alerter gives trade suggestions with Entry, Target 1, Target 2 and StopLoss. Below are the different options available: Entry suggestion - pips to be added over the break for the entry. 3 different options to calculate the SL - by pips, by ATR multiplier or at the pattern High/Low. 3 different options to calculate the 2 TPs - by pips, by ATR multiplier or at Risk/Reward. Offset the dashboard - any place on the chart. Remove the suggestion once the price reached the SL line.
FFx PinBar Setup Alerter gives trade suggestions with Entry, Target 1, Target 2 and StopLoss. Below are the different options available: Entry suggestion - pips to be added over the break for the entry Minimum candle size - to avoid too small candles 3 different options to calculate the SL - by pips, by ATR multiplier or at the pattern High/Low 3 different options to calculate the 2 TPs - by pips, by ATR multiplier or at Risk/Reward Offset the dashboard - any place on the chart Remove the sugges
The purpose of this new version of the MT4 standard indicator provided in your platform is to display in a sub-window multiple timeframes of the same indicator with its divergences. See the example shown in the picture below. But the display isn't like a simple MTF indicator. This is the real display of the indicator on its timeframe. Here's the options available in the FFx divergences indicator: Select the timeframes to be displayed (M1 to Monthly) Define the width (number of bars) for each tim
The purpose of this new version of the MT4 standard indicator provided in your platform is to display in a sub-window multiple timeframes of the same indicator with its divergences. See the example shown in the picture below. But the display isn't like a simple MTF indicator. This is the real display of the indicator on its timeframe. Here's the options available in the FFx divergences indicator: Select the timeframes to be displayed (M1 to Monthly). Define the width (number of bars) for each ti
The FFx Dashboard MTF alerter will show you on a single chart all the timeframes (M1 to Monthly) with their own status for the indicator. 2 Alert Options: Single timeframe: each selected timeframe alert separately when a signal occurs Multi timeframes: all selected timeframes must agree for an alert to be triggered Both options have an input to select the timeframes to be used for the alert(s). How to Understand the Status: Green/Red square: histogram above/below 0 line Green square + Red bord
The FFx Dashboard MTF alerter will show you on a single chart all the timeframes (M1 to Monthly) with their own status for the indicator. 2 Alert Options: Single timeframe: each selected timeframe alert separately when a signal occurs Multi timeframes: all selected timeframes must agree for an alert to be triggered Both options have an input to select the timeframes to be used for the alert(s). How to understand the status: Green/Red square: RSI above/below 50 line Green square + Red border: R
The FFx Dashboard MTF alerter will show you on a single chart all the timeframes (M1 to Monthly) with their own status for the indicator. 2 Alert Options: Single timeframe: each selected timeframe alert separately when a signal occurs Multi timeframes: all selected timeframes must agree for an alert to be triggered Both options have an input to select the timeframes to be used for the alert(s). How to understand the status: Green/Red square: Stoch above/below 50 line Green square + Red border:
The FFx Dashboard MTF alerter will show you on a single chart all the timeframes (M1 to Monthly) with their own status for the indicator. 2 Alert Options: Single timeframe: each selected timeframe alert separately when a signal occurs Multi timeframes: all selected timeframes must agree for an alert to be triggered Both options have an input to select the timeframes to be used for the alert(s). How to understand the status: Green/Red square: Price above/below Cloud (Kumo) Green square + Red bo
The FFx Dashboard MTF alerter will show you on a single chart all the timeframes (M1 to Monthly) with their own status for the indicator. 2 Alert Options: Single timeframe: each selected timeframe alert separately when a signal occurs Multi timeframes: all selected timeframes must agree for an alert to be triggered Both options have an input to select the timeframes to be used for the alert(s). How to understand the status: Green/Red square: MA pointing Up/Down Green square + Red border: MA po
The FFx Dashboard MTF alerter will show you on a single chart all the timeframes (M1 to Monthly) with their own status for the indicator. 2 Alert Options: Single timeframe: each selected timeframe alert separately when a signal occurs. Multi timeframes: all selected timeframes must agree for an alert to be triggered. Both options have an input to select the timeframes to be used for the alert(s). How to understand the status: Green square: Price above PSAR Red square: Price below PSAR Options
The FFx Dashboard MTF alerter will show you on a single chart all the timeframes (M1 to Monthly) with their own status for the indicator. 2 Alert Options: Single timeframe: each selected timeframe alert separately when a signal occurs Multi timeframes: all selected timeframes must agree for an alert to be triggered Both options have an input to select the timeframes to be used for the alert(s). How to understand the status: Green/Red square: CCI above/below levels (ie. 100/-100) Grey square: C
The FFx Dashboard MTF alerter will show you on a single chart all the timeframes (M1 to Monthly) with their own status for the indicator. 2 Alert Options: Single timeframe: each selected timeframe alert separately when a signal occurs Multi timeframes: all selected timeframes must agree for an alert to be triggered Both options have an input to select the timeframes to be used for the alert(s). How to understand the status: Green/Red square: ADX above level Grey square: ADX below level Red bor
The FFx Dashboard MTF alerter will show you on a single chart all the timeframes (M1 to Monthly) with their own status. 2 Alert Options: Single timeframe: each selected timeframe alert separately when a signal occurs Multi timeframes: all selected timeframes must agree for an alert to be triggered Both options have an input to select the timeframes to be used for the alert(s). How to understand the status: Green/Red square: bullish/bearish candle Options available in the FFx Dashboard Alerter
The [GRAFF] III manual trading system is based on multiple MetaTrader (MT4) indicators. Together, the entire PACK of GRAFF III indicators makes an advanced trading tool. The system consists of over 20 different custom-built indicators which have been carefully selected and tested in the long term to produce strong and efficient trading signals. The particular indicators are based on different mathematical formulas, so the entire system is calibrated to remove false signals from its own indicator
FFx Universal Strength Meter PRO is more than a basic strength meter. Instead of limiting the calculation to price, it can be based on any of the 19 integrated strength modes + 9 timeframes. With the FFx USM, you are able to define any period for any combination of timeframes. For example, you can set the dashboard for the last 10 candles for M15-H1-H4… Full flexibility! Very easy to interpret... It gives a great idea about which currency is weak and which is strong, so you can find the best pai
FFx Basket Scanner
Eric Venturi-Bloxs
MetaTrader 5 version available here : https://www.mql5.com/en/market/product/24882 FFx Basket Scanner is a global tool scanning all pairs and all timeframes over up to five indicators among the 16 available. You will clearly see which currencies to avoid trading and which ones to focus on. Once a currency goes into an extreme zone (e.g. 20/80%), you can trade the whole basket with great confidence. Another way to use it is to look at two currencies (weak vs strong) to find the best single pairs
MetaTrader 5 version available here: https://www.mql5.com/en/market/product/25794 FFx Pivot SR Suite PRO is a complete suite for support and resistance levels. Support and Resistance are the most used levels in all kinds of trading. Can be used to find reversal trend, to set targets and stop, etc. The indicator is fully flexible directly from the chart 4 periods to choose for the calculation: 4Hours, Daily, Weekly and Monthly 4 formulas to choose for the calculation: Classic, Camarilla, Fibonac
Let´s try to make some real money! Call me profit addicted. I thought why not try to make THE dream come reality. With discipline, a clear strategy and this indicator I focus on entering the perfect trades. This indicator is very easy to use as you will get perfect entry points for Put or Call trades. The arrows are calculated with: -     Momentum  parameters -     Candle stick patterns -     Fundamental Price action We recommend to combine it with Parabolic, ZigZag or Elliot waves indicator
Golden Chip
Daishon Cotman
Golden Chip provides Basic Market Structure, Fibonacci, supply and Demand Zones. Letting you identify when a sell off point is approaching or whne a buy opportunity is arriving. The awesome thing about Golden Chip is that, you will see rejection levels or continuation before ANYBODY ! This indicator moves directly with price and lines up perfectly with the Chart. Some indicators would lag but NOT this one ! Golden Chip is amazing for Clean chart (Naked Chart). GOLDEN CHIP IS ONLY ON METATRADER (
***** The REAL , ORIGINAL, Non-Repainting, Non-Delaying, Arrow Trade Entry indicator for Very Low-Risk market execution ***** ***This is the Golden standard in arrow indicators for MT4.*** BING Setup Arrows Indicator(BSA) will show easy-to-read High Probability trading situations with Non-Repainting , Non-Delaying , Up or Down arrows on the graph.  So simple, it's brilliant. Always shows very good trading setups, no flashy colors, confusing configurations, hard-to-read dashboards, etc.  Perfec
****** Easy to understand, correct Trade direction indicator, quick and easy to visualize******* BING Proper Path Indicator(BPP) will show BUY/SELL signals on-screen in an easy-to-understand 'Traffic Light' format. Provides a final 'reassurance' and 'peace of mind' for taking an educated, high probability, low-risk, trade decision. In the same way, you use a rearview mirror for instantaneous information while taking a driving decision, the same way BING Proper Path Indicator(BPP) will help you
Risk Reward ratio indicator for MT4  BING Risk Reward indicator is a powerful, basic, very needed tool for every trader. Clearly visualize Open Price , Stop Loss , and Top Profit levels on your graphs with easy-to-see colors and trendlines. Does BING Risk Reward show alerts? Of course! BING Risk Reward Indicator offers all Alerts available for the MT4 platform(Email, Popups, Sound, and Push). It shows alerts on Open Price , Stop Loss , and Top Profit. That way, besides easily seeing what is go
The channels
Mansour Rahkhofteh
Counter trade type indicator. Jcounter can capture the timing of the trend collapse phase. There are signs of a trend collapse. It is the world standard to confirm the sign with LSMA adopted by Jcounter. The numerical setting of LSMA is very important, but after many years of verification, the numerical value was identified and completed. When the trend starts, the rising market moves like a support, and the falling market moves like a resistance. Gradually overtake the candlestick and
Axebagsh
Batsukh Sumchin Khuyagbaatar
Only work on Crude Oil H1  time frame  Swing follow trend.  do not trade against trends Specifies the first destination and entry and exit points For 16 years, I only traded on CrudeOil. Crude oil is one of the most extreme combinations in the world and it is safe to say that such a good indicator has never been made before.   This indicator will save you a lot of money because it introduces a new type of approach, Good luck
Forex Signal Generator is a cutting edge technology for Trend Trading, and filtering all inbuilt in one tool. The Signal Generator  analysis the market like a Pro  by using its smart algorithms to detect  the trend, filter out market noise  and display on  your chart with the : ENTRY, STOPLOSS AND TARGET PROFIT Advantages You Get     Access to the proven reliable trend indicator based     Easy and  effective trend detection.     Gives you the ability to filter  out  'NOISE' from the market  
Altri dall’autore
NEXT price Actions - Daily Pivots 1. Auto Mapping Projection Price Action XAUUSD to get the most accurate setup for each Entry Lines. 2. The tool used has been customized according to Swap Pivots setup. 3. The setup that results after Mapping is suitable for Intraday 4. This setup does not need a marking and depends on SNR & SND. 5. This setup only depends 100% on the tool used. 6. This setup is very suitable for getting an Entry in a shadow candle stick. 7. This setup will also follow th
NEXT price Actions - Order Manager This EA have multiple Order Managements that can be used with FliPA Indicators have a look at Screenshots for more clear understanding of it use. It also includes the Auto BreakEven, Auto BreakEven Trailing, TakeProfit, and StopLoss. All this functionality is Customizable at the EA Setting Parameters. All or order managements can also be adjusted directly at the chart.
The BBMA Dashboard Professional v2.5 is a BBMA trading assistant that shows signals, trend, and ready‑made trade levels (Entry, SL, TP1, TP2) on one screen for many pairs at once. Below is a simplified, easy‑to‑read version in points.   Main Purpose - Shows BBMA signals (EXT, MHV, CSAK, MOM, RE) in a dashboard and on the chart.   - Helps you see trend, signal direction, and trade levels without manual calculation.   - Designed for multi‑pair, multi‑timeframe BBMA trading.   Key Features - M
Fibonacci BB Breakout Indicator is a powerful MT4 tool that automatically detects Bollinger Bands breakouts and draws Fibonacci extension levels as trend lines on your chart. It simplifies trading by highlighting potential support, resistance, and target zones after strong moves, with customizable alerts and an info panel for quick status checks.  Key Features - Automatic Breakout Detection: Spots bullish (price closes above upper BB) or bearish (below lower BB) breakouts on the previous close
Filtro:
Nessuna recensione
Rispondi alla recensione