Visual Dynamic Range Analyzer Indicator
- Indicatori
-
AL MOOSAWI ABDULLAH JAFFER BAQER
 To trade successfully we need to go through the proven path that others had gone and reached!
Here are 17 quotes from such successful investors:
1- Limit your size in any position so that fear does not become the prevailing instinct guiding your judgment.
Joe Vidich - Versione: 1.0
- Attivazioni: 5
| • Please test the product in the Strategy Tester before purchasing to understand how it works. • If you face any issues, contact me via private message—I’m always available to help. • After purchase, send me a screenshot of your order to receive a FREE EA as a gift. |
|---|
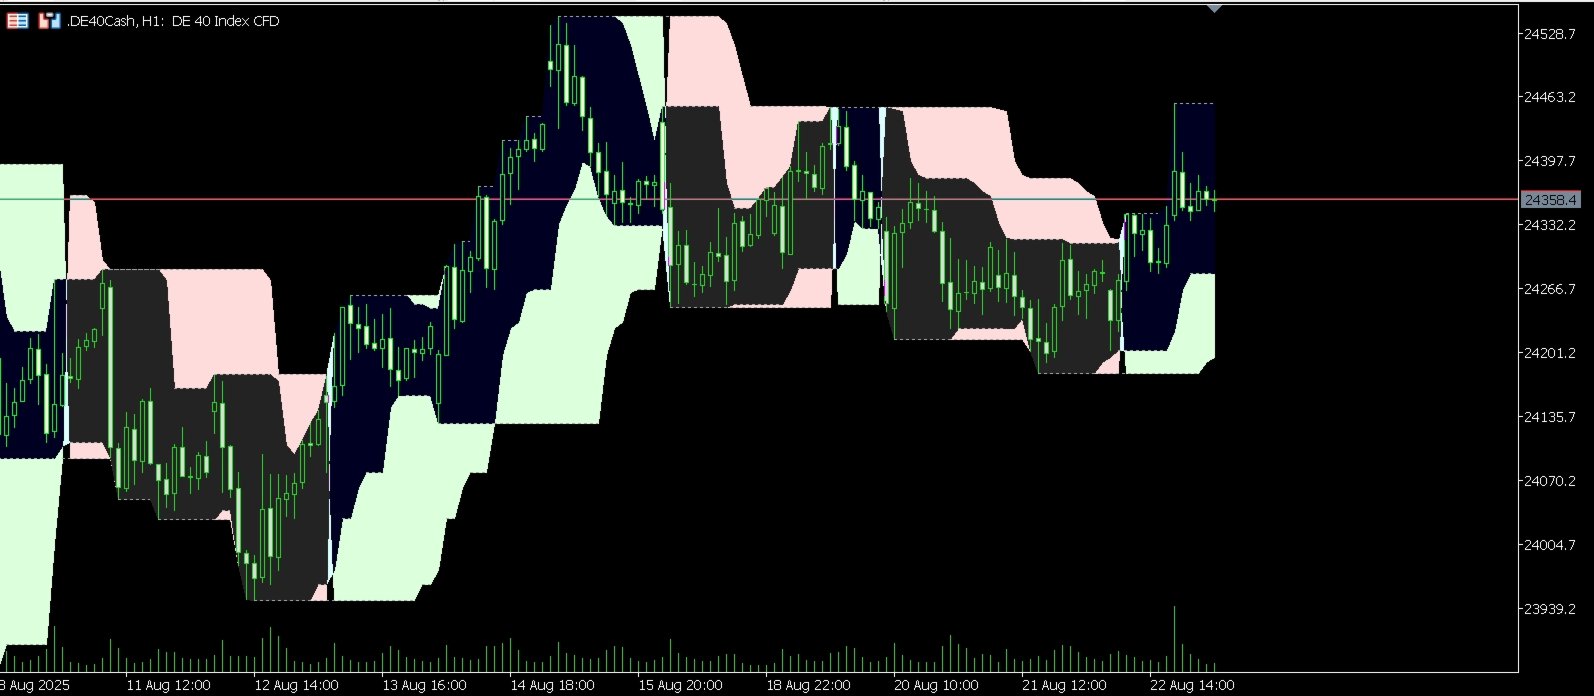
Are you tired of struggling with choppy markets and false signals? Do you find it difficult to identify the true trend direction amidst constant market noise? The Visual Dynamic Range Analyzer is the definitive tool designed to bring clarity and confidence to your trading, transforming complex market dynamics into simple, actionable visual signals. For just $30, this powerful indicator for MetaTrader 5 will become an indispensable part of your trading arsenal.
The Core Logic: A Sophisticated Dual-Range System
The Visual Dynamic Range Analyzer is not just another trend indicator. It is built upon a sophisticated and robust logic that intelligently analyzes market volatility and price action to reveal the true underlying trend.
At its core, the indicator utilizes a dual-range system:
-
Primary Range (Slow Period): This is the foundation of the trend analysis. It calculates a dynamic support and resistance range based on a longer user-defined period (e.g., 21 periods). This primary range acts as the main filter for the market, establishing the dominant, long-term trend direction. When the primary range is expanding upwards, the market is in a clear uptrend. When it's expanding downwards, it signals a downtrend. This is visually represented by distinct colored zones on your chart, so you can see the trend at a single glance.
-
Secondary Range (Fast Period): This range is calculated using a shorter period (e.g., 8 periods) and is more sensitive to recent price action. It identifies the short-term, dynamic support and resistance levels within the context of the primary trend. It is the breakout of this secondary range that generates the actual trading signals.
By combining these two ranges, the indicator achieves a powerful synergy. The primary range ensures you are always trading in the direction of the dominant market force, while the secondary range provides precise entry points based on confirmed breakouts. This dual-layer analysis is exceptionally effective at filtering out the noise and whipsaws that plague most standard indicators.
How Signals Are Generated
Trading signals are generated with precision and reliability, based on a clear set of rules that confirm both momentum and trend alignment:
-
A Buy Signal is generated when:
-
The primary (slow) range confirms a bullish trend (the green zone is expanding).
-
The price closes decisively above the high of the secondary (fast) range.
This confluence of events indicates that not only is the underlying trend bullish, but short-term momentum has also broken to the upside, providing a high-probability entry point.
-
-
A Sell Signal is generated when:
-
The primary (slow) range confirms a bearish trend (the red zone is expanding).
-
The price closes decisively below the low of the secondary (fast) range.
This signals that the dominant trend is down, and the immediate price action has confirmed a bearish breakdown, offering a strong opportunity to enter a short position.
-
Key Features
-
Crystal Clear Visual Interface: The indicator plots everything you need directly on your chart. The color-filled zones for the primary trend and the dotted lines for the secondary range make it incredibly easy to understand the market structure instantly.
-
High-Probability Buy & Sell Arrows: Non-repainting arrows appear on your chart to pinpoint the exact bar where entry conditions are met. No more guesswork.
-
Built-in Signal Filter: To prevent over-trading in volatile conditions, the indicator includes an optional "Bars Delay" feature. This allows you to set a minimum number of bars that must pass before a new signal can be generated, ensuring you only take the highest quality setups.
-
Fully Customizable Settings: Tailor the indicator to your exact needs. You can adjust the periods for both the fast and slow ranges, change the colors of the signals and zones, and modify the size of the arrows.
-
Comprehensive Logging: For advanced traders and strategists, the indicator includes a detailed logging feature to track every signal and decision, which can be invaluable for backtesting and optimizing your approach.
How to Trade with the Visual Dynamic Range Analyzer
Buy Setup:
-
Identify the Trend: Wait for the primary range to establish a clear uptrend, indicated by the green fill zone on your chart.
-
Wait for the Signal: Look for a green "Buy" arrow to appear. This confirms that the price has broken above the short-term secondary range in the direction of the main trend.
-
Confirm and Enter: Enter a long position at the open of the next bar. Place your stop loss below a recent swing low or below the primary range low for a more conservative approach.
Sell Setup:
-
Identify the Trend: Wait for the primary range to establish a clear downtrend, indicated by the red fill zone.
-
Wait for the Signal: Look for a red "Sell" arrow to appear, signaling a price break below the secondary range.
-
Confirm and Enter: Enter a short position at the open of the next bar. Place your stop loss above a recent swing high or the primary range high.
Full List of Customizable Inputs
-
Range Analysis Settings:
-
InpFastRangePeriod : Sets the lookback period for the secondary (fast) range.
-
InpSlowRangePeriod : Sets the lookback period for the primary (slow) range, which defines the main trend.
-
InpSignalOffset : Adjusts how far the arrow is placed from the price bar (in points).
-
-
Signal Controls:
-
InpUseBarDelay : Enable or disable the signal frequency filter.
-
InpBarsDelay : Define the minimum number of bars to wait between generating new signals.
-
-
Visual Settings:
-
InpShowVisualElements : Toggle the visibility of all graphical elements.
-
InpBuySignalColor : Choose your preferred color for buy signals.
-
InpSellSignalColor : Choose your preferred color for sell signals.
-
InpArrowSize : Set the size of the trade signal arrows (1-5).
-
-
Logging Settings:
-
InpShowLogs : Enable or disable detailed logging in the journal.
-
InpLogToFile : Choose to save logs to a file for later analysis.
-
InpLogFileName : Set a custom name for your log file.
-
InpMaxLogSizeMB : Manage the maximum size of the log file.
-
Your Investment in Smarter Trading
For a one-time payment of just $30, the Visual Dynamic Range Analyzer provides a level of clarity and analytical depth that can fundamentally improve your trading decisions. Stop letting market noise dictate your trades and start trading with the confidence that comes from understanding the true trend. Add this essential tool to your collection today and take the first step towards more consistent, intelligent trading.