TrendWave Bands

TrendWave Bands Indicator

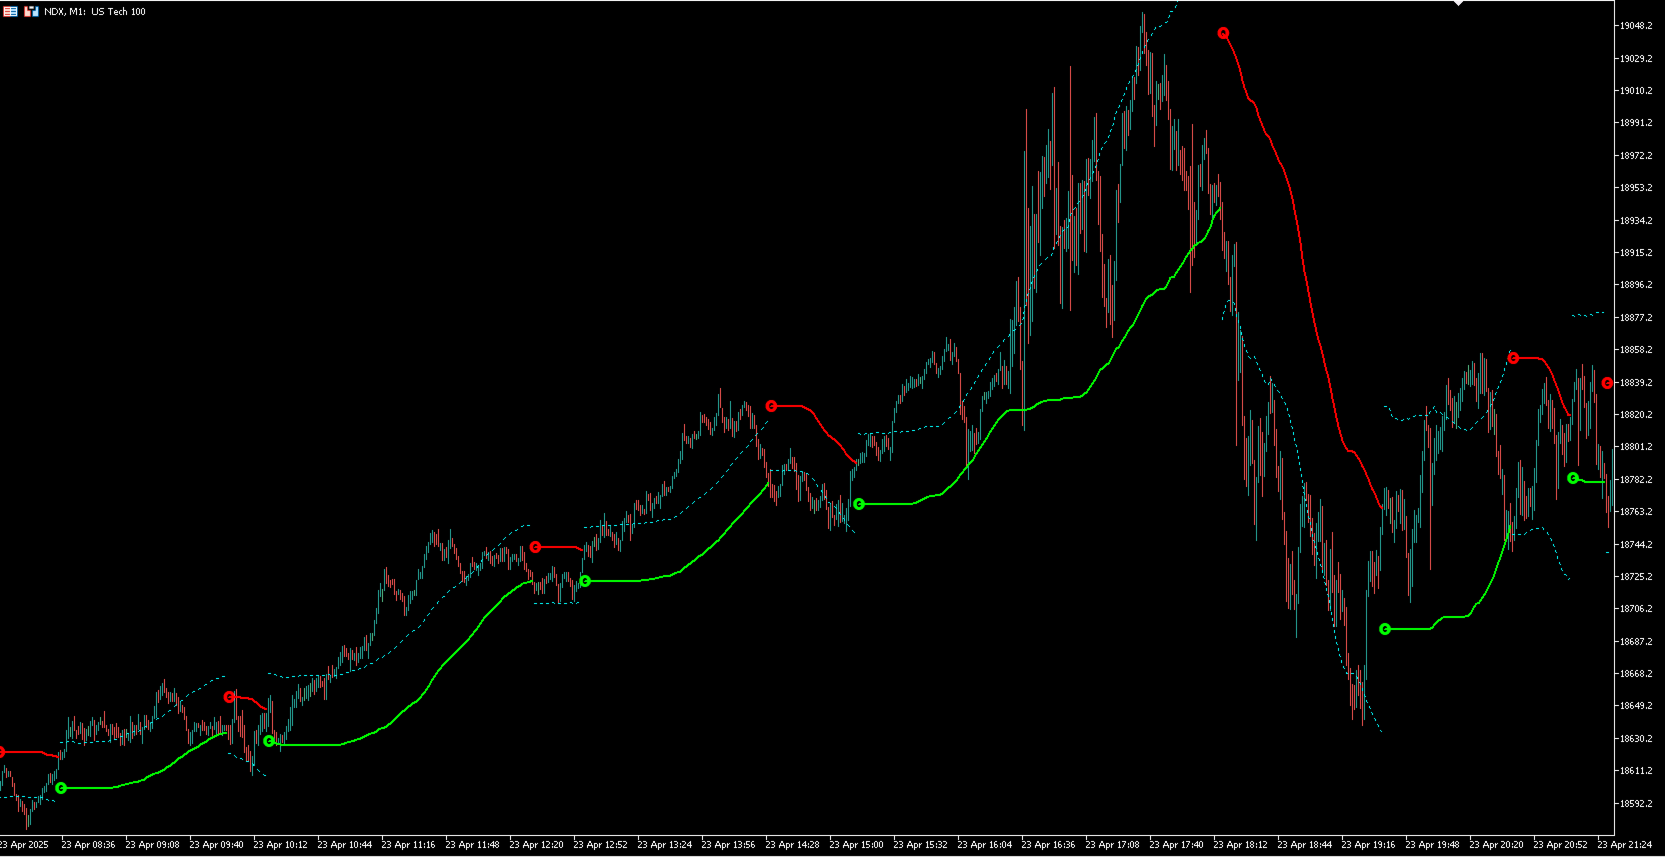
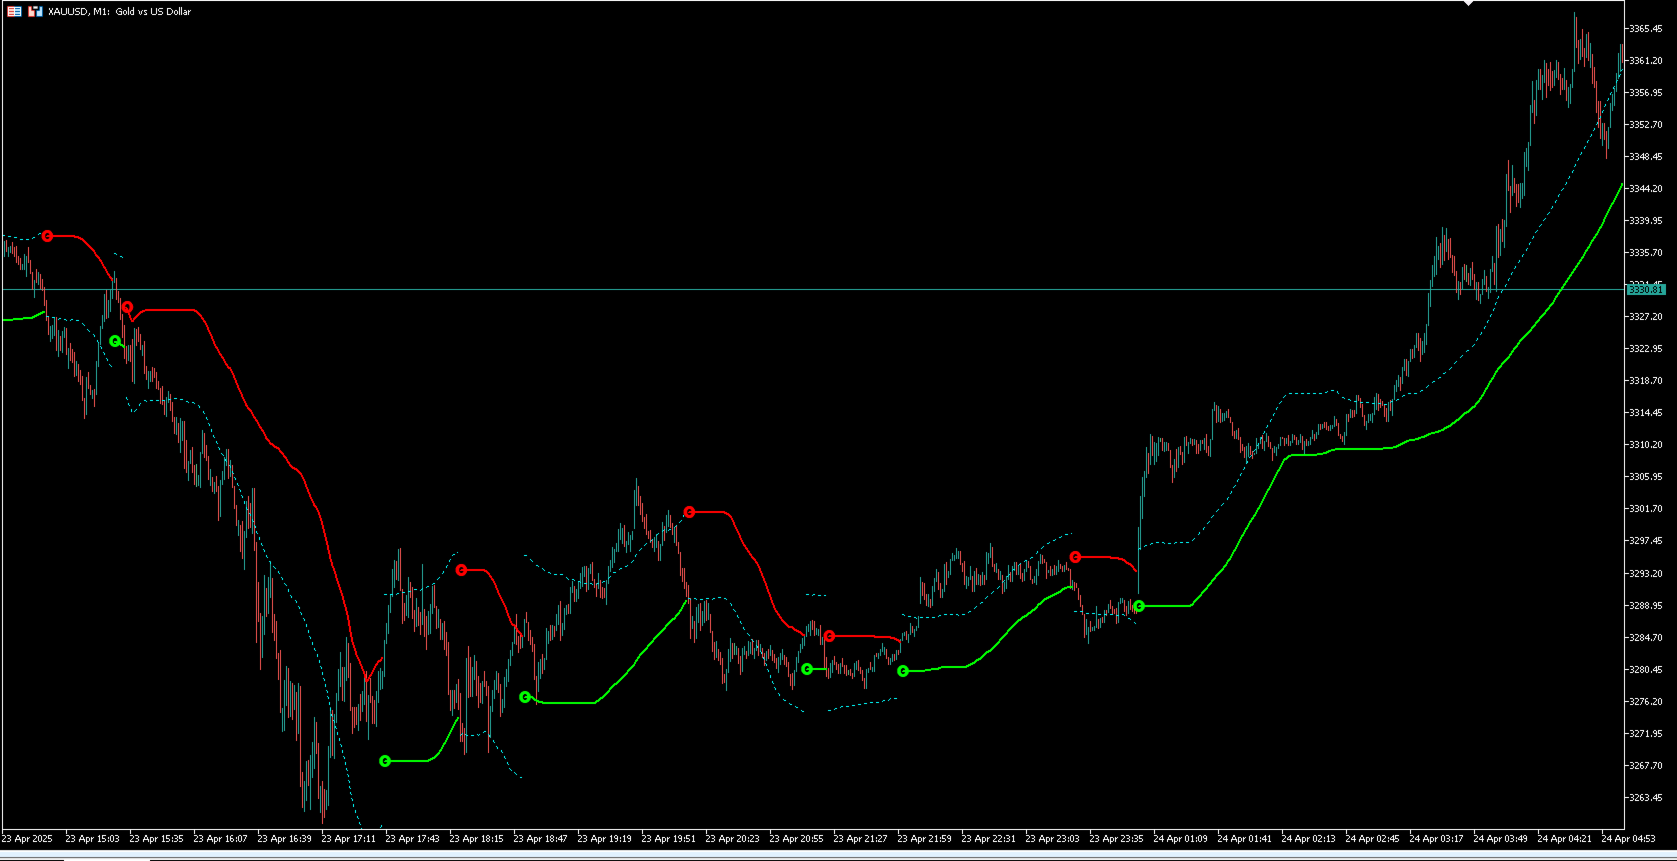
This is a trend-tracking tool, originally by BigBeluga on TradingView, designed to adjust automatically to current market movements using upper and lower dynamic bands. It uses primary waves to view the strength and persistence of a trend, and includes secondary wave bands to assist with deeper analysis.

Main Features:

Smart Adaptive Bands

  • In uptrends, a dynamic lower band is displayed, while in downtrends, an upper band appears.

  • These serve as moving zones of support or resistance, offering insights into potential trade setups.

Wave Bands for Momentum Insight:

  • A secondary, dashed band appears on the opposite side of the trend to give further confirmation.

  • In bullish trends, this band appears above price action, while in bearish phases, it forms below.

Reversal Markers:

  • Circular signals mark key turning points in the trend, helping identify when momentum is shifting.

  • These act as cues for possible entries or exits, highlighting when the market may be changing direction.

How to Use It:

  • Ride the Trend: Use the active trend band (lower in uptrends, upper in downtrends) to stay aligned with momentum.

  • Spot Reversals: Look for circular markers to flag potential changes in direction.

  • Adapt to Volatility: The spacing and shape of the bands adjust with market volatility, offering a visual guide to adjust your strategy and risk

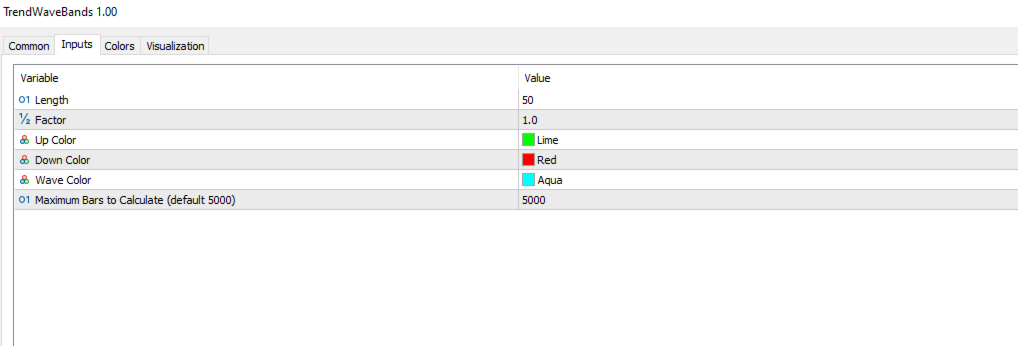
  • Increase the History: Increase the Max Bars in the settings (default 5000 bars) to view the indicator over longer periods


Prodotti consigliati
CosmiCLab SMC FIBO CosmiCLab SMC FIBO is a professional trading indicator designed for traders who use Smart Money Concepts (SMC), market structure analysis and Fibonacci retracement levels. The indicator automatically detects market swings and builds Fibonacci levels based on the latest impulse movement. It also identifies market structure changes such as BOS (Break of Structure) and CHOCH (Change of Character), helping traders understand the current market direction. CosmiCLab SMC FIBO also pr
RBreaker
Zhong Long Wu
RBreaker Gold Indicators is a short-term intraday trading strategy for gold futures that combines trend following and intraday reversal approaches. It not only captures profits during trending markets but also enables timely profit-taking and counter-trend trading during market reversals. This strategy has been ranked among the top ten most profitable trading strategies by the American magazine   Futures Truth   for 15 consecutive years. It boasts a long lifecycle and remains widely used and st
Noize Absorption Index - is the manual trading system that measures the difference of pressure between bears forces and bulls forces. Green line - is a noize free index that showing curent situation. Zero value of index shows totally choppy/flat market.Values above zero level shows how powerfull bullish wave is and values below zero measures bearish forces.Up arrow appears on bearish market when it's ready to reverse, dn arrow appears on weak bullish market, as a result of reverse expectation.
Overview Harmonic Patterns MT5 is a technical analysis indicator designed for the MetaTrader 5 platform. It identifies and displays harmonic price patterns, such as Butterfly, Cypher, Crab, Bat, Shark, and Gartley, in both bullish and bearish directions. The indicator calculates key price levels, including entry, stop loss, and three take-profit levels, to assist traders in analyzing market movements. Visual elements and customizable alerts enhance usability on the chart. Features Detects six ha
HMA Trend Professional MT5
Pavel Zamoshnikov
4.25 (4)
Improved version of the free HMA Trend indicator (for MetaTrader 4) with statistical analysis. HMA Trend is a trend indicator based on the Hull Moving Average (HMA) with two periods. HMA with a slow period identifies the trend, while HMA with a fast period determines the short-term movements and signals in the trend direction. The main differences from the free version: Ability to predict the probability of a trend reversal using analysis of history data. Plotting statistical charts for analyzi
Innanzitutto, vale la pena sottolineare che questo Strumento di Trading è un Indicatore Non-Ridipingente, Non-Ridisegnante e Non-Laggante, il che lo rende ideale per il trading professionale. Corso online, manuale utente e demo. L'Indicatore Smart Price Action Concepts è uno strumento molto potente sia per i nuovi che per i trader esperti. Racchiude più di 20 utili indicatori in uno solo, combinando idee di trading avanzate come l'Analisi del Trader del Circolo Interno e le Strategie di Tradin
Trade smarter, not harder: Empower your trading with Harmonacci Patterns This is arguably the most complete harmonic price formation auto-recognition indicator you can find for the MetaTrader Platform. It detects 19 different patterns, takes fibonacci projections as seriously as you do, displays the Potential Reversal Zone (PRZ) and finds suitable stop-loss and take-profit levels. [ Installation Guide | Update Guide | Troubleshooting | FAQ | All Products ] It detects 19 different harmonic pri
An indicator of pattern #31 ("Long Island") from Encyclopedia of Chart Patterns by Thomas N. Bulkowski. The second gap is in the opposite direction. Parameters: Alerts - show alert when an arrow appears   Push - send a push notification when an arrow appears (requires configuration in the terminal) GapSize - minimum gap size in points ArrowType - a symbol from 1 to 17 ArrowVShift - vertical shift of arrows in points   ShowLevels - show levels ColUp - color of an upward line ColDn - color of a d
Volality Index Scalper
Lesedi Oliver Seilane
5 (1)
Volality Index scalper indicator  Meant for Volality pairs such as Volality 10, 25, 50, 75 and 100 The indicator works on all timeframes from the 1 minute to the monthly timeframe the indicator is non repaint the indicator has 3 entry settings 1 color change on zero cross 2 color change on slope change 3 color change on signal line cross Orange line is your sell signal Blue line is your buy signal.
TRI Visualizer
Yoshimi Mon 三 Ura
TRI Visualizer MT5 – Thermodynamic Market Analysis Overview The TRI (Thermal Range Indicator) Visualizer Enhanced is a rare market analysis indicator that goes beyond conventional technical analysis, applying principles of thermodynamics from physics. It interprets market price fluctuations as “thermodynamic energy,” enabling the highly accurate detection of subtle market changes that are often overlooked. Innovative Mechanisms 1. Dual Calculation Engines Classic TRI Mode Formula: |Close
Episode Health Monitor Episode Health Monitor is a trading utility for MetaTrader 5 designed to analyze the real-time condition of active trading positions directly on the chart. The tool evaluates the current “trading episode” - a group of open positions - and provides a structured view of risk, stability, and distance to potential failure. Instead of relying only on profit/loss or price movement, it helps identify whether the current position is stable, weakening, or approaching a critical st
"Impulses and Corrections 5" is created to help traders navigate the market situation. The indicator shows multi-time frame upward and downward "Impulses" of price movements. These impulses are the basis for determining the "Base" , which is composed of zones of corrections of price movements, as well as "Potential" zones for possible scenarios of price movement. Up and down impulses are determined based on a modified formula of Bill Williams' "Fractals" indicator. The last impulse is always "U
L'indicatore mostra modelli armonici sul grafico   senza ridipingere   con il minimo ritardo possibile. La ricerca dei massimi degli indicatori si basa sul principio dell'onda dell'analisi dei prezzi. Le impostazioni avanzate ti consentono di scegliere i parametri per il tuo stile di trading. All'apertura di una candela (bar), quando si forma un nuovo pattern, viene fissata una freccia della probabile direzione del movimento del prezzo, che rimane invariata. L'indicatore riconosce i seguenti mod
DAILY OH/OL SDEV QUANT MODEL - STATISTICAL TRADING WITH PRECISION RISK MANAGEMENT TRADE WITH MATHEMATICAL CERTAINTY - KNOW YOUR EXACT STOP-LOSS AND TAKE-PROFIT BEFORE YOU ENTER This indicator analyzes 5,000+ days of price history to give you: Exact entry levels (sigma bands locked at daily open) Exact stop-loss distance (from M
Volume Profile V6
Andrey Kolesnik
4.67 (3)
Indicatore del profilo di volume del mercato + oscillatore intelligente. Funziona su quasi tutti gli strumenti: coppie di valute, azioni, futures, criptovalute, sia su volumi reali che su tick. È possibile impostare la definizione automatica dell'intervallo di costruzione del profilo (ad esempio, per una settimana o un mese, ecc.), oppure impostare l'intervallo manualmente spostando i confini (due linee verticali: rossa e blu). Viene visualizzato sotto forma di istogramma. La larghezza dell'isto
STRICTLY FOR BOOM INDEX ONLY!!!!! Here I bring the Maximum Trend Arrows OT1.0 MT5 indicator. This indicator is made up of a combination of different trend indicators for entries and exits, for entries an orange arrow will paint on the chart below the current market and a red flag for closing of trades and it produces buy arrows only. When the orange arrow appears, it will appear along with it's sound to notify you. The 1H timeframe is recommended, don't use it anywhere else than on the 1H timefr
Your Trend Friend
Luigi Nunes Labigalini
5 (1)
The trend is your friend! Look at the color of the indicator and trade on that direction. It does not  repaint. After each candle is closed, that's the color of the trend. You can focus on shorter faster trends or major trends, just test what's most suitable for the symbol and timeframe you trade. Simply change the "Length" parameter and the indicator will automatically adapt. You can also change the color, thickness and style of the lines. Download and give it a try! There are big movements w
Visual CrossPulse Dynamics Indicator
AL MOOSAWI ABDULLAH JAFFER BAQER
Visual CrossPulse Dynamics: Trade with the Market's True Rhythm Unlock a new level of market insight with Visual CrossPulse Dynamics, a sophisticated trading indicator designed to adapt to ever-changing volatility and reveal the true direction of the trend. Are you tired of indicators that lag in fast-moving markets or give false signals during consolidation? The Visual CrossPulse Dynamics indicator solves this problem by using an advanced, adaptive algorithm that intelligently adjusts to the m
Candle hunter
Ruslan Khasanov
5 (1)
Indicatore per analisi grafica. Segna i principali modelli di candele giapponesi sul grafico. Al momento, il trader ha a disposizione la seguente serie di modelli:  - Bearish/Bullish Abandoned Baby;  - Bearish Advance Block;  - Bearish Deliberation;  - Bearish/Bullish Belt Hold;  - Bearish/Bullish Engulfing;  - Bearish Shooting Star;  - Bearish Evening Star;  - Bearish Evening Doji Star;  - Bearish/Bullish Doji Star;    - Bearish/Bullish Tri-Star;  - Bearish Hanging Man;  - Bearish/Bullish Hara
Aura Smc Quantum H4
Chaibadee Dechtanankul
AURA SMC QUANTUM V1.01 code in English, structured for a professional presentation or MQL5 Market description: AURA SMC QUANTUM V1.01 | Logic Breakdown The Aura SMC Quantum is an advanced automated trading system (EA) specifically engineered for Gold (XAUUSD) on the H4 timeframe. It combines high-probability Smart Money Concepts (SMC) with a sophisticated Hybrid Grid management system. 1. Market Analysis Strategy (SMC & Trend Filter) The core "intelligence" of the EA relies on a dual-layer confi
L'indicateur SMC Venom Model BPR est un outil professionnel pour les traders travaillant dans le concept Smart Money (SMC). Il identifie automatiquement deux modèles clés sur le graphique des prix: FVG   (Fair Value Gap) est une combinaison de trois bougies, dans laquelle il y a un écart entre la première et la troisième bougie. Forme une zone entre les niveaux où il n'y a pas de support de volume, ce qui conduit souvent à une correction des prix. BPR   (Balanced Price Range) est une combinaiso
Laguerre SuperTrend Clouds   adds an Adaptive Laguerre averaging algorithm and alerts to the widely popular SuperTrend indicator. As the name suggests,   Laguerre SuperTrend Clouds (LSC)   is a trending indicator which works best in trendy (not choppy) markets. The SuperTrend is an extremely popular indicator for intraday and daily trading, and can be used on any timeframe. Incorporating Laguerre's equation to this can facilitate more robust trend detection and smoother filters. The LSC uses the
Descrizione dettagliata dell'indicatore GannZigZagMACD Scopo e concetto GannZigZagMACD è un indicatore tecnico ibrido per la piattaforma MetaTrader 5 che combina il classico indicatore MACD con elementi dello zigzag di Gann. È progettato per identificare inversioni di trend e generare segnali di trading basati su pattern estremi. L'idea principale dell'indicatore è rilevare massimi e minimi significativi utilizzando il metodo di Gann, per poi proiettare questi segnali sull'istogramma MACD. Prin
**   All Symbols   x   All Timeframes   scan just by pressing scanner button ** Discount: The price is $50$, But now it is just $39, Limited time offer is active. *** Contact me  to send you instruction and add you in "Trend Reversal group" for sharing or seeing experiences with other users. Introduction: Trendlines are the most famous technical analysis in trading . Trendlines continually form on the charts of markets across all the different timeframes providing huge opportunities for traders
Pro Gold System Indicator
PEDRO JOAQUIM GONCALVES GOMES
ADVANCED FUNCTIONALITIES: Trend Score (0-100) with visual bar Intelligent signals with adjustable strength (1-10) Risk management with automatic TP/SL Audible and visual alerts Price zones with smooth filling Multi-indicator analysis (RSI, ATR, BB, EMAs) DESIGN FEATURES Modern Visual: Smooth and well-spaced lines (EMA with 2-3px width) Vibrant and professional colors (Sky Blue, Orange, Gold) Modern arrows (code 233/234) for buy/sell signals Configurable dark/light theme Adjustable transparency f
Inverted_Chart_EA Utility Expert Advisor Inverted_Chart_EA creates and maintains a mirror-inverted chart of any symbol and timeframe. It automatically generates a custom instrument (e.g. US30_INV ) and keeps its price history updated in real time, with bars mirrored around a chosen pivot. This utility gives traders a new way to analyze the market from a different perspective by flipping the chart upside down. Why use an inverted chart? Highlight hidden patterns – price formations that look ordin
Trading Utility for Forex Currency Pairs Only not for Gold  Functions Auto Lot Calculation based on Risk Auto stoploss  Auto TakeProfit Breakeven Auto Close Half % Close in percentage with respect to the PIPs Pending Orders BuyLimit Sell Limit with distances BuyStop Sell Stop    with distances Trading Informations Risk in percentage For Multiple trades Combine Takeprofit and Combine Stoplosses
Auto Orders Manager EA
Mohamed Abdulmohsen Mohamed Saeed Ali
Professional Trading Orders Manager for MT5 with Signal-Analyzer-Direction-Power-Orders control - Scalping tools - Risk management - all in one trade panel and dashboard  A sophisticated Expert Advisor that transforms your MT5 platform into a complete trading command center. This tool seamlessly blends automated trading logic with comprehensive manual controls through dual interactive dashboards. Key Features: Automated Trading : advanced scalping strategy on M3 timeframe as a signal sample can
Mine Farm
Maryna Kauzova
Mine Farm is one of the most classic and time-tested scalping strategies based on the breakdown of strong price levels. Mine Farm is the author's modification of the system for determining entry and exit points into the market... Mine Farm - is the combination of great potential with reliability and safety. Why Mine Farm?! - each order has a short dynamic Stop Loss - the advisor does not use any risky methods (averaging, martingale, grid, locking, etc.) - the advisor tries to get the most
Cumulative delta indicator As most traders believe, the price moves under the pressure of market buying or selling. When someone redeems an offer standing in the cup, the deal is a "buy". If someone pours into the bid standing in the cup - the deal goes with the direction of "sale". The delta is the difference between purchases and sales. A cumulative delta - the difference between the cumulative sum of purchases and sales for a certain period of time. It allows you to see who is currently contr
Gli utenti di questo prodotto hanno anche acquistato
SuperScalp Pro
Van Minh Nguyen
4.93 (15)
SuperScalp Pro – Sistema avanzato di indicatore per scalping con filtri multipli SuperScalp Pro è un sistema avanzato di indicatore per scalping che combina il classico Supertrend con molteplici filtri di conferma intelligenti. L’indicatore funziona in modo efficiente su tutti i timeframe da M1 a H4 ed è particolarmente adatto per XAUUSD, BTCUSD e le principali coppie Forex. Può essere utilizzato come sistema stand-alone o integrato in modo flessibile nelle strategie di trading esistenti. L’indi
Azimuth Pro
Ottaviano De Cicco
5 (6)
LAUNCH PROMO Azimuth Pro price is initially set at 299$ for the first 100 buyers. Final price will be 499$ . THE DIFFERENCE BETWEEN RETAIL AND INSTITUTIONAL ENTRIES ISN'T THE INDICATOR — IT'S THE LOCATION. Most traders enter at arbitrary price levels, chasing momentum or reacting to lagging signals. Institutions wait for price to reach structured levels where supply and demand actually shift. Azimuth Pro maps these levels automatically: swing-anchored VWAP, multi-timeframe structure lines, an
Divergence Bomber
Ihor Otkydach
4.9 (86)
Ogni acquirente dell’indicatore riceverà inoltre gratuitamente: L’utilità esclusiva “Bomber Utility”, che gestisce automaticamente ogni operazione, imposta i livelli di Stop Loss e Take Profit e chiude le posizioni secondo le regole della strategia I file di configurazione (set file) per adattare l’indicatore a diversi asset I set file per configurare il Bomber Utility in tre modalità: “Rischio Minimo”, “Rischio Bilanciato” e “Strategia di Attesa” Una guida video passo-passo per installare, conf
Power Candles MT5
Daniel Stein
5 (7)
Power Candles – Segnali di ingresso basati sulla forza per tutti i mercati Power Candles porta l’analisi di forza collaudata di Stein Investments direttamente sul grafico dei prezzi. Invece di reagire solo al prezzo, ogni candela viene colorata in base alla reale forza di mercato, consentendo di identificare immediatamente accumuli di momentum, accelerazioni della forza e transizioni di trend pulite. Un’unica logica per tutti i mercati Power Candles funziona automaticamente su tutti i simboli di
Entry In The Zone and SMC Multi Timeframe is a real-time 2-in-1 market analysis tool that combines market structure analysis and a No Repaint BUY / SELL signal system into a single indicator, built on Smart Money Concepts (SMC) — a widely adopted framework used by professional traders to understand market structure. This indicator helps you see the market more clearly, make decisions based on structure rather than guesswork, and focus on high-probability zones where price is more likely to react
Se acquisti questo indicatore, riceverai il mio Trade Manager Professionale + EA  GRATUITAMENTE. Innanzitutto è importante sottolineare che questo sistema di trading è un indicatore Non-Repainting, Non-Redrawing e Non-Lagging, il che lo rende ideale sia per il trading manuale che per quello automatico. Corso online, manuale e download di preset. Il "Sistema di Trading Smart Trend MT5" è una soluzione completa pensata sia per i trader principianti che per quelli esperti. Combina oltre 10 indicat
OmniSync Projection
Antonio-alin Teculescu
5 (1)
Chronos Fractal Engine is an innovative price projection indicator for MetaTrader 5, designed to transform your technical analysis by intelligently identifying and projecting historical price patterns. Built upon an advanced correlation algorithm and the fractal principles of the market, this powerful tool visualizes potential future price movements, giving you a unique edge in your trading decisions. What is Chronos Fractal Engine? At its core, the Chronos Fractal Engine employs a sophisticat
Meridian Pro
Ottaviano De Cicco
5 (1)
Meridian Pro: Professional Multi-Timeframe Trend Matrix for MT5 Overview Meridian Pro is a multi-timeframe trend matrix by Merkava Labs that compresses directional state, strength, momentum condition and matrix agreement into one compact panel. One adaptive engine, applied consistently from M1 to W1. No per-symbol tuning. No indicator stacking. One structured readout across every asset and every timeframe. Launch Offer — Get Meridian Pro for USD 99 (introductory). Regular price: USD 149. 1. Why
Scopri quale strategia funziona davvero sul tuo simbolo - prima di rischiare denaro reale. Power Bar rileva le barre di prezzo estreme su qualsiasi simbolo e qualsiasi timeframe, poi esegue istantaneamente il backtest di 3 diverse strategie di trading per confrontare tassi di vincita, fattori di profitto e P&L fianco a fianco. Tutto in un unico pannello interattivo. Niente supposizioni. Niente curve-fitting. Solo dati. Cosa rende Power Bar unico? La maggior parte degli indicatori fornisce un se
Trend Screener Pro MT5
STE S.S.COMPANY
4.84 (103)
Indicatore di tendenza, soluzione unica rivoluzionaria per il trading di tendenze e il filtraggio con tutte le importanti funzionalità di tendenza integrate in un unico strumento! È un indicatore multi-timeframe e multi-valuta al 100% non ridipingibile che può essere utilizzato su tutti i simboli/strumenti: forex, materie prime, criptovalute, indici e azioni. Trend Screener è un indicatore di tendenza che segue un indicatore efficiente che fornisce segnali di tendenza a freccia con punti nel gra
FX Trend MT5 NG
Daniel Stein
5 (4)
FX Trend NG: La Nuova Generazione di Intelligenza di Trend Multi-Mercato Panoramica FX Trend NG è uno strumento professionale di analisi del trend multi-timeframe e monitoraggio dei mercati. Ti consente di comprendere la struttura completa del mercato in pochi secondi. Invece di passare tra numerosi grafici, puoi identificare immediatamente quali strumenti sono in trend, dove il momentum sta diminuendo e dove esiste un forte allineamento tra i timeframe. Offerta di Lancio – Ottieni FX Trend NG
Atomic Analyst MT5
Issam Kassas
3.94 (31)
Innanzitutto, vale la pena sottolineare che questo indicatore di trading non è repaint, non è ridisegno e non presenta ritardi, il che lo rende ideale sia per il trading manuale che per quello automatico. Manuale utente: impostazioni, input e strategia. L'Analista Atomico è un indicatore di azione del prezzo PA che utilizza la forza e il momentum del prezzo per trovare un miglior vantaggio sul mercato. Dotato di filtri avanzati che aiutano a rimuovere rumori e segnali falsi, e aumentare il pote
RFI levels PRO MT5
Roman Podpora
3.67 (3)
L'indicatore mostra accuratamente i punti di inversione e le zone di ritorno dei prezzi in cui il       Principali attori   . Vedi dove si formano le nuove tendenze e prendi decisioni con la massima precisione, mantenendo il controllo su ogni operazione. VERSION MT4     -    Rivela il suo massimo potenziale se combinato con l'indicatore   TREND LINES PRO Cosa mostra l'indicatore: Strutture di inversione e livelli di inversione con attivazione all'inizio di un nuovo trend. Visualizzazione dei li
Trend indicator AI mt5
Ramil Minniakhmetov
5 (16)
Trend Ai indicator è un ottimo strumento che migliorerà l'analisi di mercato di un trader combinando l'identificazione della tendenza con punti di ingresso utilizzabili e avvisi di inversione. Questo indicatore consente agli utenti di navigare nelle complessità del mercato forex con fiducia e precisione Oltre ai segnali primari, l'indicatore Ai di tendenza identifica i punti di ingresso secondari che si presentano durante i pullback o i ritracciamenti, consentendo ai trader di capitalizzare le
Crystal Heikin Ashi Signals
Muhammad Jawad Shabir
5 (2)
Crystal Heikin Ashi Signals - Professional Trend & Signal Detection Indicator Advanced Heikin Ashi Visualization with Intelligent Signal System for Manual & Automated Trading Final Price: $149 ---------> Price goes up $10 after every 10 sales . Limited slots available — act fast . Overview Crystal Heikin Ashi Signals is a professional-grade MetaTrader 5 indicator that combines pure Heikin Ashi candle visualization with an advanced momentum-shift detection system. Designed for both manual traders
Btmm state engine pro
Garry James Goodchild
5 (3)
BTMM State Engine Pro is a MetaTrader 5 indicator for traders who use the Beat The Market Maker approach: Asian session context, kill zone timing, level progression, peak formation detection, and a multi-pair scanner from a single chart. It combines cycle state logic with a built-in scanner dashboard so you do not need the same tool on many charts at once. What it does Draws the Asian session range; session times can follow broker server offset or be set in inputs. Tracks level progression (L
Gann Made Easy è un sistema di trading Forex professionale e facile da usare che si basa sui migliori principi del trading utilizzando la teoria di mr. WD Gann. L'indicatore fornisce segnali ACQUISTA e VENDI accurati, inclusi i livelli di Stop Loss e Take Profit. Puoi fare trading anche in movimento utilizzando le notifiche PUSH. CONTATTAMI DOPO L'ACQUISTO PER RICEVERE GRATUITAMENTE LE ISTRUZIONI DI TRADING E OTTIMI INDICATORI EXTRA! Probabilmente hai già sentito parlare molte volte dei metodi d
Currency Strength Dashboard Pro Pannello professionale di analisi della forza delle valute in tempo reale per MetaTrader 5 . L’indicatore calcola e visualizza la forza di 8 valute principali (EUR, USD, GBP, JPY, CHF, AUD, CAD, NZD) utilizzando 28 coppie di valute simultaneamente su più timeframe. Il pannello offre al trader una visione completa del mercato a colpo d’occhio — senza calcoli aggiuntivi né la necessità di passare tra diversi grafici. Metodo di calcolo L’indicatore si basa su un meto
FX Power MT5 NG
Daniel Stein
5 (31)
FX Power: Analizza la Forza delle Valute per Decisioni di Trading Più Intelligenti Panoramica FX Power è lo strumento essenziale per comprendere la reale forza delle principali valute e dell'oro in qualsiasi condizione di mercato. Identificando le valute forti da comprare e quelle deboli da vendere, FX Power semplifica le decisioni di trading e rivela opportunità ad alta probabilità. Che tu segua le tendenze o anticipi inversioni utilizzando valori estremi di Delta, questo strumento si adatta
RelicusRoad Pro: Sistema Operativo Quantitativo di Mercato 70% DI SCONTO ACCESSO A VITA (TEMPO LIMITATO) - UNISCITI A 2.000+ TRADER Perché la maggior parte dei trader fallisce anche con indicatori "perfetti"? Perché operano su Singoli Concetti isolati. Un segnale senza contesto è una scommessa. Per vincere serve CONFLUENZA . RelicusRoad Pro non è un semplice indicatore. È un Ecosistema Quantitativo completo . Mappa la "Fair Value Road", distinguendo tra rumore e rotture strutturali. Smetti di in
[ My Products ] , [ My Channel ]   ,  [ LIVE SIGNAL ] HFT Spike Detector HFT Spike Detector è uno strumento professionale di monitoraggio dei tick progettato per analizzare e misurare in tempo reale i movimenti di prezzo ad alta frequenza (picchi improvvisi causati da HFT). Il suo scopo è permetterti di rilevare slippage anomalo, gap di liquidità e picchi di prezzo a livello millisecondo causati dal broker, utilizzando dati numerici. Poiché analizza il flusso di tick in tempo reale e le cond
ARICoins
Temirlan Kdyrkhan
ARICoin is a powerful trading companion designed to generate high-probability entry signals with dynamic TP/SL/DP levels based on volatility. Built-in performance tracking shows win/loss stats, PP1/PP2 hits, and success rates all updated live. Key Features: Buy/Sell signals with adaptive volatility bands Real-time TP/SL/DP levels based on ATR Built-in MA Filter with optional ATR/StdDev volatility Performance stats panel (Success, Profit/Loss, PP1/PP2) Alerts via popup, sound, push, or email Cust
Market Structure Order Block Dashboard MT5 è un indicatore per MT5 focalizzato sulla struttura di mercato e sui concetti ICT / Smart Money: HH/HL/LH/LL , BOS , ChoCH , oltre a Order Blocks , Fair Value Gaps (FVG) , liquidità (EQH/EQL, sweeps), sessioni / Kill Zones e un Volume Profile integrato, con una dashboard compatta di confluence. Importante: è uno strumento di analisi . Non esegue operazioni (non è un EA). Bonus per gli acquirenti Dopo l’acquisto, puoi ricevere 2 indicatori bonus (a scel
Bill Williams Advanced
Siarhei Vashchylka
5 (11)
Bill Williams Advanced is designed for automatic chart analysis using Bill Williams' "Profitunity" system. The indicator analyzes four timeframes at once. Manual (Be sure to read before purchasing) Advantages 1. Analyzes the chart using Bill Williams' "Profitunity" system. Signals are displayed in a table in the corner of the screen and on the price chart. 2. Finds all known AO and AC signals, as well as zone signals. Equipped with a trend filter based on the Alligator. 3. Finds "Divergence Bar
CGE Trading Suite
Carl Gustav Johan Ekstrom
5 (1)
CGE Trading Suite delivers the analytical edge typically reserved for professional trading desks. The platform integrates a full suite of analytical tools into one seamless workflow: dynamic grid mapping, liquidity behavior analysis, ECM, trend lines, MIDAS, trade cycles, and directional channel projections. Together, these provide a unified view of market structure and momentum. Directional clarity is further enhanced by the capital flow index, which measures currency basket strength to identif
ARIPoint
Temirlan Kdyrkhan
ARIPoint is a powerful trading companion designed to generate high-probability entry signals with dynamic TP/SL/DP levels based on volatility. Built-in performance tracking shows win/loss stats, PP1/PP2 hits, and success rates all updated live. Key Features: Buy/Sell signals with adaptive volatility bands Real-time TP/SL/DP levels based on ATR Built-in MA Filter with optional ATR/StdDev volatility Performance stats panel (Success, Profit/Loss, PP1/PP2) Alerts via popup, sound, push, or email Cu
Gold Sniper Scalper Pro
Ich Khiem Nguyen
3.78 (9)
Gold Sniper Scalper Pro è un indicatore per MetaTrader 5 costruito specificamente per rilevare pattern di falsa rottura (false breakout) su XAUUSD. Identifica la struttura trappola a 4 barre dove il prezzo supera il confine di un range, attira i trader di rottura e poi inverte — confermando che il movimento era una falsa rottura. L'indicatore valuta ogni setup secondo 17 fattori di qualità, lo elabora attraverso un pipeline di confluenza a 4 livelli, lo verifica contro un motore di consenso di
Trend Lines PRO MT5
Roman Podpora
5 (1)
LINEE DI TENDENZA PRO  Aiuta a capire dove il mercato sta realmente cambiando direzione. L'indicatore mostra reali inversioni di tendenza e punti in cui i principali operatori rientrano. Vedi   Linee BOS   Cambiamenti di tendenza e livelli chiave su timeframe più ampi, senza impostazioni complesse o rumore inutile. I segnali non vengono ridisegnati e rimangono sul grafico dopo la chiusura della barra. VERSIONE MT4   -   Svela il suo massimo potenziale se abbinato all'indicatore   RFI LEVELS PRO
PZ Trend Trading MT5
PZ TRADING SLU
3.8 (5)
Capture every opportunity: your go-to indicator for profitable trend trading Trend Trading is an indicator designed to profit as much as possible from trends taking place in the market, by timing pullbacks and breakouts. It finds trading opportunities by analyzing what the price is doing during established trends. [ Installation Guide | Update Guide | Troubleshooting | FAQ | All Products ] Trade financial markets with confidence and efficiency Profit from established trends without getting whip
Trend Hunter MT5
Andrey Tatarinov
5 (4)
Trend Hunter è un indicatore di tendenza per lavorare nei mercati Forex, criptovaluta e CFD. Una caratteristica speciale dell'indicatore è che segue con sicurezza la tendenza, senza cambiare il segnale quando il prezzo supera leggermente la linea di tendenza. L'indicatore non viene ridisegnato; un segnale per entrare nel mercato appare dopo la chiusura della barra. Quando ci si sposta lungo un trend, l'indicatore mostra ulteriori punti di ingresso nella direzione del trend. Sulla base di quest
Altri dall’autore
Automated Stop Loss
James Andrew Flannery
5 (2)
Introducing the "Automated Stop Loss Placement" Script for MetaTrader 5 The "Automated Stop Loss Placement" script is a powerful tool designed to streamline your trading experience within the MetaTrader 5 platform. By automating the placement of stop loss orders, this script offers efficiency and convenience for traders of all levels. Key Features: Seamless Automation: Stop loss orders are placed automatically, moments after trade execution, saving you time and effort while ensuring consistent r
FREE
Seconds Timeframe Candles
James Andrew Flannery
5 (1)
A 'Seconds Period' chart, offering enhanced precision for charting and analysis. Especially beneficial during volatile market conditions and intraday trading. This indicator addresses the limitations of MT5's predefined timeframes, allowing for finer granularity down to second intervals. Since only one EA can run per chart, being an Indicator allows for the additional advantage of running an EA alongside the Seconds Timeframe Candles Indicator on the same chart. Compatible with any intraday tim
FREE
Tick Downloader
James Andrew Flannery
A simple script which will trigger a download of your broker's tick data for a specific trading instrument. Simply add to your chart and it will start the process.  You may add the script to multiple charts, enabling you to download tick data for more than one instrument at a time After a short period, the script will stop running and remove itself from your chart. Following this, it may take a few more minutes to finish downloading the tick data. The Tick Data folder can be found via MetaTrad
FREE
Tick Flow Meter
James Andrew Flannery
The Tick Flow Meter, also known as Tick Density Meter or Tick Counter, is an innovative indicator designed to provide deep insights into market dynamics down to the second. It is a cutting-edge indicator crafted to measure the intensity and frequency of ticks within specific time intervals. By focusing on tick flow, this indicator offers traders a unique perspective on market liquidity, momentum, and volatility, empowering them to make informed trading decisions. Key Features: Granular Time In
FREE
The Percentage Average True Range (ATR) indicator measures market volatility by calculating the ATR of a selected asset and expressing it in one of three customizable formats: Percentage (%) relative to the current price, enabling easy comparison across assets with different price ranges. Basis Points (bps), where 1 bps equals 0.01%. Real ATR values, representing the raw ATR in price terms. By normalizing ATR values using percentage or basis points, this indicator allows for direct comparison of
FREE
Volatility Adjusted Trailing Stop
James Andrew Flannery
5 (1)
VATS, short for Volatility-Adjusted Trailing Stop, is a dynamic trailing stop loss system for Manual Traders, engineered to adapt to price movements and market volatility. Its primary objective is to optimize risk management intelligently, setting and adjusting stops as price moves favorably while also recalibrating during periods of changing volatility.   This feature allows traders to stay focused on their trading strategies without the need for constant manual intervention. In essence, VATS s
Filtro:
Nessuna recensione
Rispondi alla recensione