Color Changing Alligator

Input Parameters

  • JawPeriod (default=9): Period for the blue line
  • JawShift (default=0): Shift for the blue line
  • TeethPeriod (default=7): Period for the red line
  • TeethShift (default=0): Shift for the red line
  • LipsPeriod (default=5): Period for the green line
  • LipsShift (default=0): Shift for the green line

 Signals

  1. Bullish Conditions

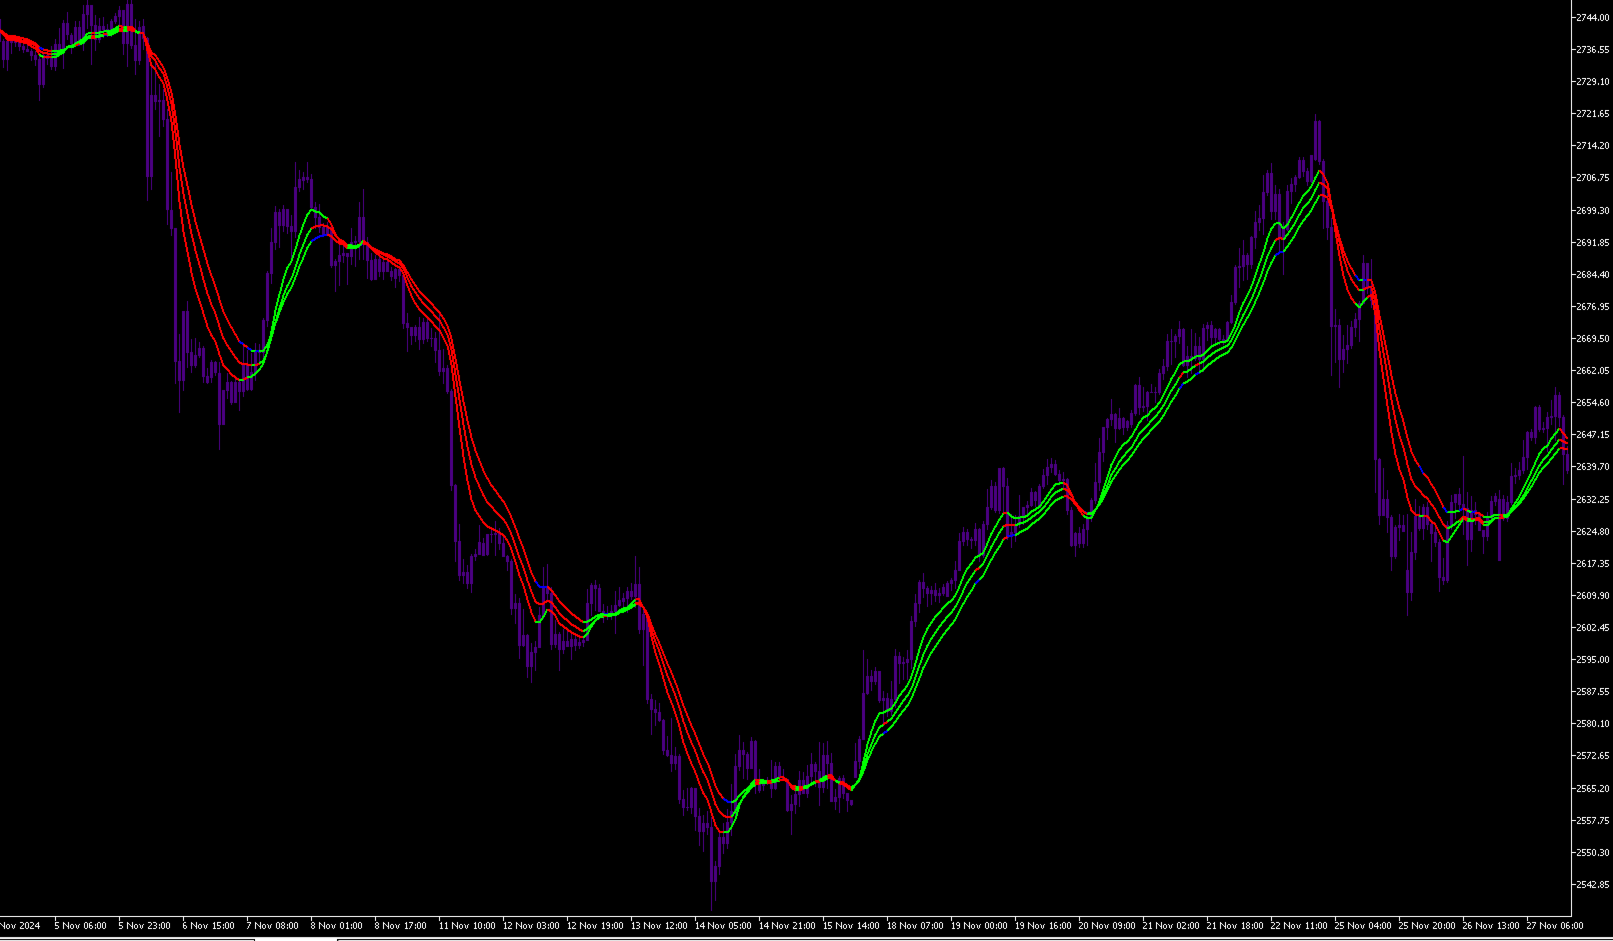
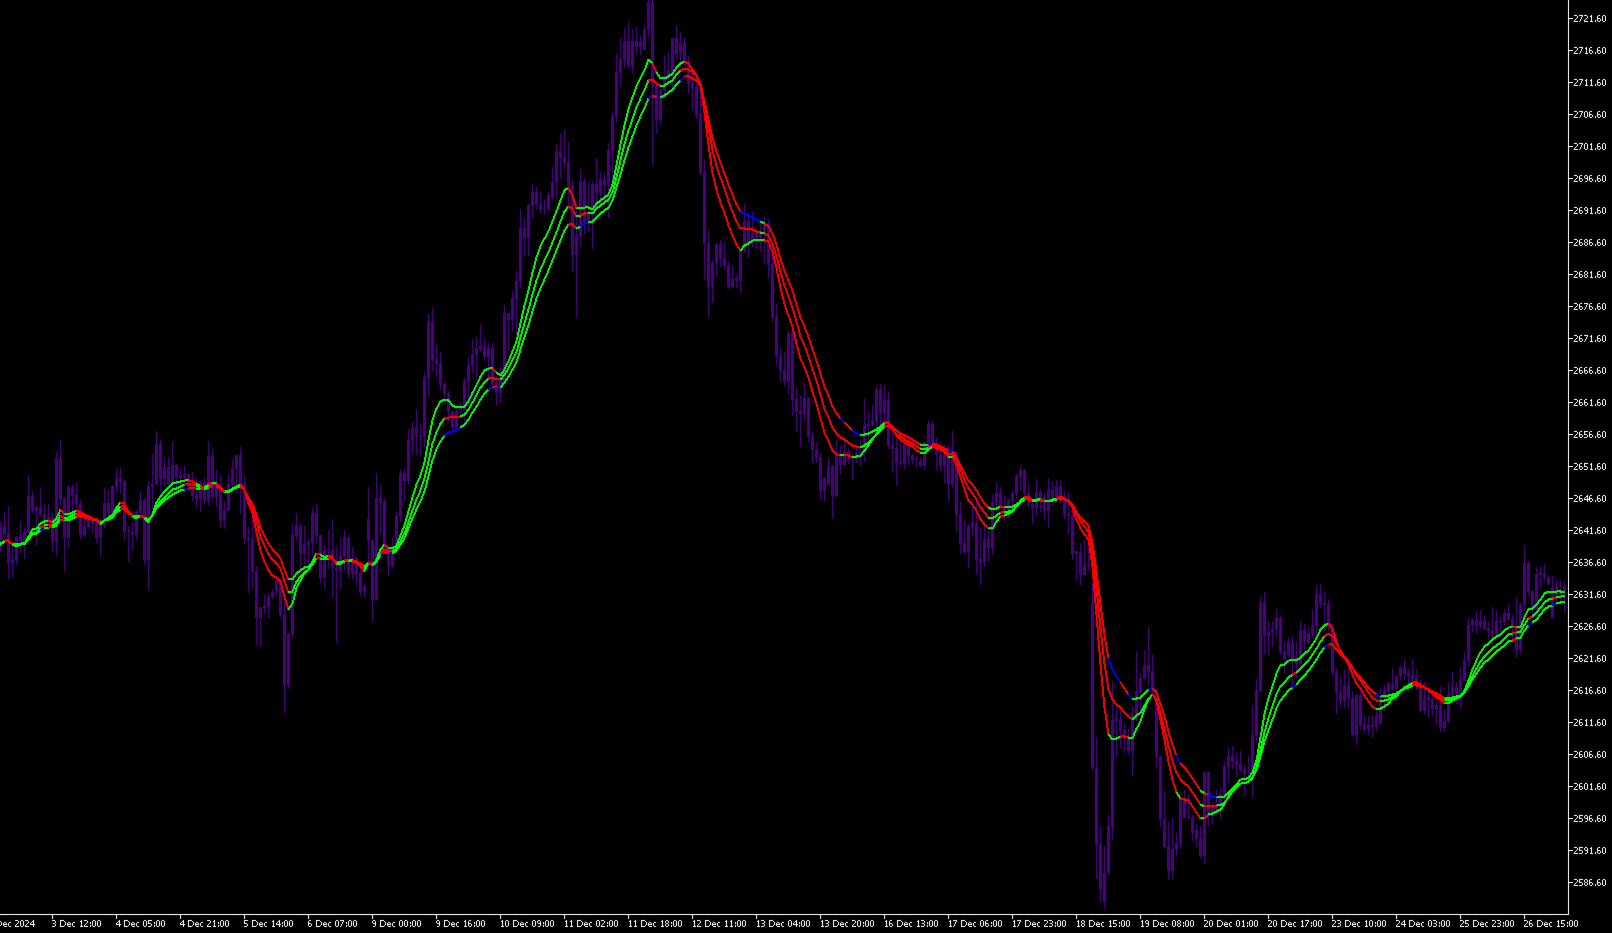
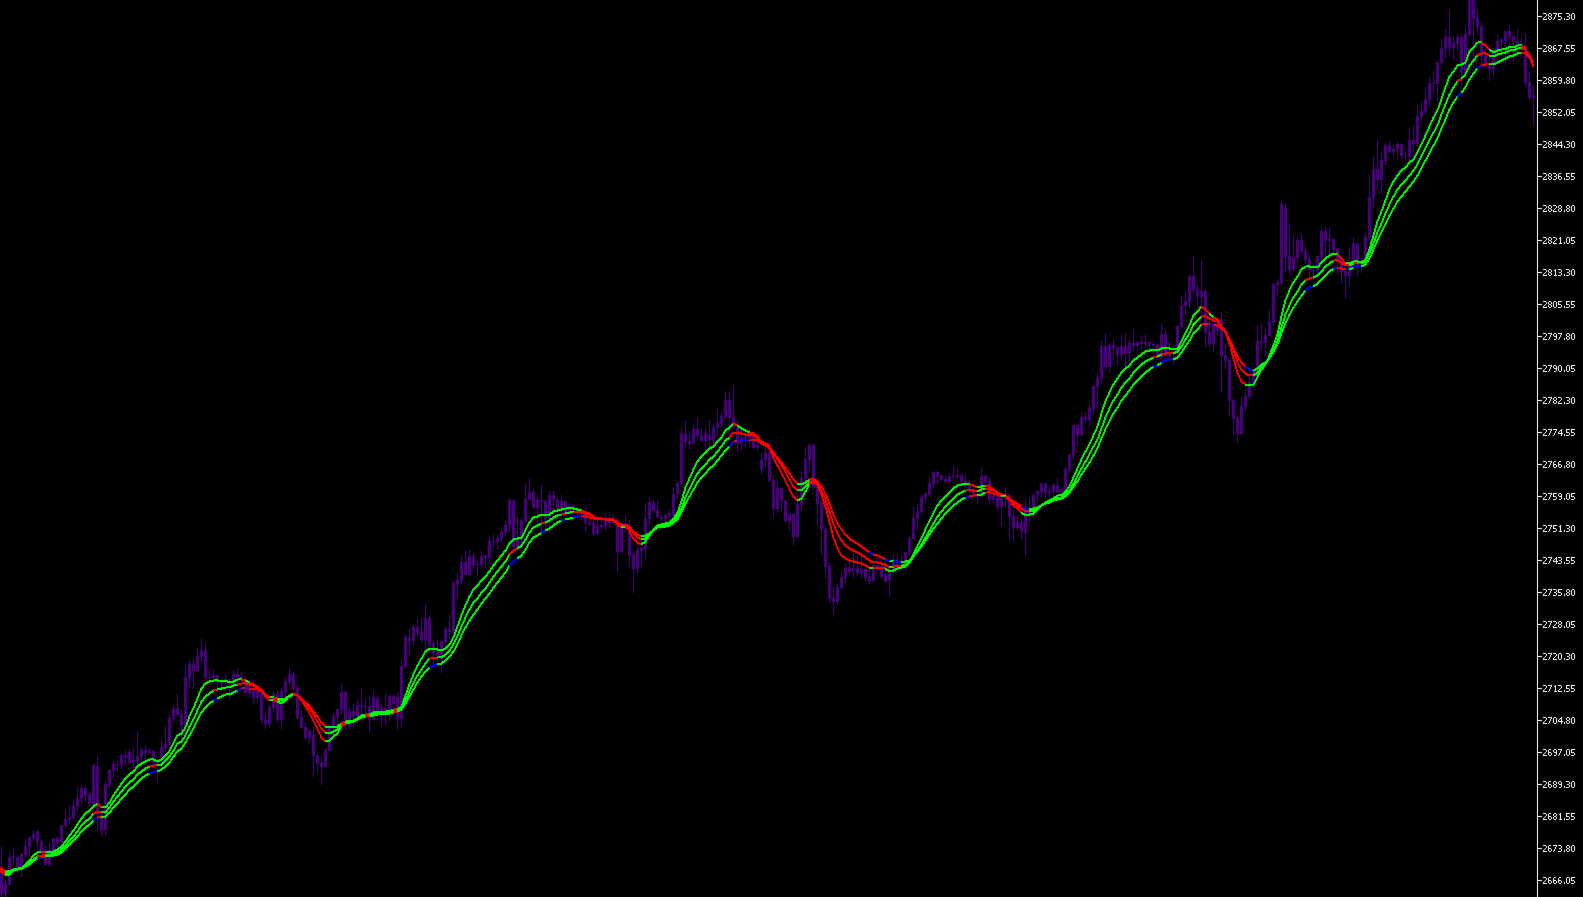
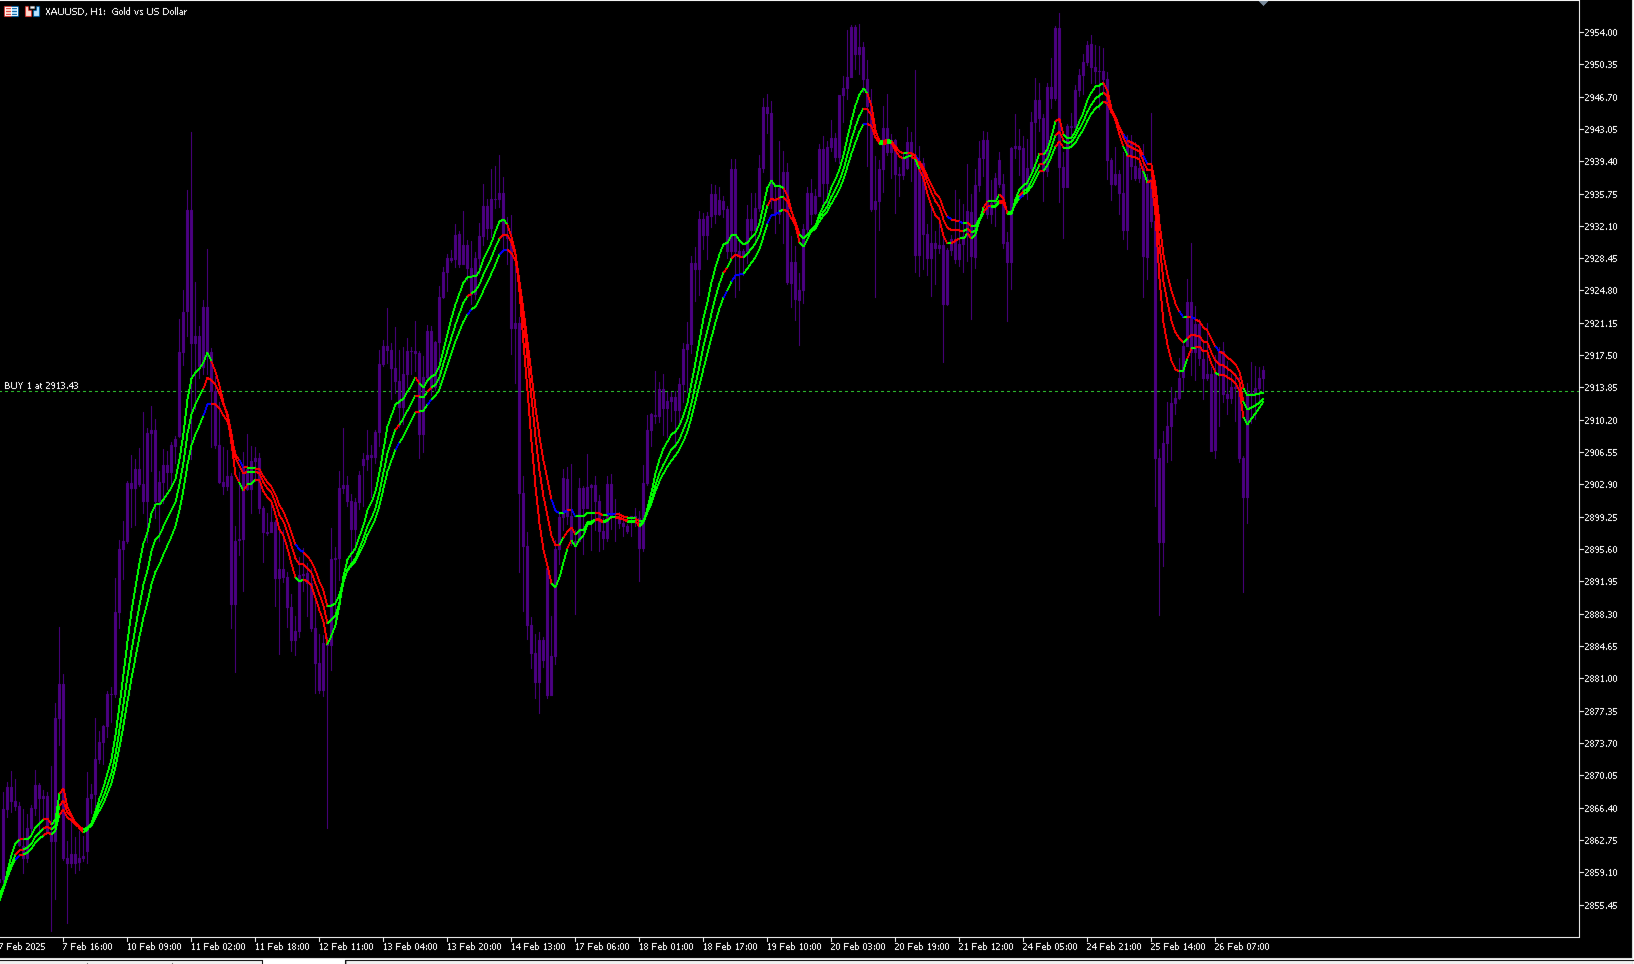
    • When price moves above all lines (all lines turn Lime)
    • Potential buying opportunity
    • Confirms upward momentum
  2. Bearish Conditions

    • When price moves below all lines (all lines turn Red)
    • Potential selling opportunity
    • Confirms downward momentum
  3. Neutral/Choppy Conditions

    • When lines display their default colors
    • Market lacks clear direction
    • Better to wait for clearer signals

Best Practices

  1. Use multiple timeframes for confirmation
  2. Combine with other indicators for better accuracy
  3. Wait for color changes to confirm trend changes
  4. Consider using with volume analysis for stronger signals


Prodotti consigliati
Daily Support and Resistance Levels è un indicatore professionale che calcola e mostra automaticamente i livelli chiave di prezzo per il trading intraday basato sui Punti Pivot classici. Caratteristiche: Calcolo automatico Pivot (PP) 3 resistenze (R1–R3) 3 supporti (S1–S3) Massimo/Minimo del giorno precedente Pannello informativo in tempo reale Bias di mercato (Rialzista/Ribassista) Distanza ai livelli più vicini Colori e stile personalizzabili Aggiornamento automatico giornaliero Funziona su tu
FREE
Sviluppo della versione precedente dell'indicatore ZigZag WaveSize MT4 ZigZag WaveSize - indicatore ZigZag standard modificato con l'aggiunta di informazioni sulla lunghezza d'onda in punti, livelli e diverse logiche di allarme Miglioramenti generali: Adattamento del codice per MetaTrader 5 Lavoro ottimizzato con gli oggetti grafici Novità: Livelli orizzontali agli estremi Scelta del tipo di livelli: orizzontale/raggi/segmenti Filtro per livelli liquidi (non penetrati dal prezzo) Buffer per le
FREE
Donchian Breakout And Rsi
Mattia Impicciatore
5 (1)
Descrizione generale Questo indicatore è una versione avanzata del classico Donchian Channel , arricchita con funzioni operative per il trading reale. Oltre alle tre linee tipiche (massimo, minimo e linea centrale), il sistema rileva i breakout e li segnala graficamente con frecce sul grafico, mostrando solo la linea opposta alla direzione del trend per semplificare la lettura. L’indicatore include: Segnali visivi : frecce colorate al breakout Notifiche automatiche : popup, push e email Filtro R
FREE
Cybertrade Keltner Channels
Emanuel Andriato
4.67 (6)
Cybertrade Keltner Channels - MT5 Created by Chester Keltner, this is a volatility indicator used by technical analysis. It is possible to follow the trend of financial asset prices and generate support and resistance patterns. In addition, envelopes are a way of tracking volatility in order to identify opportunities to buy and sell these assets. It works on periods longer than the period visible on the chart. All values ​​are available in the form of buffers to simplify possible automations.
FREE
FlatBreakout MT5
Aleksei Vorontsov
FlatBreakout MT5 (Free Version) Flat Range Detector and Breakout Panel for MT5 — GBPUSD Only FlatBreakout MT5   is the free version of the professional FlatBreakoutPro MT5 indicator, specially designed for flat (range) detection and breakout signals on the   GBPUSD   pair only. Perfect for traders who want to experience the unique fractal logic of FlatBreakout MT5 and test breakout signals on a live market without limitations. Who Is This Product For? For traders who prefer to trade breakout of
FREE
Free automatic Fibonacci is an indicator that automatically plots a Fibonacci retracement based on the number of bars you select on the BarsToScan setting in the indicator. The Fibonacci is automatically updated in real time as new highest and lowest values appears amongst the selected bars. You can select which level values to be displayed in the indicator settings. You can also select the color of the levels thus enabling the trader to be able to attach the indicator several times with differe
FREE
The Ultimate Risk Calculator
Elias Jose Vielma Molina
Risk Calculator EA – Utility for Precise Trade Sizing If you find this tool useful consider to  Buy me a coffee!   The Ultimate Risk Calculator is a lightweight in-chart Expert Advisor (EA) designed to help you easily and quickly calculate position size and set stop-loss / take-profit levels with full control over risk management directly on the chart. What it does? It turns manual risk decisions into fast, visual, and accurate calculations. You draw or adjust the Entry, Stop-Loss and Take-P
FREE
RSI abcd
Francisco Gomes Da Silva
4.33 (3)
RSI ABCD Pattern Finder: Strategia Tecnica 1. Come Funziona l'Indicatore Combina il RSI classico con il rilevamento automatico di pattern armonici ABCD . Componenti Principali RSI standard (periodo regolabile) Marcatori di massimi e minimi (frecce) Pattern ABCD (linee verdi/rosse) Filtri ipercomprato (70) e ipervenduto (30) 2. Configurazione su MT5 period = 14 ; // Periodo RSI size = 4 ; // Dimensione massima del pattern OverBought = 70 ; // Livello ipercomprato OverSold = 30 ; // Livello iperve
FREE
ATR Plus
Ivan Pochta
5 (1)
ATR Plus is an enhanced version of the classic ATR that shows not just volatility itself, but the directional energy of the market . The indicator converts ATR into a normalized oscillator (0–100), allowing you to clearly see: who dominates the market — buyers or sellers when a trend begins when a trend loses strength when the market shifts into a range where volatility reaches exhaustion zones ATR Plus is perfect for momentum, trend-following, breakout and volatility-based systems. How ATR Plus
FREE
Girassol Sunflower MT5 Indicator
Saullo De Oliveira Pacheco
3.86 (7)
This is the famous Sunflower indicator for Metatrader5. This indicator marks possible tops and bottoms on price charts. The indicator identifies tops and bottoms in the asset's price history, keep in mind that the current sunflower of the last candle repaints, as it is not possible to identify a top until the market reverses and it is also not possible to identify a bottom without the market stop falling and start rising. If you are looking for a professional programmer for Metatrader5, please
FREE
Coral Indi
Dinh Duong Luong
Coral trend is   a trend-following indicator that is widely popular among FOREX traders . It is usually used as a confluence with other indicators. It uses combinations of moving averages with complex smoothing formulas! It has two configurable parameters: Coefficient   - smoothing ratio (*) Applied price Calculation: Coral = (-0.064) * B6 + 0.672 * B5 - 2.352 * B4 + 2.744 * B3
FREE
Show Pips for MT5
Roman Podpora
4.52 (27)
Questo indicatore informativo sarà utile per coloro che vogliono essere sempre informati sulla situazione attuale del conto. VERSION MT 4 -   More useful indicators L'indicatore mostra dati come profitto in punti, percentuale e valuta, nonché lo spread per la coppia corrente e il tempo fino alla chiusura della barra nell'intervallo di tempo corrente. Esistono diverse opzioni per posizionare la linea delle informazioni sulla carta: A destra del prezzo (corre dietro al prezzo); Come commento (nell
FREE
Follow The Line MT5
Oliver Gideon Amofa Appiah
4.6 (35)
This indicator obeys the popular maxim that: "THE TREND IS YOUR FRIEND" It paints a GREEN line for BUY and also paints a RED line for SELL. (you can change the colors). It gives alarms and alerts of all kinds. IT DOES NOT REPAINT and can be used for all currency pairs and timeframes. Yes, as easy and simple as that. Even a newbie can use it to make great and reliable trades. NB: For best results, get my other premium indicators for more powerful and reliable signals. Get them here: https://www.m
FREE
Norion Daily Key Levels is a professional indicator designed to display the most relevant price reference levels of the trading day in a clear and objective way. The indicator automatically plots essential daily levels such as: Previous day close Current day open Daily high Daily low In addition, the indicator allows the inclusion of other custom daily reference levels, making it adaptable to different trading styles and market strategies. These levels are widely used by professional traders as
FREE
SMMA Bands Indicator
Elie Baptiste Granger
The SMMA Bands indicator is an advanced volatility-based trading tool that creates 6 dynamic support and resistance levels around an envelope formed by two Smoothed Moving Averages (SMMA).  This indicator combines the reliability of SMMA trend identification with the precision of standard deviation-based volatility bands, making it suitable for both trend-following and mean-reversion strategies. Every band has its own buffer for use in EA. feel free to make suggestions and add reviews , i will
FREE
MACD Enhanced
Nikita Berdnikov
5 (3)
Introducing the MACD  Enhanced – an advanced MACD (Moving Average Convergence Divergence) indicator that provides traders with extended capabilities for trend and momentum analysis in financial markets. The indicator uses the difference between the fast and slow exponential moving averages to determine momentum, direction, and strength of the trend, creating clear visual signals for potential entry and exit points. Attention! To achieve the best results, it is recommended to adapt the indicator
FREE
Value Chart Candlesticks
Flavio Javier Jarabeck
4.69 (13)
The idea of a Value Chart indicator was presented in the very good book I read back in 2020 , " Dynamic Trading Indicators: Winning with Value Charts and Price Action Profile ", from the authors Mark Helweg and David Stendahl. The idea is simple and the result is pure genius: Present candlestick Price analysis in a detrended way! HOW TO READ THIS INDICATOR Look for Overbought and Oversold levels. Of course, you will need to test the settings a lot to find the "correct" one for your approach. It
FREE
Free for now, price is going to be 30 USD at Jan 1. 2025. Features: Pin Bar Detection : The indicator is designed to identify bullish and bearish pin bars based on specific criteria, including the relative size of the candle’s body and shadow, as well as the position of the candle's body in relation to the 38.2% Fibonacci level. Customizable Labels : Custom text is displayed above each identified bullish or bearish pin bar, such as "[38.2]" for bullish and "[-38.2]" for bearish, helping traders
FREE
Il Matrix Arrow Indicator Multi Timeframe Panel MT5 è un componente aggiuntivo gratuito e una grande risorsa per il tuo Matrix Arrow Indicator MT5 . Mostra l'attuale segnale Matrix Arrow Indicator MT5 per 5 timeframe personalizzati dall'utente e per 16 simboli/strumenti modificabili in totale. L'utente ha la possibilità di abilitare/disabilitare uno qualsiasi dei 10 indicatori standard di cui è composto il Matrix Arrow Indicator MT5 . Anche tutti i 10 attributi degli indicatori standard sono re
FREE
Bounce Zone MT5
Nguyen Thanh Cong
4.56 (9)
Introduction The Bounce Zone indicator is a cutting-edge non-repainting technical tool built to identify key areas on the price chart where market sentiment is likely to cause a significant price reversal. Using advanced algorithms and historical price data analysis, this indicator pinpoints potential bounce zones. Combined with other entry signal, this indicator can help forex traders place the best trades possible Signal A possible buy signal is generated when price is in the green zone an
FREE
Indicatore Heiken Ashi MT5 Migliora la tua analisi di mercato con l'indicatore Heiken Ashi MT5. Questo potente strumento trasforma i dati di prezzo standard in candele più fluide e orientate al trend, facilitando l'identificazione delle tendenze di mercato e dei potenziali punti di inversione. Caratteristiche principali: Chiara identificazione dei trend: Distingui visivamente i trend rialzisti e ribassisti attraverso diversi colori delle candele. Riduzione del rumore: Filtra le fluttuazioni di
FREE
Little useful tool - you manually select range on chart by dragging vertical blue lines and indicator shows support and resistance zones for this range and extends them outside of selected range.  Useful for: * Range trading * Range breakout * Range breakout & retest * Good entry during pullback in trend phase when previous high is retested * Good for scalping on short timeframes * Good for trades on longer timeframes around selected important zones like daily high or low
FREE
Bollinger Bands B
Flavio Javier Jarabeck
4.25 (4)
John Bollinger created this indicator in 2010 as a way to read the original indicator (Bollinger Bands) in a more "technical" way, shown as an oscillator. The typical range of the Bollinger Bands %B is 0 - 0.5 - 1.0, where "0" represents the lower band, the "0.5" the middle band, and "1" the upper band. The line on the indicator represents the Closing prices. As simple as that. SETTINGS Bollinger Bands period of analysis Standard Deviation multiplier Shift Price type to be analyzed If you like
FREE
Full Description  Liquidity Hunt Candle Color Indicator is a Smart Money Concept (SMC) based MT5 indicator designed to detect stop hunts and liquidity sweeps in the market. Instead of using arrows or objects, this indicator directly colors the candles for a clean and professional chart appearance. How It Works The indicator identifies liquidity hunts using the following logic: Sell Liquidity Hunt (Buy-Side Liquidity Sweep) Current candle breaks the highest high of previous N candles Can
FREE
High Low Open Close
Alexandre Borela
4.98 (43)
Se ti piace questo progetto, lascia una recensione a 5 stelle. Questo indicatore disegna i prezzi aperti, alti, bassi e di chiusura per i specificati periodo e può essere regolato per un determinato fuso orario. Questi sono livelli importanti guardati da molti istituzionali e professionali commercianti e può essere utile per voi per conoscere i luoghi dove potrebbero essere più attivo. I periodi disponibili sono: Giorno precedente. Settimana precedente. Mese precedente. Precedente trimestre. A
FREE
Important Lines
Terence Gronowski
4.88 (24)
This indicator displays Pivot-Lines, preday high and low, preday close and the minimum and maximum of the previous hour. You just have to put this single indicator to the chart to have all these important lines, no need to setup many single indicators. Why certain lines are important Preday high and low : These are watched by traders who trade in a daily chart. Very often, if price climbs over or falls under a preday low/high there is an acceleration in buying/selling. It is a breakout out of a
FREE
StrongXpert
Steve Rosenstock
5 (1)
CLICCA QUI PER VEDERE TUTTI I MIEI PRODOTTI GRATUITI StrongXpert è il tuo strumento preciso per monitorare in tempo reale la forza delle valute nel mercato globale. È stato sviluppato per mostrarti dove il capitale sta realmente entrando - e da dove sta uscendo dal mercato . L’indicatore misura la forza relativa delle otto principali valute (USD, EUR, GBP, JPY, AUD, CAD, CHF, NZD) e trasforma movimenti di prezzo complessi in un pannello visivo semplice e leggibile - direttamente sul grafico. I
FREE
Indicator Description 4 Hull MA Color + Envelopes is a powerful trend-following indicator for MetaTrader 5 that combines four Hull Moving Averages (HMA) with Moving Average Envelopes to clearly identify market direction, trend strength, and potential reversal or pullback zones. This indicator is designed to reduce noise, react quickly to price movement, and provide a clean visual structure for professional trading.   Key Features   4 Hull Moving Averages (20, 50, 100, 200) Automatic color change
FREE
1. Overview The Scalping PullBack Signal indicator is a powerful technical analysis tool designed to help traders identify scalping opportunities based on potential pullback and reversal signals. This tool is particularly useful on lower timeframes (below 15 minutes) but can also be applied on higher timeframes for longer-term trades. This indicator integrates several key analytical components, providing a comprehensive view of trends and potential entry/exit points, helping you make quick and e
FREE
Zigzag Price Arrows
Aiman Saeed Salem Dahbag
The Zigzag Price Arrow indicator is an enhanced version of the classic Zigzag indicator, combining the traditional zigzag pattern with advanced visual features. It not only identifies major market turning points but also provides clear trading signals through: • Directional arrows: Displays colored arrows (green for buy, magenta for sell) indicating potential trend directions. • Price labels: Shows the exact price values at each pivot point directly on the chart. • Improved visual clarity: Make
FREE
Gli utenti di questo prodotto hanno anche acquistato
SuperScalp Pro
Van Minh Nguyen
5 (11)
SuperScalp Pro – Sistema avanzato di indicatore per scalping con filtri multipli SuperScalp Pro è un sistema avanzato di indicatore per scalping che combina il classico Supertrend con molteplici filtri di conferma intelligenti. L’indicatore funziona in modo efficiente su tutti i timeframe da M1 a H4 ed è particolarmente adatto per XAUUSD, BTCUSD e le principali coppie Forex. Può essere utilizzato come sistema stand-alone o integrato in modo flessibile nelle strategie di trading esistenti. L’indi
Divergence Bomber
Ihor Otkydach
4.89 (83)
Ogni acquirente dell’indicatore riceverà inoltre gratuitamente: L’utilità esclusiva “Bomber Utility”, che gestisce automaticamente ogni operazione, imposta i livelli di Stop Loss e Take Profit e chiude le posizioni secondo le regole della strategia I file di configurazione (set file) per adattare l’indicatore a diversi asset I set file per configurare il Bomber Utility in tre modalità: “Rischio Minimo”, “Rischio Bilanciato” e “Strategia di Attesa” Una guida video passo-passo per installare, conf
Azimuth Pro
Ottaviano De Cicco
5 (4)
LAUNCH PROMO Azimuth Pro price is initially set at 299$ for the first 100 buyers. Final price will be 499$ . THE DIFFERENCE BETWEEN RETAIL AND INSTITUTIONAL ENTRIES ISN'T THE INDICATOR — IT'S THE LOCATION. Most traders enter at arbitrary price levels, chasing momentum or reacting to lagging signals. Institutions wait for price to reach structured levels where supply and demand actually shift. Azimuth Pro maps these levels automatically: swing-anchored VWAP, multi-timeframe structure lines, an
Entry In The Zone and SMC Multi Timeframe is a real-time market analysis tool developed based on Smart Money Concepts (SMC). It is designed to analyze market structure, price direction, reversal points, and key zones across multiple timeframes in a systematic way. The system displays Points of Interest (POI) and real-time No Repaint signals, with instant alerts when price reaches key zones or when signals occur within those zones. It functions as both an Indicator and a Signal System (2-in-1), c
ARICoins
Temirlan Kdyrkhan
ARICoin is a powerful trading companion designed to generate high-probability entry signals with dynamic TP/SL/DP levels based on volatility. Built-in performance tracking shows win/loss stats, PP1/PP2 hits, and success rates all updated live. Key Features: Buy/Sell signals with adaptive volatility bands Real-time TP/SL/DP levels based on ATR Built-in MA Filter with optional ATR/StdDev volatility Performance stats panel (Success, Profit/Loss, PP1/PP2) Alerts via popup, sound, push, or email Cust
Se acquisti questo indicatore, riceverai il mio Trade Manager Professionale + EA  GRATUITAMENTE. Innanzitutto è importante sottolineare che questo sistema di trading è un indicatore Non-Repainting, Non-Redrawing e Non-Lagging, il che lo rende ideale sia per il trading manuale che per quello automatico. Corso online, manuale e download di preset. Il "Sistema di Trading Smart Trend MT5" è una soluzione completa pensata sia per i trader principianti che per quelli esperti. Combina oltre 10 indicat
FX Trend MT5 NG
Daniel Stein
5 (4)
FX Trend NG: La Nuova Generazione di Intelligenza di Trend Multi-Mercato Panoramica FX Trend NG è uno strumento professionale di analisi del trend multi-timeframe e monitoraggio dei mercati. Ti consente di comprendere la struttura completa del mercato in pochi secondi. Invece di passare tra numerosi grafici, puoi identificare immediatamente quali strumenti sono in trend, dove il momentum sta diminuendo e dove esiste un forte allineamento tra i timeframe. Offerta di Lancio – Ottieni FX Trend NG
Power Candles MT5
Daniel Stein
5 (6)
Power Candles – Segnali di ingresso basati sulla forza per tutti i mercati Power Candles porta l’analisi di forza collaudata di Stein Investments direttamente sul grafico dei prezzi. Invece di reagire solo al prezzo, ogni candela viene colorata in base alla reale forza di mercato, consentendo di identificare immediatamente accumuli di momentum, accelerazioni della forza e transizioni di trend pulite. Un’unica logica per tutti i mercati Power Candles funziona automaticamente su tutti i simboli di
[ My Products ] , [ My Channel ]   ,  [ LIVE SIGNAL ] HFT Spike Detector HFT Spike Detector è uno strumento professionale di monitoraggio dei tick progettato per analizzare e misurare in tempo reale i movimenti di prezzo ad alta frequenza (picchi improvvisi causati da HFT). Il suo scopo è permetterti di rilevare slippage anomalo, gap di liquidità e picchi di prezzo a livello millisecondo causati dal broker, utilizzando dati numerici. Poiché analizza il flusso di tick in tempo reale e le cond
Gold Entry Sniper
Tahir Mehmood
5 (6)
Gold Entry Sniper – Dashboard ATR Multi-Timeframe per Scalping e Swing Trading sull’Oro Gold Entry Sniper è un indicatore avanzato per MetaTrader 5 che offre segnali di acquisto/vendita precisi per XAUUSD e altri strumenti, basato sulla logica ATR Trailing Stop e l' analisi multi-timeframe . Caratteristiche e Vantaggi Analisi Multi-Timeframe – Visualizza trend su M1, M5, M15 in un'unica dashboard. Trailing Stop Basato su ATR – Stop dinamici che si adattano alla volatilità. Dashboard Professional
Trend Screener Pro MT5
STE S.S.COMPANY
4.81 (103)
Indicatore di tendenza, soluzione unica rivoluzionaria per il trading di tendenze e il filtraggio con tutte le importanti funzionalità di tendenza integrate in un unico strumento! È un indicatore multi-timeframe e multi-valuta al 100% non ridipingibile che può essere utilizzato su tutti i simboli/strumenti: forex, materie prime, criptovalute, indici e azioni. Trend Screener è un indicatore di tendenza che segue un indicatore efficiente che fornisce segnali di tendenza a freccia con punti nel gra
AriX
Temirlan Kdyrkhan
1 (4)
AriX Indicator for MT5 A powerful trend-following and signal-evaluation tool AriX is a custom MT5 indicator that combines Moving Averages and ATR-based risk/reward logic to generate clear buy/sell signals. It visualizes dynamic SL/TP levels, evaluates past trade outcomes, and displays win/loss statistics in a clean on-chart panel. Key features include: Buy/Sell signals based on MA crossovers ATR-based SL/TP1/TP2/TP3 levels with visual lines and labels Signal outcome tracking with real-time stat
RFI levels PRO MT5
Roman Podpora
3.67 (3)
L'indicatore mostra accuratamente i punti di inversione e le zone di ritorno dei prezzi in cui il       Principali attori   . Vedi dove si formano le nuove tendenze e prendi decisioni con la massima precisione, mantenendo il controllo su ogni operazione. VERSION MT4     -    Rivela il suo massimo potenziale se combinato con l'indicatore   TREND LINES PRO Cosa mostra l'indicatore: Strutture di inversione e livelli di inversione con attivazione all'inizio di un nuovo trend. Visualizzazione dei li
Grabber System MT5
Ihor Otkydach
4.83 (23)
Ti presento un eccellente indicatore tecnico: Grabber, che funziona come una strategia di trading "tutto incluso", pronta all’uso. In un solo codice sono integrati strumenti potenti per l’analisi tecnica del mercato, segnali di trading (frecce), funzioni di allerta e notifiche push. Ogni acquirente di questo indicatore riceve anche gratuitamente: L’utility Grabber: per la gestione automatica degli ordini aperti Video tutorial passo dopo passo: per imparare a installare, configurare e utilizzare
Game Changer Indicator mt5
Vasiliy Strukov
4.48 (23)
Game Changer è un indicatore di tendenza rivoluzionario, progettato per essere utilizzato su qualsiasi strumento finanziario, per trasformare il tuo MetaTrader in un potente analizzatore di trend. Funziona su qualsiasi intervallo temporale e aiuta a identificare i trend, segnala potenziali inversioni, funge da meccanismo di trailing stop e fornisce avvisi in tempo reale per risposte tempestive del mercato. Che tu sia un professionista esperto o un principiante in cerca di un vantaggio, questo st
Atomic Analyst MT5
Issam Kassas
4.03 (30)
Innanzitutto, vale la pena sottolineare che questo indicatore di trading non è repaint, non è ridisegno e non presenta ritardi, il che lo rende ideale sia per il trading manuale che per quello automatico. Manuale utente: impostazioni, input e strategia. L'Analista Atomico è un indicatore di azione del prezzo PA che utilizza la forza e il momentum del prezzo per trovare un miglior vantaggio sul mercato. Dotato di filtri avanzati che aiutano a rimuovere rumori e segnali falsi, e aumentare il pote
OmniSync Projection
Antonio-alin Teculescu
5 (1)
Chronos Fractal Engine is an innovative price projection indicator for MetaTrader 5, designed to transform your technical analysis by intelligently identifying and projecting historical price patterns. Built upon an advanced correlation algorithm and the fractal principles of the market, this powerful tool visualizes potential future price movements, giving you a unique edge in your trading decisions. What is Chronos Fractal Engine? At its core, the Chronos Fractal Engine employs a sophisticat
FX Power MT5 NG
Daniel Stein
5 (31)
FX Power: Analizza la Forza delle Valute per Decisioni di Trading Più Intelligenti Panoramica FX Power è lo strumento essenziale per comprendere la reale forza delle principali valute e dell'oro in qualsiasi condizione di mercato. Identificando le valute forti da comprare e quelle deboli da vendere, FX Power semplifica le decisioni di trading e rivela opportunità ad alta probabilità. Che tu segua le tendenze o anticipi inversioni utilizzando valori estremi di Delta, questo strumento si adatta
Smart Stop Indicator – Precisione intelligente dello stop-loss direttamente sul grafico Panoramica Smart Stop Indicator è la soluzione ideale per i trader che desiderano posizionare il loro stop-loss in modo chiaro e metodico, senza dover indovinare o affidarsi all’intuizione. Questo strumento combina la logica classica del price action (massimi e minimi strutturali) con un moderno riconoscimento dei breakout per identificare il prossimo livello di stop realmente logico. In trend, in range o i
Trend Lines PRO MT5
Roman Podpora
5 (1)
LINEE DI TENDENZA PRO  Aiuta a capire dove il mercato sta realmente cambiando direzione. L'indicatore mostra reali inversioni di tendenza e punti in cui i principali operatori rientrano. Vedi   Linee BOS   Cambiamenti di tendenza e livelli chiave su timeframe più ampi, senza impostazioni complesse o rumore inutile. I segnali non vengono ridisegnati e rimangono sul grafico dopo la chiusura della barra. VERSIONE MT4   -   Svela il suo massimo potenziale se abbinato all'indicatore   RFI LEVELS PRO
Innanzitutto, vale la pena sottolineare che questo Strumento di Trading è un Indicatore Non-Ridipingente, Non-Ridisegnante e Non-Laggante, il che lo rende ideale per il trading professionale. Corso online, manuale utente e demo. L'Indicatore Smart Price Action Concepts è uno strumento molto potente sia per i nuovi che per i trader esperti. Racchiude più di 20 utili indicatori in uno solo, combinando idee di trading avanzate come l'Analisi del Trader del Circolo Interno e le Strategie di Tradin
ARIPoint
Temirlan Kdyrkhan
ARIPoint is a powerful trading companion designed to generate high-probability entry signals with dynamic TP/SL/DP levels based on volatility. Built-in performance tracking shows win/loss stats, PP1/PP2 hits, and success rates all updated live. Key Features: Buy/Sell signals with adaptive volatility bands Real-time TP/SL/DP levels based on ATR Built-in MA Filter with optional ATR/StdDev volatility Performance stats panel (Success, Profit/Loss, PP1/PP2) Alerts via popup, sound, push, or email Cu
Trend indicator AI mt5
Ramil Minniakhmetov
5 (15)
Trend Ai indicator è un ottimo strumento che migliorerà l'analisi di mercato di un trader combinando l'identificazione della tendenza con punti di ingresso utilizzabili e avvisi di inversione. Questo indicatore consente agli utenti di navigare nelle complessità del mercato forex con fiducia e precisione Oltre ai segnali primari, l'indicatore Ai di tendenza identifica i punti di ingresso secondari che si presentano durante i pullback o i ritracciamenti, consentendo ai trader di capitalizzare le
RelicusRoad Pro: Sistema Operativo Quantitativo di Mercato 70% DI SCONTO ACCESSO A VITA (TEMPO LIMITATO) - UNISCITI A 2.000+ TRADER Perché la maggior parte dei trader fallisce anche con indicatori "perfetti"? Perché operano su Singoli Concetti isolati. Un segnale senza contesto è una scommessa. Per vincere serve CONFLUENZA . RelicusRoad Pro non è un semplice indicatore. È un Ecosistema Quantitativo completo . Mappa la "Fair Value Road", distinguendo tra rumore e rotture strutturali. Smetti di in
Quantum TrendPulse
Bogdan Ion Puscasu
5 (22)
Ecco   Quantum TrendPulse   , lo strumento di trading definitivo che combina la potenza di   SuperTrend   ,   RSI   e   Stocastico   in un unico indicatore completo per massimizzare il tuo potenziale di trading. Progettato per i trader che cercano precisione ed efficienza, questo indicatore ti aiuta a identificare con sicurezza le tendenze di mercato, i cambiamenti di momentum e i punti di entrata e uscita ottimali. Caratteristiche principali: Integrazione SuperTrend:   segui facilmente l'andame
Pips Stalker mt5
Abdulkarim Karazon
5 (1)
Il Pips Stalker è un indicatore a freccia lunga e corta, aiuta i trader di tutti i livelli a prendere decisioni migliori nel trading sul mercato, l'indicatore non viene mai ridipinto e usa l'RSI come logica principale del segnale; una volta applicata una freccia, non verrà mai ridipinta o ridipinga e le frecce non vengono ritardate. VERSIONE MT4 <---- CARATTERISTICHE DELLA FRECCIA PIPS STALKER : PANNELLO STATISTICHE un dashboard informativo unico che mostra la percentuale complessiva di
FX Levels MT5
Daniel Stein
5 (13)
FX Levels: Supporti e Resistenze di Precisione Eccezionale per Tutti i Mercati Panoramica Rapida Cercate un modo affidabile per individuare livelli di supporto e resistenza in ogni mercato—coppie di valute, indici, azioni o materie prime? FX Levels fonde il metodo tradizionale “Lighthouse” con un approccio dinamico all’avanguardia, offrendo una precisione quasi universale. Basato sulla nostra esperienza reale con i broker e su aggiornamenti automatici giornalieri più quelli in tempo reale, FX
Candle Smart Range
Gianny Alexander Lugo Sanchez
5 (1)
Candle Smart Range (CSR) per MetaTrader 5 Candle Smart Range è un indicatore tecnico progettato per l'identificazione automatica dei range di prezzo su più timeframe. Questo strumento analizza la struttura del mercato basandosi sulle formazioni delle candele e sull'interazione del prezzo con i massimi e i minimi precedenti. Caratteristiche principali: Rilevamento Range: Identifica le zone di consolidamento prima dei movimenti impulsivi. Identificazione Falsi Breakout: Segnala quando il prezzo su
Crystal Heikin Ashi Signals
Muhammad Jawad Shabir
5 (1)
Crystal Heikin Ashi Signals - Professional Trend & Signal Detection Indicator Advanced Heikin Ashi Visualization with Intelligent Signal System for Manual & Automated Trading Final Price: $149 ---------> Price goes up $10 after every 10 sales . Limited slots available — act fast . Overview Crystal Heikin Ashi Signals is a professional-grade MetaTrader 5 indicator that combines pure Heikin Ashi candle visualization with an advanced momentum-shift detection system. Designed for both manual traders
IX Power MT5
Daniel Stein
4.92 (13)
IX Power: Scopri approfondimenti di mercato per indici, materie prime, criptovalute e forex Panoramica IX Power è uno strumento versatile progettato per analizzare la forza di indici, materie prime, criptovalute e simboli forex. Mentre FX Power offre la massima precisione per le coppie di valute utilizzando i dati di tutte le coppie disponibili, IX Power si concentra esclusivamente sui dati di mercato del simbolo sottostante. Questo rende IX Power una scelta eccellente per mercati non correlat
Altri dall’autore
Entry Signal Probability
Tevon R Gardiner
5 (1)
This indicator helps identify the   start  of significant market movements by analyzing candle patterns and their relative  price action strength  the indicator runs multiple simultaneous calculation every millisecond and it also does a triple set verification historically in order to calculate future probabilities the historical processing has to be completed before new Candlestick can be processed as one total set out of the total available history from the starting date and time in order to
FREE
The  Entry Signal Analyzer is a sophisticated MetaTrader 5 indicator designed to analyze and identify optimal trading hours based on price movement patterns. The indicator analyzes gold currency only  a updated version is currently being developed for other symbol  the indicator in the strategy tester is non-functional works on the real chart Statistical Analysis: Analyzes historical price movements for each hour of the trading day Tracks success rates and consistency of movements Calculates poi
FREE
The "Market Direction Analyzer" is a technical indicator designed to provide traders with a comprehensive analysis of market trends, momentum, and potential reversals. By integrating multiple analytical tools, it offers a multi-dimensional perspective on market conditions, aiding in more informed trading decisions. Using the Market Direction Analyzer in Trading: Trend Confirmation: By analyzing the aggregated sentiment score derived from its components, traders can confirm the prevailing market
FREE
it's a fully built expert advisor with trading functionality with buy only or sell only or both options it's designed to be a tool that can be used for automate entry and exit in line with the overall Market Direction automatic  risk management parameters fully  comprehensive STRATEGY ANALYZER Section Total Trades: Shows the overall number of trades taken Win Rate: Displays percentage of winning trades (color-coded green if >50%, red if <50%) Total Profit/Loss: Shows absolute profit and loss v
FREE
This tool identifies  opportunitie levels by tracking where significant orders are being filled in the market  and monitors key price levels where institutional orders cluster, providing you with valuable insights into market structure and potential reversal points. Key Features: Smart Level Detection • Automatically identifies significant price levels where orders are being filled • Tracks both touch and rejection points to validate level strength • Merg Fully Customizable • Adjustable a
FREE
Key Features: • Multi-Zone Analysis: Track volume patterns across multiple customizable price zones • Real-Time Volume Tracking: Monitor buy/sell pressure as it develops • Dynamic Price Levels: Automatically adjusts zones around daily opening prices • Advanced Statistics: View detailed volume metrics and price action percentages Technical Capabilities: • Volume Distribution Analysis - Buy/Sell volume ratios - Volume imbalance detection - Total trading activity monitoring - Price action directio
Trading concept: When price touches or exceeds the upper circle boundary = potential sell signal (overbought) When price touches or falls below the lower circle boundary = potential buy signal (oversold) The circle acts like a dynamic support/resistance band around the opening price The numbered points (1-24) help identify where in the cycle the price currently is This is similar to using Bollinger Bands or other envelope indicators, but with a fixed radius instead of standard deviations.
Filtro:
Nessuna recensione
Rispondi alla recensione