NTicks Candle
- Indicatori
-
Yu Zhang
 I am a senior practitioner in Fintech industry.
And I have done a lot of academic research on financial markets.
From 2012, I work as a Quant.
Forex, stock and futures are my main trading varieties.
I can use MQL4, MQL5, C++, MySql, and Python. - Versione: 1.0
- Attivazioni: 20
1. What is this
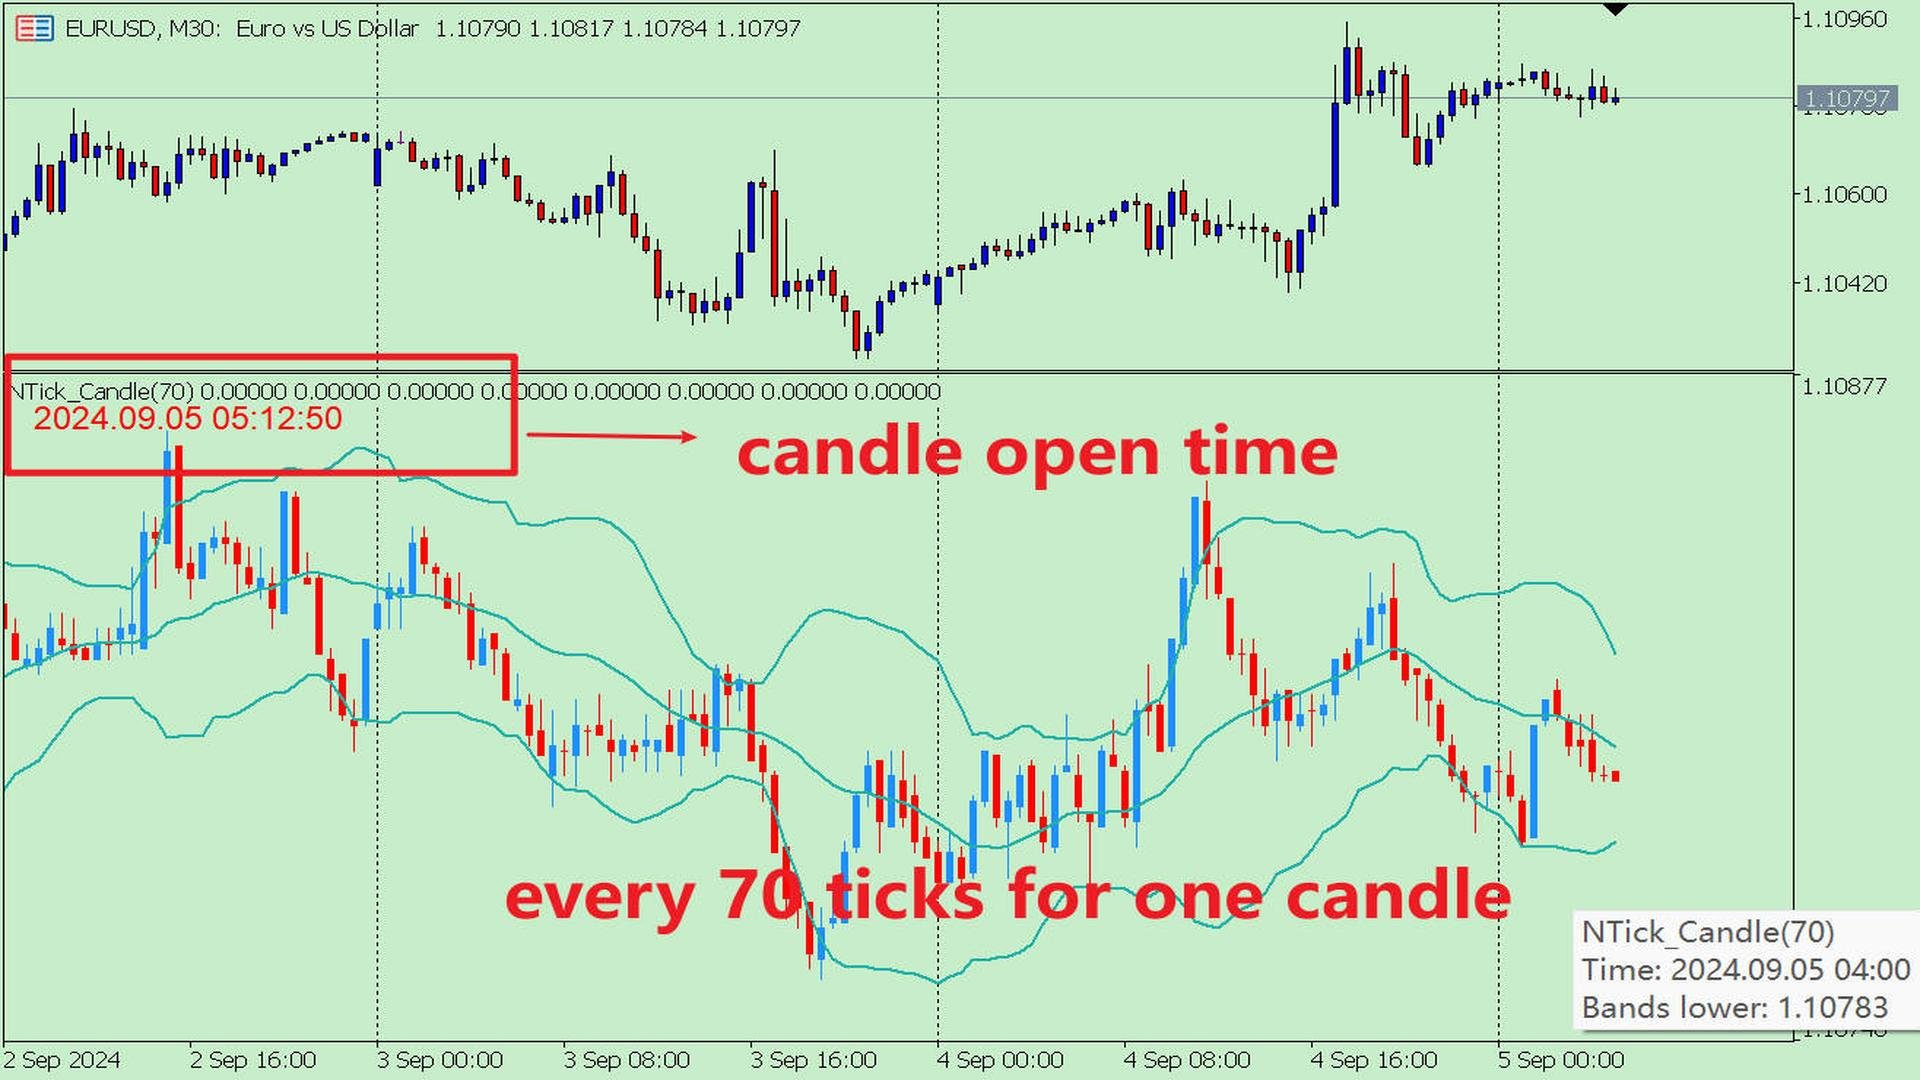
Due to the limitation of MT5 software, we can only see the minimum 1-minute candlestick chart.
Sometimes this is not enough for high-frequency traders, or we want to see a more detailed candlestick chart.
This tool allows you to see:
A candlestick chart composed of N ticks, which allows you to better understand the price fluctuations.
For example, each candle line has 20 ticks, or 70 ticks.
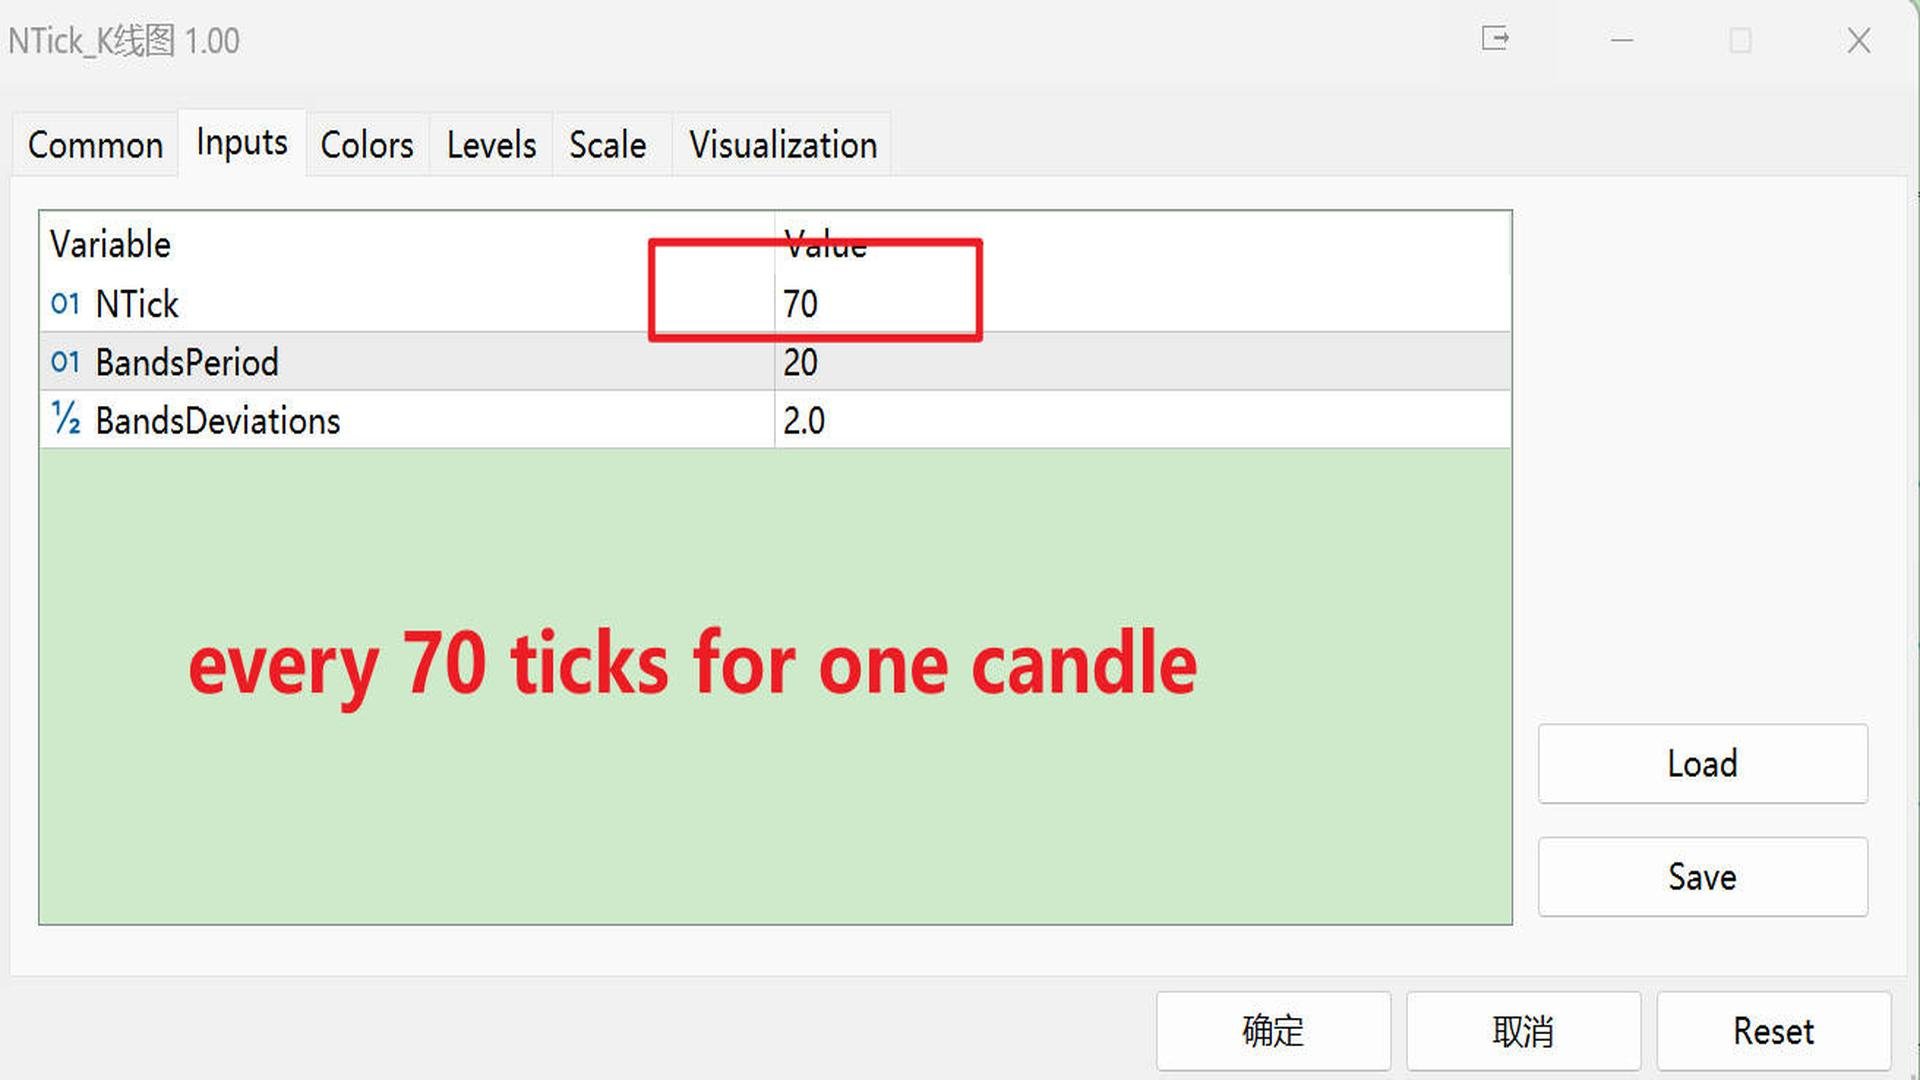
2. Parameters:
NTick = 70; // The tick cnt for one candle
BandsPeriod = 20; // Bollinger Bands period
BandsDeviations = 2.0; // Bollinger Bands deviation.