Unisciti alla nostra fan page
- Visualizzazioni:
- 36267
- Valutazioni:
- Pubblicato:
- Aggiornato:
-
Hai bisogno di un robot o indicatore basato su questo codice? Ordinalo su Freelance Vai a Freelance
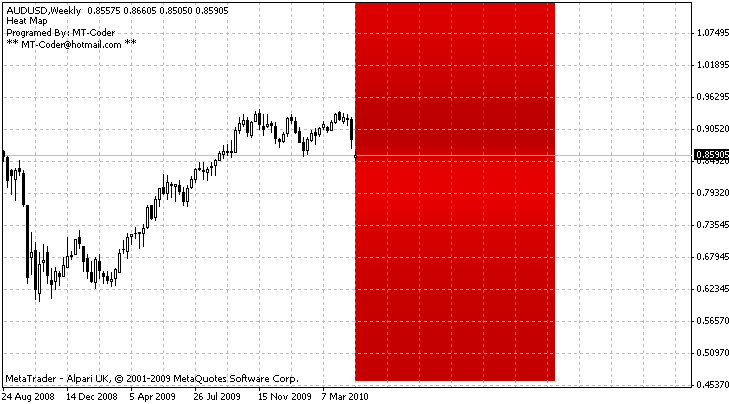
The purpose of this indicator is to highlight the price zones that had the most activity : the hotest zones.
The indicator shows a gradiant of zones colored in red.
It goes from bright Red 'coldest' to Dark Red 'hottest'. THE DARKER THE HOTTER

** ** ** * ** * *** SETTINGS ** ** **** ** * **
HMPeriod : the number of bars included in the count
Scale : the size of each zone.
NbZone : the number of zones (rectangles) to create.
If all you get is a blue rectangle then check the availibility of history data for the period you've set, or just change the period.
Update :
- Major bug fixed. If you downloaded this indicator before July 24 2010 then please redownload it.
- Now it should work with all timeframes
- Initialization fixed.
 OsMaSter_V0
The Expert Adviser uses the indicator OsMA.
 Universal Ranger
Shows low high from the last bar from other timeframe. Timeframe can be changed
 AutoMagiCal
Auto Magic Nr. Calc The Magic Nr. per ASC II Code from Symbols
 Simple Trend Detector
Simple Trend Detector. Use the same as RSI and DeM.