 MetaTrader 5
 Sistemi Esperti
 Indicatori
 Script
 Librerie
 Archiviazione
Guarda come scaricare robot di trading gratuitamente
Ci trovi su Facebook!
Unisciti alla nostra fan page
Unisciti alla nostra fan page
Ti è piaciuto lo script? Provalo nel Terminale MetaTrader 5

MTF Trend Dashboard — trend, position and volatility on six timeframes at a glance - indicatore per MetaTrader 5
Shipra Gupta

Sono Shipra Gupta, trader e sviluppatrice di strategie quantitative con una solida formazione in matematica, economia e sistemi di trading algoritmico. Nel corso degli anni ho lavorato ampiamente nei mercati forex, oro, indici, materie prime e criptovalute, concentrandomi sulla costruzione di
- Visualizzazioni:
- 63
- Pubblicato:
-
 Ti stai perdendo delle opportunità di trading:
- App di trading gratuite
- Oltre 8.000 segnali per il copy trading
- Notizie economiche per esplorare i mercati finanziari
Registrazione AccediAccetti la politica del sito e le condizioni d’uso
Se non hai un account, registrati -
 Hai bisogno di un robot o indicatore basato su questo codice? Ordinalo su Freelance
Vai a Freelance
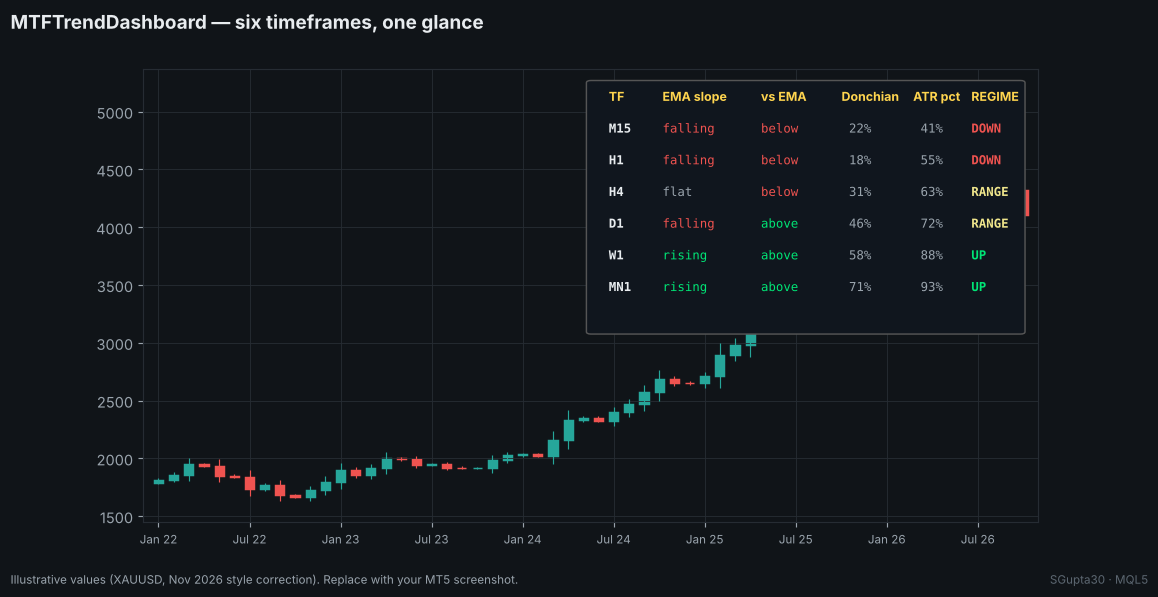
What you see
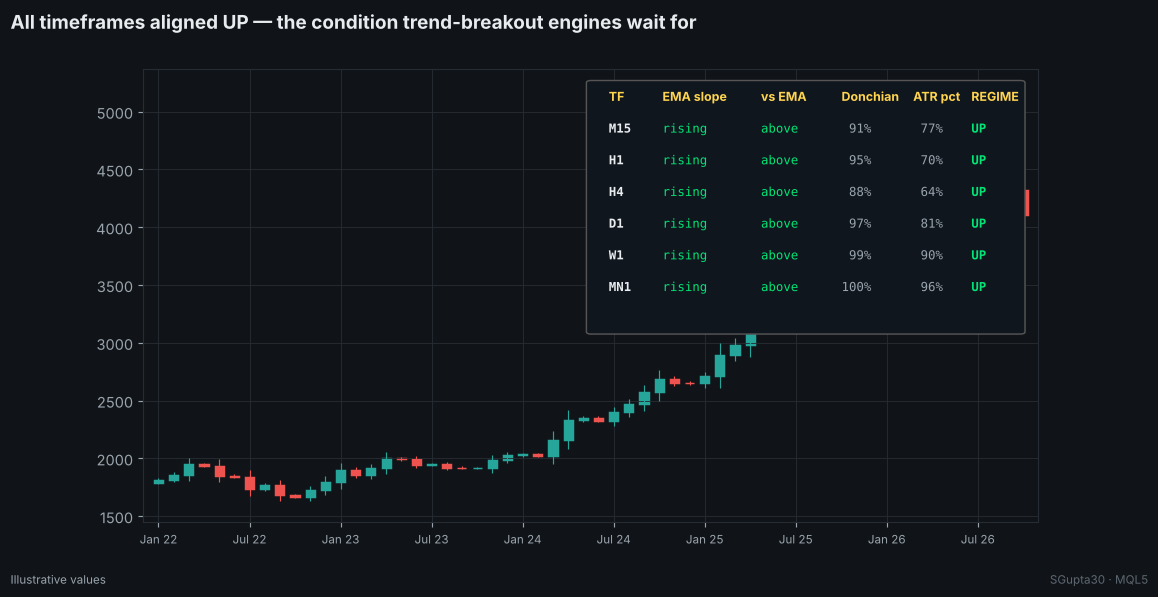
Each row is a timeframe and each column answers one question:
| Column | Question | Colours |
|---|---|---|
| EMA slope | Is the EMA rising or falling over the last k bars? | green / red |
| vs EMA | Is the last close above or below the EMA? | green / red |
| Donchian | Where is the close inside the last N-bar range (0–100%)? | green > 80%, red < 20% |
| ATR pct | How high is volatility versus the last 250 bars? | blue < 20% (quiet), orange > 80% (hot) |
| REGIME | Do slope and side agree? | UP / DOWN / RANGE |
When timeframes align
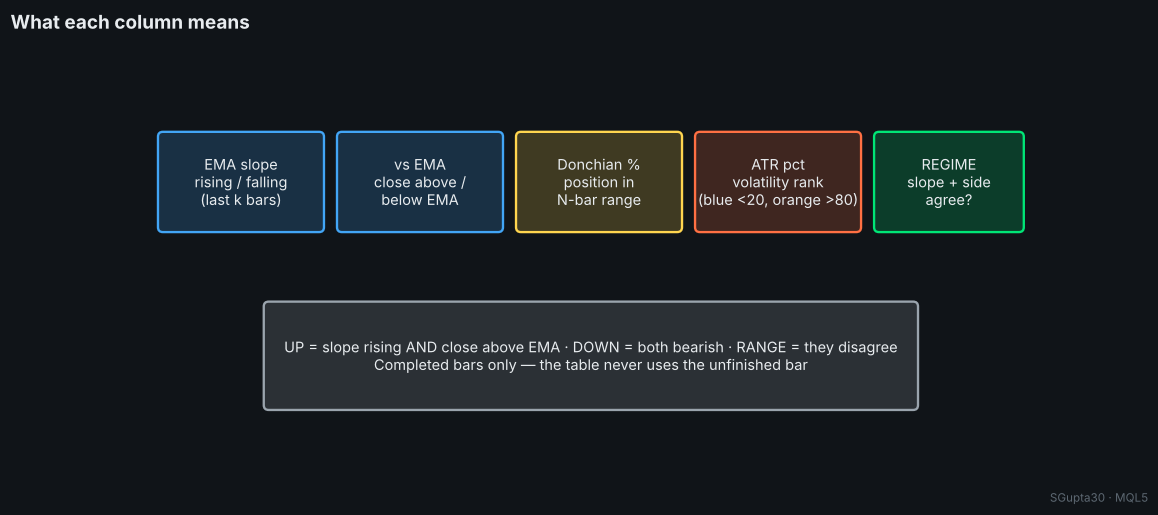
Trend-breakout systems earn most of their profit when the higher timeframes agree. A column of UP from H1 to MN1, with Donchian position near 100%, is the classic condition for long breakouts on gold. A mix of UP and DOWN tells you that the market is in a correction or a range, which is a reason to reduce risk or stand aside.
Inputs
| Input | Default | Description |
|---|---|---|
| Trend EMA period | 100 | EMA on every timeframe |
| EMA slope look-back | 3 | Completed bars for the slope |
| Donchian length | 50 | Range for the position % |
| ATR percentile look-back | 250 | Bars for the volatility rank |
| X / Y offset, corner | 12 / 24, right upper | Layout |
| Background | dark | Panel colour |
Implementation notes
- Uses one EMA and one ATR handle per timeframe and refreshes every 5 seconds.
- Reads completed bars only (shift 1), so the table never changes on the forming bar.
// regime rule used by the dashboard int regime = (slope>0 && close>ema) ? 1 : ((slope<0 && close<ema) ? -1 : 0); // UP / DOWN / RANGE
Author: Shipra Gupta (SGupta30) · the author's gold trend EAs use this kind of higher-timeframe regime filter.
 Breakeven and R-Trail Manager — break-even at +1R and R-multiple trailing for any trade
Utility EA that moves the stop to break-even plus a small lock once a trade reaches +X R, then trails it N R behind price. Manual trades or any EA by magic number. Never opens trades and never widens a stop.
ATR Trailing Stop Line (Chandelier Exit)
ATR Trailing Stop Line (Chandelier Exit): a volatility-based trailing stop that hangs below the highest high in an up-trend and rises above the lowest low in a down-trend, with trend-flip arrows, an on-chart status label and optional alerts.
Range Filter Buy and Sell
A faithful MetaTrader 5 port of the TradingView "Range Filter Buy and Sell 5min" (DonovanWall / guikroth / tvenn): range filter line, target bands, Buy/Sell arrows and bar colors, no repainting, alerts (popup, sound, push, e-mail) and a signal statistics panel.
Tester vs Live Trade Matcher
A free, read-only MetaTrader 5 utility: it reads a Strategy Tester report (MT5 or MT4 .htm) and matches every backtest trade with your account history or with a second report. It shows the match rate, missed and extra trades, slippage, delay, real costs and how much of the backtest edge survives live.