 MetaTrader 5
 Sistemi Esperti
 Indicatori
 Script
 Librerie
 Archiviazione
Guarda come scaricare robot di trading gratuitamente
Ci trovi su Twitter!
Unisciti alla nostra fan page
Unisciti alla nostra fan page
Ti è piaciuto lo script? Provalo nel Terminale MetaTrader 5

Kaufman Adaptive Moving Average (KAMA) Ribbon - indicatore per MetaTrader 5

- Visualizzazioni:
- 69
- Pubblicato:
-
 Ti stai perdendo delle opportunità di trading:
- App di trading gratuite
- Oltre 8.000 segnali per il copy trading
- Notizie economiche per esplorare i mercati finanziari
Registrazione AccediAccetti la politica del sito e le condizioni d’uso
Se non hai un account, registrati -
 Hai bisogno di un robot o indicatore basato su questo codice? Ordinalo su Freelance
Vai a Freelance

KAMA Ribbon
The idea behind it
Perry Kaufman's Adaptive Moving Average (KAMA) changes its own speed depending on market conditions. It measures the Efficiency Ratio (ER): the net price change over N bars divided by the sum of all bar-to-bar changes over the same N bars. ER is close to 1 when price moves in a straight line and close to 0 when it moves sideways with a lot of noise. The ER then sets the smoothing constant between a fast and a slow EMA. In a clean trend KAMA follows price closely, and in a choppy range it almost stops moving.
A single KAMA depends heavily on the ER period N. This indicator draws several KAMA lines at once. The first one uses a short ER period and each following one uses a longer period (by default 5, 8, 11 ... 26). Because every line measures "trendiness" over a different window, the ribbon shows how a trend develops across several horizons: lines fan out and line up when the move is persistent, and bunch together or cross when the market is ranging or turning.
Everything is calculated from the standard KAMA formula:
ER = |P[i] - P[i-N]| / Sum(|P[k] - P[k-1]|, N bars) SC = (ER * (2/(Fast+1) - 2/(Slow+1)) + 2/(Slow+1))^2 KAMA = KAMA[prev] + SC * (P[i] - KAMA[prev])
How to interpret it
- Ribbon lines – up to 8 KAMA lines. The fastest line (shortest ER period) is the brightest and thickest; the lines become darker gray as the ER period grows.
- Bullish ribbon – lines are fully ordered with the fastest line on top and the slowest at the bottom, and the ribbon is fanning out. This indicates a persistent up-move on all horizons.
- Bearish ribbon – the same order mirrored: the fastest line at the bottom and the slowest on top.
- Twisted or bunched ribbon – lines cross, overlap or flatten into a thin band. This is a range or a transition between trends. Adaptive lines hardly move in noise, so a flat, tight ribbon is a useful "stay out" sign.
- Ribbon width – the distance between the fastest and the slowest line. A widening ribbon means a strengthening trend; a narrowing one means the trend is fading.
- Status label – a text label (default: upper left corner) shows BULL, BEAR or MIXED and the ribbon width in points. It is evaluated on the last closed bar, so it does not flicker while the current bar is forming. BULL/BEAR require a strict ordering of all lines.
The indicator draws only in the main chart window. The values of all lines are available in the Data Window and through iCustom() (buffers 0–7, from the fastest to the slowest line).
External variables (inputs)
| Input | Default | Purpose |
|---|---|---|
| InpRibbonCount | 8 | Number of KAMA lines in the ribbon (1–8). Unused plots are hidden. |
| InpFirstER | 5 | Efficiency Ratio period of the first (fastest) line. |
| InpERStep | 3 | Increment of the ER period for every next line. With the defaults the periods are 5, 8, 11, 14, 17, 20, 23, 26. |
| InpFastPeriod | 2 | Period of the fast EMA: the upper limit of adaptation, used when ER = 1. |
| InpSlowPeriod | 30 | Period of the slow EMA: the lower limit of adaptation, used when ER = 0. Must be greater than InpFastPeriod. |
| InpPrice | PRICE_CLOSE | Applied price used for the calculation. |
| InpShowStatus | true | Show or hide the on-chart status label. |
| InpCorner | CORNER_LEFT_UPPER | Chart corner in which the status label is placed. |
| InpStatusColor | clrWhite | Color of the status label text. |
Invalid parameters (for example a count outside 1–8 or a slow period not greater than the fast period) stop the initialization and a message is printed to the Experts tab.
Recommended use
- Symbols and timeframes – the indicator works on any symbol and timeframe. The ER approach is most informative on M15–D1 charts of liquid instruments, where the difference between trend and noise is clear. On very low timeframes spread and tick noise keep ER low and the lines flat.
- Trend filter – use the BULL/BEAR/MIXED state as a filter for your own entries: trade pullbacks to the ribbon in the direction of an ordered, widening ribbon and avoid trading while it is twisted.
- Tuning – a larger InpERStep spreads the ribbon over more horizons, a smaller one gives a denser band. A smaller InpFastPeriod makes lines react faster in strong trends; a larger InpSlowPeriod makes them flatter in ranges.
- Caveats – KAMA is a lagging, non-repainting-on-closed-bars indicator: the values of the forming bar change with each tick, closed bars do not change. The ribbon does not provide entry signals by itself and should be combined with risk management and other analysis.
- Account types – the indicator only reads price data and does not trade, so it works the same on netting and hedging accounts.
- Performance – on the first run the whole history is calculated once; afterwards only the new and the forming bars are recalculated ( prev_calculated ). The chart label is created once and removed in OnDeinit() .
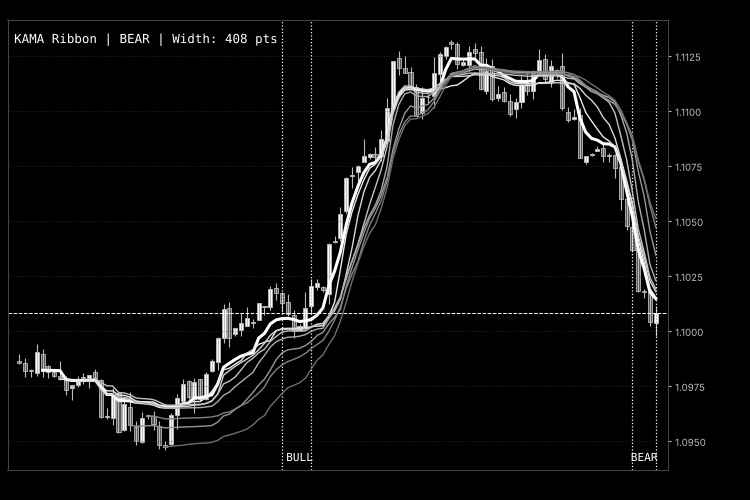
Fig. 1. KAMA Ribbon (8 lines) on a price chart; black & white image according to the Code Base image guidelines.
Hull Moving Average with Slope Color Change
Hull Moving Average that changes color with its slope: one color while the line rises, another while it falls, a neutral one when it is flat, with optional arrows at the turns.
 Gold Trend Breakout Lite — educational XAUUSD trend-following EA
Open-source gold EA built on XAUUSD's multi-day trend persistence: H1 Donchian breakout in the direction of the D1 EMA slope, 3×ATR hard stop, break-even at +1R. Fixed lot, one position, no grid, no martingale.
ATR Trailing Stop Line (Chandelier Exit)
ATR Trailing Stop Line (Chandelier Exit): a volatility-based trailing stop that hangs below the highest high in an up-trend and rises above the lowest low in a down-trend, with trend-flip arrows, an on-chart status label and optional alerts.
Breakeven and R-Trail Manager — break-even at +1R and R-multiple trailing for any trade
Utility EA that moves the stop to break-even plus a small lock once a trade reaches +X R, then trails it N R behind price. Manual trades or any EA by magic number. Never opens trades and never widens a stop.