 MetaTrader 5
 Sistemi Esperti
 Indicatori
 Script
 Librerie
 Archiviazione
Guarda come scaricare robot di trading gratuitamente
Ci trovi su Twitter!
Unisciti alla nostra fan page
Unisciti alla nostra fan page
Ti è piaciuto lo script? Provalo nel Terminale MetaTrader 5

RSI Pullback Zones Above Rising SMA - indicatore per MetaTrader 5
Kenichiro Sakamoto

Sono Kenichiro Sakamoto, lo sviluppatore di FXEA365, uno studio che crea Expert Advisor trasparenti e basati su regole per MetaTrader 5.
- Visualizzazioni:
- 78
- Pubblicato:
-
 Ti stai perdendo delle opportunità di trading:
- App di trading gratuite
- Oltre 8.000 segnali per il copy trading
- Notizie economiche per esplorare i mercati finanziari
Registrazione AccediAccetti la politica del sito e le condizioni d’uso
Se non hai un account, registrati -
 Hai bisogno di un robot o indicatore basato su questo codice? Ordinalo su Freelance
Vai a Freelance

The indicator plots a long-period simple moving average and marks pullbacks inside an uptrend. A mark is drawn when three conditions are true at the same time: the previous bar closed above the SMA, the RSI of the previous bar is at or below RSI_BuyLevel, and the SMA is higher than it was one bar earlier. The third condition can be switched off with RequireRising.
Marks are up arrows placed 0.1 percent below the low of the bar. The price and RSI conditions are read from the previous, already closed bar, so a mark does not appear and disappear because of price changes inside the current bar. Consecutive bars that meet the conditions are all marked, which shows the pullback as a zone and not as a single point.
The indicator looks at the upward direction only; there is no mirrored condition for downtrends. The default RSI level of 40 is higher than the classic level of 30 because the RSI of a market that stays above its long-term average seldom falls that far. The indicator needs at least TrendSMA + RSI_Period + 3 bars of history before it starts to draw.
Input parameters
- TrendSMA - period of the trend SMA (default 200).
- RSI_Period - RSI period (default 14).
- RSI_BuyLevel - RSI level; a pullback is an RSI value at or below it (default 40.0).
- RequireRising - mark pullbacks only while the SMA is rising (default true).
Buffers: 0 - trend SMA, 1 - pullback marks (0 where there is no mark). The indicator only displays information. It does not place or manage trades.
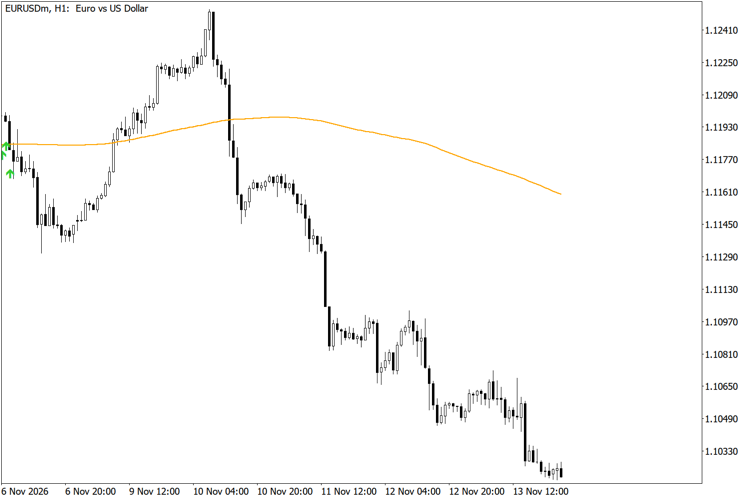
RSI pullback marks above the rising trend SMA on EURUSD H1
Bollinger Keltner Squeeze Release Arrows
Shows Bollinger bands and a Keltner channel on the chart, marks bars where the bands are inside the channel and draws an arrow when that squeeze ends.
Confirmed Swing Pivots with Trend MA
Marks swing highs and lows that are confirmed by a fixed number of bars on both sides and plots a simple moving average for trend context.
Trend Filtered Donchian Breakout Channel
Plots a Donchian channel and a long-period SMA and marks only those closed-bar channel breakouts that are on the same side of the SMA.
JONY ISLAM EMA Cluster Signals with Entry SL TP MTF Panel
JONY ISLAM EMA Cluster Signals is a technical indicator that plots a 4-EMA cluster cloud to identify trend direction. It generates Buy/Sell arrow signals and automatically calculates Entry, Stop Loss, and TP1-TP3 levels using ATR. It also features a built-in Multi-Timeframe (M1-W1) trend panel.