 MetaTrader 5
 Sistemi Esperti
 Indicatori
 Script
 Librerie
 Archiviazione
Guarda come scaricare robot di trading gratuitamente
Ci trovi su Telegram!
Unisciti alla nostra fan page
Unisciti alla nostra fan page
Ti è piaciuto lo script? Provalo nel Terminale MetaTrader 5

- Visualizzazioni:
- 30
- Pubblicato:
-
 Ti stai perdendo delle opportunità di trading:
- App di trading gratuite
- Oltre 8.000 segnali per il copy trading
- Notizie economiche per esplorare i mercati finanziari
Registrazione AccediAccetti la politica del sito e le condizioni d’uso
Se non hai un account, registrati -
 Hai bisogno di un robot o indicatore basato su questo codice? Ordinalo su Freelance
Vai a Freelance

MA Toolkit
The idea behind it
Moving averages are the building block of many trading tools, yet most traders only ever call a built-in function and never see how the numbers are produced. MA Toolkit calculates three classic averages by hand, so the code can serve as a clear example and as a base for your own indicators:
- SMA - the plain arithmetic mean of the last N prices.
- EMA - an exponential average that reacts faster by giving recent prices more weight through the smoothing factor 2 / (N + 1). Like the standard MetaTrader indicator, it starts from the first price of the history.
- LWMA - a linear weighted average: the newest price has weight N, the oldest has weight 1.
Two averages are drawn at once (fast and slow), each with its own type and period. The indicator recalculates only new and forming bars, so it stays light on long histories.
How to interpret it
- Fast MA (thick solid line) - colored by slope: blue when rising, orange-red when falling, gray when flat (the change per bar does not exceed the flat-slope threshold). In Fig. 1 the line is shown in white only, because the figure is black and white.
- Slow MA (thin dashed line) - the longer-term reference line. It can be hidden with the "Show the slow MA" input.
- Up arrow below a bar - the fast MA crossed above the slow MA on that bar (bullish crossover).
- Down arrow above a bar - the fast MA crossed below the slow MA on that bar (bearish crossover).
- Info panel (top-left corner) - the first line shows the selected MA types and periods; the second line shows whether the fast MA is above or below the slow MA and the current slope of the fast MA.
- Alerts - an optional pop-up alert is shown once per bar when the last closed bar contains a crossover. Alerts are never raised for historical bars.
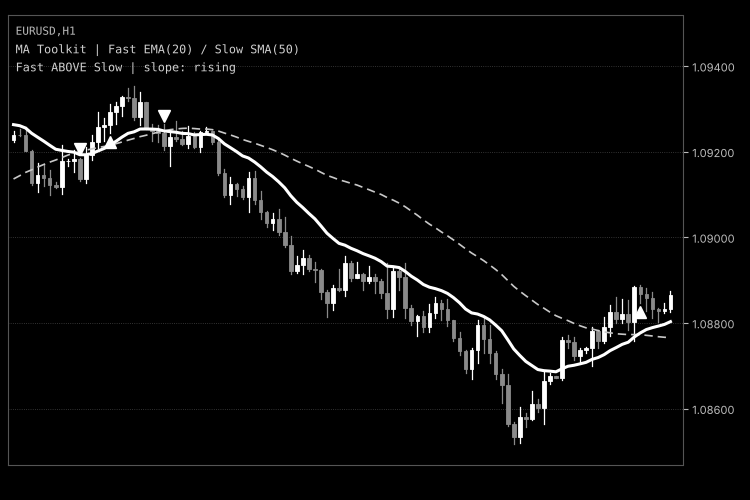
Fig. 1. MA Toolkit with a fast EMA(20), a slow SMA(50) and crossover arrows (black and white image, as required by the Code Base image guidelines).
External variables (inputs)
| Input | Default | Purpose |
|---|---|---|
| Fast MA: type (InpFastType) | EMA | Averaging method of the fast line: SMA, EMA or LWMA. |
| Fast MA: period (InpFastPeriod) | 20 | Number of bars of the fast line. Must be 2 or greater. |
| Slow MA: type (InpSlowType) | SMA | Averaging method of the slow line: SMA, EMA or LWMA. |
| Slow MA: period (InpSlowPeriod) | 50 | Number of bars of the slow line. Must be 2 or greater. |
| Applied price (InpPrice) | PRICE_CLOSE | Price used in the calculation: close, open, high, low, median, typical or weighted. |
| Flat-slope threshold (InpFlatThreshold) | 0.0 | Minimum change of the fast MA per bar, in points, to be considered rising or falling. Smaller changes are colored as flat. |
| Show the slow MA (InpShowSlow) | true | Shows or hides the slow line. It is still calculated for crossovers. |
| Show crossover arrows (InpShowCross) | true | Draws arrows where the fast MA crosses the slow MA. |
| Arrow offset from the bar (InpArrowOffset) | 20 | Distance, in points, between an arrow and the high or low of its bar. |
| Show the info panel (InpShowPanel) | true | Shows two text labels in the top-left corner of the chart. |
| Info panel text color (InpPanelColor) | Silver | Color of the info panel text. |
| Pop-up alert on crossover (InpAlertOnCross) | false | Shows an alert when the last closed bar contains a crossover. |
Recommended use
- The indicator works on any symbol and timeframe. It does not trade, so the account type (netting or hedging) does not matter.
- Typical starting points: a fast EMA of 10-20 with a slow SMA or EMA of 50-200. Shorter periods give more signals and more false ones.
- Moving average crossovers lag the price and tend to produce many false signals in a sideways market. Use the arrows as a trend-change hint, not as a stand-alone trading system, and confirm them with other tools.
- Arrows on the current (forming) bar may appear and disappear until the bar closes. Alerts use the last closed bar only.
- The EMA depends on the whole history it starts from, so its first values may differ slightly from the same indicator on a chart with a different amount of loaded history.
- The indicator needs at least the larger period plus two bars of history. All chart objects it creates (the info panel) are removed when the indicator is deleted.
 Round Numbers – automatic psychological thresholds
Horizontal lines at round figures around the displayed price, with a spacing that adjusts according to the zoom level.
 NY Open Candle: The Basics
A basic expert advisor that trades in the direction of the 9.30 am New York 5-minute candle on index CFDs (US100 / NAS100). One trade per day, fixed stop-loss and take-profit levels, forced closure; no martingale or grid strategy.
Accelerator Oscillator (AC)
The Acceleration/Deceleration Indicator (AC) measures acceleration and deceleration of the current driving force.
MACD Signals
Indicator edition for new platform.