 MetaTrader 5
 Sistemi Esperti
 Indicatori
 Script
 Librerie
 Archiviazione
Guarda come scaricare robot di trading gratuitamente
Ci trovi su Facebook!
Unisciti alla nostra fan page
Unisciti alla nostra fan page
Ti è piaciuto lo script? Provalo nel Terminale MetaTrader 5

Correlation Matrix Dashboard - indicatore per MetaTrader 5

- Visualizzazioni:
- 154
- Pubblicato:
-
 Ti stai perdendo delle opportunità di trading:
- App di trading gratuite
- Oltre 8.000 segnali per il copy trading
- Notizie economiche per esplorare i mercati finanziari
Registrazione AccediAccetti la politica del sito e le condizioni d’uso
Se non hai un account, registrati -
 Hai bisogno di un robot o indicatore basato su questo codice? Ordinalo su Freelance
Vai a Freelance

Correlation Matrix Dashboard
The idea behind it
Running three or four "different" pairs at once feels like diversification until you check whether they actually move independently. EURUSD and GBPUSD drift together more often than not, and gold has a habit of syncing up with risk-off FX moves exactly when you'd least expect it. Correlation Matrix Dashboard puts a live cross-pair correlation grid straight on the chart so that question has an answer at a glance, instead of a guess based on how the day "felt."
Each cell is the rolling Pearson correlation coefficient between two symbols in your basket, computed from closed-bar returns over a fixed lookback window. The matrix recalculates once per new bar — not on every tick — so it stays cheap to run and doesn't fight the terminal for CPU on a busy multi-chart setup.
How to interpret it
- Each row and column header is a symbol from your basket, in the order you listed them.
- Each off-diagonal cell holds the correlation coefficient (–1.00 to 1.00) between that row's symbol and that column's symbol over the lookback window.
- The diagonal is always "--" — a symbol against itself is a trivial 1.00 and adds nothing.
- Cell shading grades from gray (near zero, no real relationship) toward green as the pair moves together, and toward red as it moves inversely — the color is a faster read than the number alone.
- The grid is symmetric (row/column swapped gives the same value), which is expected — it's a visual confirmation the math is behaving, not a bug to fix.
- With alerts on, a crossing of your threshold prints to the Experts log and fires a terminal Alert() once, then re-arms only after the pair drops a defined margin back below the threshold — so a reading sitting right on the line doesn't spam you every bar.
External variables (inputs)
| Input | Default | Purpose |
|---|---|---|
| InpSymbolList | EURUSD,GBPUSD,USDJPY,XAUUSD | Comma-separated basket to correlate. Any symbol not found in the terminal is skipped with a log warning rather than failing the whole indicator. |
| InpTimeframe | PERIOD_CURRENT | Timeframe the return series is built from — independent of whatever timeframe the chart itself is showing. |
| InpLookbackBars | 100 | Rolling window length, in closed bars, used for every pairwise correlation. |
| InpRecalcEveryN | 1 | Recalculate every N new bars instead of every single one — set above 1 to lighten the load on a very large basket. |
| InpAlertOnThreshold | false | Enable a one-shot alert when any pair's |correlation| crosses InpAlertThreshold. |
| InpAlertThreshold | 0.80 | |r| level that triggers the alert. |
| InpAlertHysteresis | 0.05 | How far |r| must fall back below the threshold before that pair can alert again — stops repeat firing right at the boundary. |
| InpCornerX | 20 | Panel X offset in pixels from the chart's top-left corner. |
| InpCornerY | 20 | Panel Y offset in pixels from the chart's top-left corner. |
| InpCellSize | 55 | Width and height of each grid cell, in pixels. |
| InpLabelCol | 90 | Width reserved for the row-label column so longer symbol names don't get clipped. |
Recommended use
- Works on any symbol combination the broker exposes — FX, metals, crypto CFDs, indices — as long as each name resolves via Market Watch.
- Daily or H4 bars give the most stable, meaningful correlation reading; M1/M5 will be noisy and will flip sign more than the underlying relationship actually does.
- Pure visualization — it places no orders and holds no position, so it carries none of its own margin or stop-out risk and runs the same on any account type.
- A basket larger than six or seven symbols gets visually cramped fast — the grid scales as the square of the basket size, so widen InpCellSize or split into two charts rather than one giant matrix.
- Correlation computed from returns, not raw price, so it reads relationship-of-movement, not relative price level — two symbols at very different price scales still compare correctly.
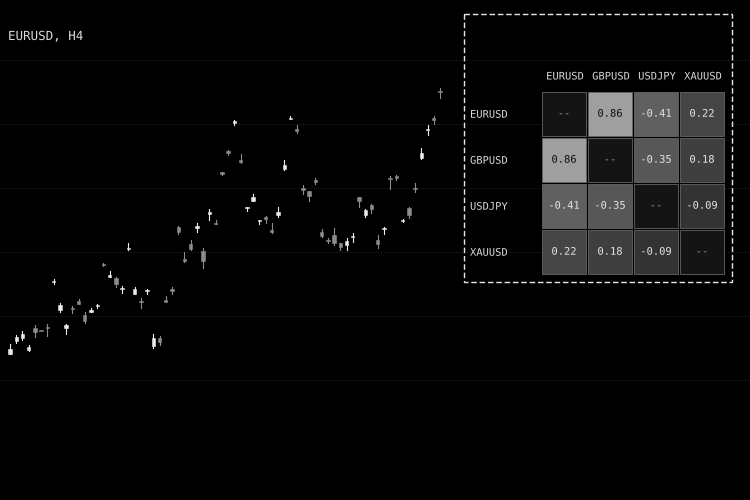
Fig. 1. Correlation Matrix Dashboard panel on an EURUSD chart (shown in black & white per Code Base image guidelines; on a live chart the grid is color-graded red-to-green).
 Common Folder Copier - copy positions between MT5 terminals on the same PC
Local MT5-to-MT5 trade copier through the Common files folder. One EA in Master or Slave mode: lot multiplier or fixed lot, symbol prefix/suffix, reverse, SL/TP and partial close sync.
Execution Quality Logger - slippage, fill delay and spread of every deal
Logs the slippage, fill delay and spread of every deal on the account (manual, EAs, SL/TP hits) to a CSV file and shows a live summary. It never trades.
Equity Drawdown Monitor
An animated chart panel that shows the equity drawdown of the account in real time, the closed result of the day, week and month, and one line for every Expert Advisor running on the account.
Trade Pad
An animated one-click trading panel for the chart symbol: buy and sell with live prices, lot stepper, close all, close profit, close loss and breakeven, with confirmations, a practice mode and a collapsible, draggable panel.