 MetaTrader 5
 Sistemi Esperti
 Indicatori
 Script
 Librerie
 Archiviazione
Guarda come scaricare robot di trading gratuitamente
Ci trovi su Twitter!
Unisciti alla nostra fan page
Unisciti alla nostra fan page
Ti è piaciuto lo script? Provalo nel Terminale MetaTrader 5

- Visualizzazioni:
- 93
- Valutazioni:
- Pubblicato:
-
 Ti stai perdendo delle opportunità di trading:
- App di trading gratuite
- Oltre 8.000 segnali per il copy trading
- Notizie economiche per esplorare i mercati finanziari
Registrazione AccediAccetti la politica del sito e le condizioni d’uso
Se non hai un account, registrati -
 Hai bisogno di un robot o indicatore basato su questo codice? Ordinalo su Freelance
Vai a Freelance


ATR Risk Planner answers the three questions you ask before every trade: where does the stop go, where are the targets, and how many lots can I trade for the money I am willing to lose?
It measures current volatility with the Average True Range (ATR), places the stop loss a set number of ATRs away from the entry, and lists targets as multiples of that risk (1R, 2R, 3R). It then uses the symbol's tick value and tick size from your broker to size the position, so the same panel works on gold (XAUUSD), oil (Brent/WTI), forex pairs and indices without any manual pip-value maths.
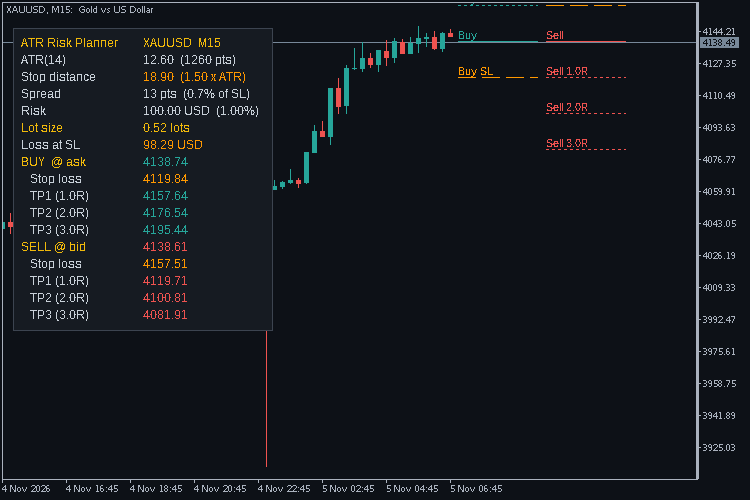
What the panel shows
- ATR value in price and points, on the chart timeframe or any timeframe you choose.
- Stop distance = ATR x multiplier (1.5 by default).
- Spread in points and as a percentage of the stop, turning red when it is too wide for the stop (10% by default), which is handy around news and the rollover hour.
- Risk in account currency: a percent of balance, a percent of equity, or a fixed amount.
- Lot size rounded down to your broker's volume step, plus the actual loss at SL for that rounded size. If even the minimum lot would risk more than you allowed, it says so instead of showing a size.
- Buy plan (entry at ask) and sell plan (entry at bid) with stop loss and up to three targets each.
On the chart
Short level lines with small tags mark the entry, stop and targets for each side to the right of the last candle, buy lines first and sell lines next to them so they never sit on top of each other. Lines can be turned off, or you can plan only the buy or only the sell side.
Notes
- Uses the ATR of the last closed bar by default, so levels don't jump around inside a candle.
- Lot size follows the broker's tick value for loss (SYMBOL_TRADE_TICK_VALUE_LOSS), so cross pairs and non-USD accounts are handled.
- The panel refreshes on every tick and once a second.
- Levels far from price may be outside the visible chart; scroll or zoom out to see all lines.
The indicator only reads prices and account values and draws objects. It never opens, modifies or closes trades. It is a planning aid, not a signal service, and it makes no promise about results.
Inputs
| Input | Default | Meaning |
| ATR timeframe | Current | Timeframe used for the ATR |
| ATR period | 14 | ATR length |
| Use ATR of last closed bar | true | false = live bar |
| Stop loss distance (x ATR) | 1.5 | Stop distance as a multiple of ATR |
| Target 1 / 2 / 3 (R multiple) | 1 / 2 / 3 | 0 hides a target |
| Risk mode | Percent of balance | Or percent of equity, or a fixed amount |
| Risk percent | 1.0 | Used by the percent modes |
| Risk amount | 50 | Used by the fixed mode, in account currency |
| Warn if spread exceeds % of SL | 10 | Spread row turns red above this |
| Sides to draw | Buy and sell | Or buy only, or sell only |
| Draw level lines on chart | true | Turn the chart lines off |
| Line length per side | 10 bars | Length of each level line |
| Panel corner / X / Y offset | Top left / 10 / 25 | Panel position |
| Font size | 9 | The panel scales with it |
| Colours | dark theme | Panel, text, buy, sell, stop and warning colours |
 MTF Trend Matrix
A compact dashboard that shows the EMA trend direction and ADX strength of several symbols across several timeframes at once.
Session Ranges + ADR Panel
Asian, London and New York session boxes with high/low range, plus a clean panel showing ADR, today's % of ADR, spread and time to candle close.
Spread and Swap Monitor
Shows the spread of every bar as a histogram with its average, flags unusually wide spreads, and lists the live spread, swap long/short, the triple-swap day and a bar countdown.
Candle Timer with Spread and Swap Countdown
Countdown to the close of the current bar, the live spread in points and the time left until the next server midnight, when brokers roll positions over and charge swap.