 MetaTrader 5
 Sistemi Esperti
 Indicatori
 Script
 Librerie
 Archiviazione
Unisciti alla nostra fan page

RealizedVol: range volatility estimators, realized variance and HAR forecasts - libreria per MetaTrader 5

- Prop Risk Guard: limiti di perdita giornaliera e drawdown per conti di prop firm
- TradeMirror: copiatore locale di operazioni tra conti MT5
- Visualizzazioni:
- 89
- Pubblicato:
-
 Ti stai perdendo delle opportunità di trading:
- App di trading gratuite
- Oltre 8.000 segnali per il copy trading
- Notizie economiche per esplorare i mercati finanziari
Registrazione AccediAccetti la politica del sito e le condizioni d’uso
Se non hai un account, registrati -
 Hai bisogno di un robot o indicatore basato su questo codice? Ordinalo su Freelance
Vai a Freelance
RealizedVol.mqh measures and forecasts volatility from prices. It has five estimators on OHLC bars (close to close, Parkinson, Garman-Klass, Rogers-Satchell and Yang-Zhang), the daily realized variance, bipower variation and realized quarticity from intraday bars (the bipower variation is the part of the variance without jumps), and the HAR model of Corsi (2009), the usual benchmark for forecasting realized volatility, with Newey-West standard errors. No DLL.
Usage
#include <RealizedVol\RealizedVol.mqh>

MqlRates d1[], m5[];
CopyRates(_Symbol, PERIOD_D1, 1, 21, d1);
CopyRates(_Symbol, PERIOD_M5, 1, 300 * 288, m5);
double yz = CRangeVolatility::Estimate(d1, 20, 20, RV_YANG_ZHANG);   // variance per day over the last 20 days
double vol = 100.0 * MathSqrt(yz * 252);                              // % a year
datetime days[];
vector rv, bv, rq;
int counts[];
CRealized::Daily(m5, days, rv, bv, rq, counts);                       // realized and bipower variance per day
CHar har;
if(har.Fit(rv, 5, true))                                              // HAR on log realized variance, 5 days ahead
  {
   double week = 100.0 * MathSqrt(har.Forecast() * 252);              // volatility expected over the next 5 days
  }
What is in it
- CRangeVolatility: Estimate() over any window of bars, Rolling() for every bar. The range estimators use the high and low of each bar and need 5 to 8 times fewer bars than close to close for the same precision; Rogers-Satchell is right with a drift, Yang-Zhang also counts the gaps between bars (weekend, overnight).
- CRealized::Daily: one value per day from intraday bars, with the returns inside each day only (the gap from the day before is left out), a shift for the start of the day and a minimum number of bars. Jump() gives the part of the variance above the bipower variation.
- CHar: the average realized variance of the next 1, 5 or 22 days regressed on the last day and the averages of the last 5 and 22 days, in levels or logs, with Newey-West standard errors, R squared and the forecast.
Example
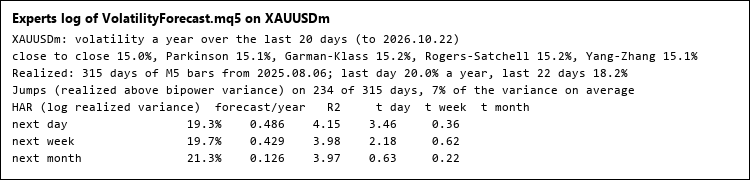
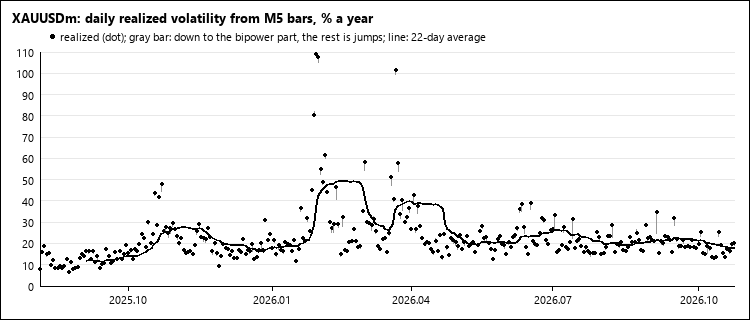
The script VolatilityForecast.mq5 prints the volatility of a symbol over the last 20 days by the five estimators, its realized volatility from M5 bars (last day and last 22 days), how much of it comes from jumps, and the HAR forecasts for the next day, week and month with their t statistics (picture 1). It can write the daily realized and bipower variances to a CSV file (picture 2).
Checked
- the five estimators with windows of 10, 20 and 60 bars on BTCUSDT D1 and XAUUSD H1 against an independent pandas version: within 4e-12;
- the daily realized variance, bipower variation and quarticity of 1 359 days from 391 271 M5 bars of BTCUSDT against pandas: the same days and counts, values within 2e-12 (4 ms for all the bars);
- 6 HAR fits (horizons 1, 5 and 22, levels and logs) against statsmodels OLS with HAC covariance: coefficients, standard errors, R squared and forecasts within 2e-12.
Files
RealizedVol.mqh goes to MQL5\Include\RealizedVol, VolatilityForecast.mq5 to MQL5\Scripts\RealizedVol.
Stationarity: KPSS, Phillips-Perron, DF-GLS, Zivot-Andrews and variance ratio tests
Five tests to tell a random walk from a mean-reverting series: KPSS, Phillips-Perron, DF-GLS, Zivot-Andrews with the break date, and the variance ratio.
 Risk Lot Calculator - lot size from your risk and stop (class for EAs + chart panel)
Drag the stop-loss line and read the lot size that risks exactly your money or percent. The CRiskSizer class does the same in an EA: lot rounded down, minimum lot never forced, max lot, volume limit, stop level and margin checked.
Accelerator Oscillator (AC)
The Acceleration/Deceleration Indicator (AC) measures acceleration and deceleration of the current driving force.
MACD Signals
Indicator edition for new platform.