 MetaTrader 5
 Sistemi Esperti
 Indicatori
 Script
 Librerie
 Archiviazione
Unisciti alla nostra fan page

BacktestOverfitting: probability of backtest overfitting (PBO) of an optimization - libreria per MetaTrader 5

Cosa faccio:
- Trasformo la tua strategia, il tuo script TradingView o le tue regole scritte in un Expert Advisor MT5 pulito
- Visualizzazioni:
- 47
- Pubblicato:
-
 Ti stai perdendo delle opportunità di trading:
- App di trading gratuite
- Oltre 8.000 segnali per il copy trading
- Notizie economiche per esplorare i mercati finanziari
Registrazione AccediAccetti la politica del sito e le condizioni d’uso
Se non hai un account, registrati -
 Hai bisogno di un robot o indicatore basato su questo codice? Ordinalo su Freelance
Vai a Freelance
BacktestOverfitting.mqh computes the Probability of Backtest Overfitting (PBO) of an optimization: how often the pass with the best result in one part of the history ends in the lower half of all passes in the other part. A high PBO means that the best pass of the optimization was mostly picked for its luck. The method is the combinatorially symmetric cross-validation of Bailey, Borwein, Lopez de Prado and Zhu (2017).
The library also collects what the method needs from an ordinary MT5 optimization: each pass sends its daily results as a frame from OnTester(), and OnTesterDeinit() puts them in one matrix when the last pass is done.
Usage
#include <BacktestOverfitting\BacktestOverfitting.mqh>

double OnTester()
  {
   double days[];
   CPboFrames::DailyResults(days);                        // closed results by day, Monday to Friday
   CPboFrames::Send(days, TesterStatistics(STAT_PROFIT));
   return(TesterStatistics(STAT_PROFIT));
  }

void OnTesterInit() {}

void OnTesterDeinit()
  {
   matrix results;                                        // one row per day, one column per pass
   ulong  passes[];
   double values[];
   CPboFrames::Collect(results, passes, values);
   SPboResult r;
   if(CPbo::Run(results, 16, r))                          // 16 blocks: 12 870 splits
      PrintFormat("PBO %.1f%%", 100.0 * r.pbo);
  }
How it works
- The days are cut into S blocks of equal length (the oldest days that do not fill a block are left out). Every way of taking S/2 blocks as the in-sample part and the other S/2 as the out-of-sample part is a split: C(16, 8) = 12 870 splits for S = 16.
- In each split the pass with the best in-sample Sharpe ratio (mean / standard deviation of the daily results; or the mean, with PBO_MEAN) is the one an optimization would choose. Its rank among all passes out of sample gives w = rank / (N + 1) and the logit ln(w / (1 - w)). PBO is the share of splits with a logit at or below 0, that is with the chosen pass at or below the out-of-sample median.
- SPboResult also gives the share of splits where the chosen pass loses out of sample, and the line of its out-of-sample Sharpe against its in-sample Sharpe (a slope below 0 means a better in-sample result comes with a worse out-of-sample result). The logits and both Sharpe ratios of every split are in the arrays, for a histogram or a scatter plot.
- Sums of every block are computed once and the splits add them up, so 12 870 splits of 120 passes take about 40 ms.
- DailyResults() takes the deals of the test from the first deposit to the last day, Monday to Friday; a deal on a Saturday or Sunday counts on the Friday before. All passes therefore have the same days. With percent = true the results are in percent of the balance before the first trade of the day.
- Passes read from the optimization cache do not run OnTester() and send nothing. Delete the cache (Tester\cache) before an optimization that should be measured.
Example
PboExample.mq5 is a moving average cross. Optimize the two periods with "Slow complete algorithm"; at the end the Experts log shows the PBO, the share of losing splits, the line of out-of-sample against in-sample Sharpe, the best pass on the whole period, and the days and splits are saved to Common\Files\PBO for your own charts (picture 1).
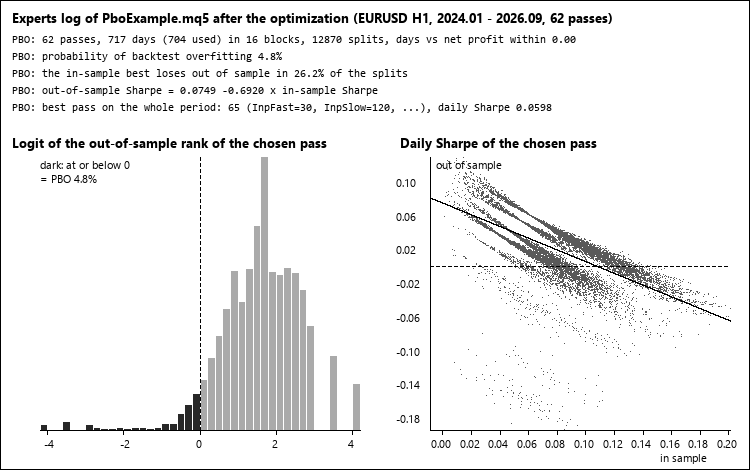
On EURUSD H1 from January 2024 to September 2026 (62 valid passes) the PBO was 4.8%: the slow averages were chosen in most splits and stayed in the upper half out of sample. The pass chosen still lost out of sample in 26% of the splits, and the slope of -0.69 shows that a higher in-sample Sharpe came with a lower one out of sample. A low PBO says the ranking of the passes holds, not that the best pass makes money.
Checked
Against an independent Python version (itertools, numpy, scipy) on a matrix of 1 003 days and 120 columns, with duplicate columns and one column without trades: with S = 16, 10, 8 (PBO_MEAN) and 4, the chosen column was the same in every split, the logits agreed within 5e-13, and the PBO, the share of losses and the line were the same. The days saved by PboExample after the optimization gave the same 12 870 logits in Python, and the daily results of every pass add up to its net profit.
DrawdownBootstrap: Monte Carlo of the maximal drawdown
Block bootstrap of daily results: how deep the drawdown of an account or strategy can get over the next months, with percentiles and a seeded generator for repeatable runs.
PortfolioWeights: risk parity, HRP, minimum variance and maximum diversification
Portfolio weights from the returns of symbols or Expert Advisors: inverse volatility, risk parity, hierarchical risk parity, minimum variance, maximum diversification, Ledoit-Wolf covariance.
 Accelerator Oscillator (AC)
The Acceleration/Deceleration Indicator (AC) measures acceleration and deceleration of the current driving force.
MACD Signals
Indicator edition for new platform.