 MetaTrader 5
 Sistemi Esperti
 Indicatori
 Script
 Librerie
 Archiviazione
Unisciti alla nostra fan page

RSI2 Mean Reversion arrows with trend filter - indicatore per MetaTrader 5

- Visualizzazioni:
- 7
- Pubblicato:
-
 Ti stai perdendo delle opportunità di trading:
- App di trading gratuite
- Oltre 8.000 segnali per il copy trading
- Notizie economiche per esplorare i mercati finanziari
Registrazione AccediAccetti la politica del sito e le condizioni d’uso
Se non hai un account, registrati -
 Hai bisogno di un robot o indicatore basato su questo codice? Ordinalo su Freelance
Vai a Freelance
Hai bisogno di un robot o indicatore basato su questo codice? Ordinalo su Freelance
Vai a Freelance

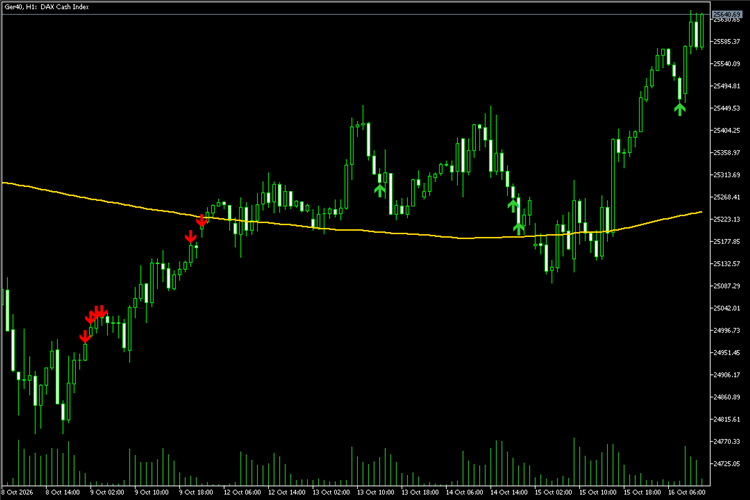
RSI2Reversion draws a buy arrow when the RSI with a very short period (default 2) falls below the oversold level while price is above a long simple moving average (default 200), and a sell arrow when the RSI rises above the overbought level while price is below the average. The idea is to look for short pullbacks inside the main trend.
What it draws:
- The long moving average used as trend filter
- A green arrow for an oversold pullback in an uptrend
- A red arrow for an overbought bounce in a downtrend
Inputs: RSI period, oversold and overbought levels, trend average period, popup alert, bars to calculate.
Notes:
- Arrows are drawn only on closed candles, so they do not repaint
- Works on any symbol and timeframe. Short-term reversion is usually discussed for stock indices
- It is an information tool, not a trading system: test it on history and on a demo account before relying on it, it does not promise any profit
How to use: copy RSI2Reversion.mq5 into MQL5\Indicators (File - Open Data Folder), compile it in MetaEditor and drag it onto a chart. H1 or D1 on an index is a good starting point.
Relative Volume - intraday volume against the same time of day
Tick volume of each bar divided by its average at the same time of day over the last days.
Auto Fib Swing - Fibonacci levels on the last swing
Detects the last confirmed swing leg and draws its Fibonacci retracement and extension levels.
Index Gap Marker - daily opening gaps and fill status
Marks the daily opening gaps of stock indices and shows whether each one has been filled.
 Equity Guard - daily loss, max drawdown and profit target lock
Closes all trades and keeps the account flat when the daily loss limit, the maximum drawdown or a daily profit target is reached. Prop-firm style rules, an on-chart panel, and a state that survives terminal restarts.