 MetaTrader 5
 Sistemi Esperti
 Indicatori
 Script
 Librerie
 Archiviazione
Unisciti alla nostra fan page

Fractal Dimension Trend Strength Index - indicatore per MetaTrader 5

- Visualizzazioni:
- 96
- Valutazioni:
- Pubblicato:
-
 Ti stai perdendo delle opportunità di trading:
- App di trading gratuite
- Oltre 8.000 segnali per il copy trading
- Notizie economiche per esplorare i mercati finanziari
Registrazione AccediAccetti la politica del sito e le condizioni d’uso
Se non hai un account, registrati -
 Hai bisogno di un robot o indicatore basato su questo codice? Ordinalo su Freelance
Vai a Freelance
Hai bisogno di un robot o indicatore basato su questo codice? Ordinalo su Freelance
Vai a Freelance
The idea behind it
Most trend/range filters (ADX, choppiness index, efficiency ratio) look at how far price has traveled relative to how much ground it covered. This indicator takes a different angle borrowed from fractal geometry: a price curve that moves cleanly in one direction has a low fractal dimension, close to that of a straight line (1.0), while a curve that whipsaws back and forth fills more "space" and has a higher fractal dimension, approaching 2.0. The calculation is a simplified version of Katz's fractal dimension method: over a rolling window of InpFractalPeriod bars, it sums the total path length walked by price (the sum of bar-to-bar absolute changes) and compares that to the maximum displacement from the window's starting price. A tight ratio between those two numbers (the price traveled far with little backtracking) produces a dimension near 1.0; a loose ratio (price traveled a long path but ended up close to where it started) pushes the dimension toward 2.0.
The raw per-bar value is noisy, so it is smoothed with an EMA (InpSmoothPeriod) before being plotted. The indicator is designed to sit in a separate subwindow, with the line colored against two configurable thresholds: below InpTrendThreshold the market is classified as trending, above InpChopThreshold it is classified as choppy. It works on any symbol and timeframe, but behaves most consistently on liquid instruments and intraday timeframes such as EURUSD on an M15 chart, where enough bars accumulate inside a session to make the rolling window meaningful.
How to interpret it
- Fractal Dimension line — the single plotted line, bounded between 1.0 and 2.0. Falling values mean price is moving more efficiently in one direction; rising values mean price is covering ground without making net progress.
- Katz-style calculation — for each bar, the indicator measures the total absolute price path over the lookback window and the maximum distance from the window's first price, then derives the dimension from the logarithmic ratio of those two quantities. EMA smoothing (InpSmoothPeriod) removes bar-to-bar jitter without materially lagging genuine regime changes.
- Color / zone logic — the line is drawn in one of three states: trending (value at or below InpTrendThreshold), choppy (value at or above InpChopThreshold), or neutral/transition (between the two). Crossing from the choppy zone down through the neutral band into the trending zone is the earliest signal that a directional move is taking hold.
- Practical usage — use the trending zone as a filter to enable trend-following entries (breakouts, moving-average crosses, momentum signals) and suppress them in the choppy zone, where mean-reversion or range-trading approaches tend to perform better. It is a regime filter, not a standalone entry signal, and works best paired with a directional tool that tells you which way to trade once the regime is confirmed trending.
External variables (inputs)
| Input | Default | Purpose |
|---|---|---|
| InpFractalPeriod | 30 | Rolling lookback window (in bars) used to compute the Katz-style fractal dimension for each bar. |
| InpSmoothPeriod | 5 | EMA smoothing period applied to the raw fractal dimension values to reduce bar-to-bar noise. |
| InpTrendThreshold | 1.40 | Smoothed FD value at or below this level is classified as a trending market and colored accordingly. |
| InpChopThreshold | 1.65 | Smoothed FD value at or above this level is classified as a choppy/ranging market and colored accordingly. |
| InpAppliedPrice | PRICE_CLOSE | Price series used in the fractal dimension calculation (close, open, high, low, median, typical, or weighted). |
Recommended use
Add the indicator to its own subwindow and leave the two threshold levels (1.40 / 1.65) visible as dotted reference lines so the current regime is obvious at a glance. On intraday charts, pair it with a directional trend tool (moving average slope, MACD, or a breakout system) and only act on that tool's signals while the Fractal Dimension line is in or crossing into the trending zone; stand aside or switch to a range-trading approach while it sits in the choppy zone. Because the calculation depends on the lookback window, avoid very short InpFractalPeriod values (below 15-20) on noisy symbols, since the dimension estimate becomes unstable with too few points; widen the window on faster timeframes and narrow it on slower ones to keep the signal responsive without being erratic.
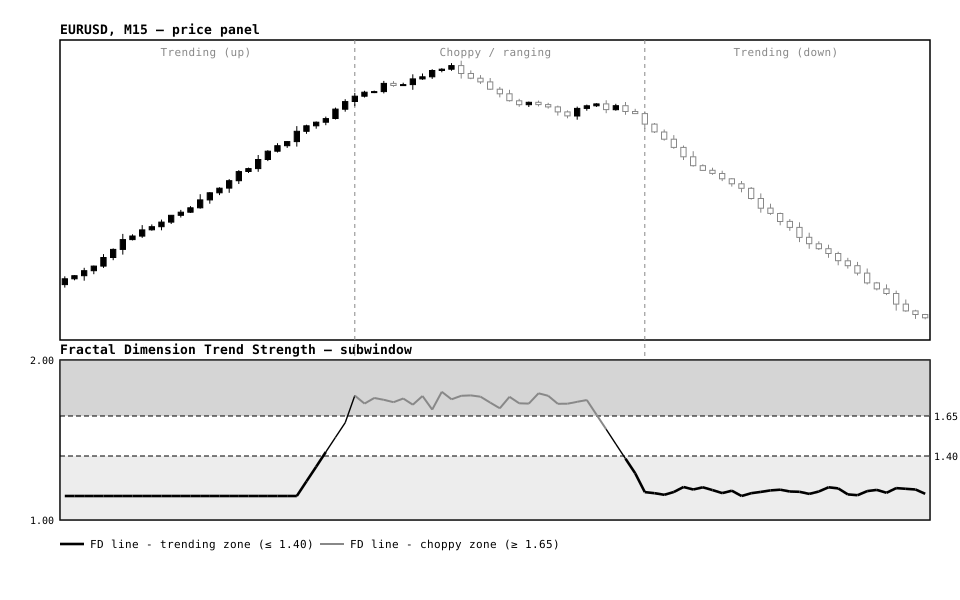
Fig. 1. Price panel (top) moving through a trending-up phase, a choppy/ranging phase, and a trending-down phase, against the Fractal Dimension Trend Strength subwindow (bottom). The line runs low and dark through both trending phases, rises above the 1.65 threshold and turns light gray through the choppy phase, and the two dashed levels mark the 1.40 trend and 1.65 chop boundaries.
Risk Calculator Panel with Draggable SL and TP Lines
Position size calculator for MT5. Drag the SL and TP lines on the chart and the panel shows the lot size for your risk %, the real risk after rounding, the reward and R:R. Never trades.
Volatility-Adjusted Momentum Decay Line
A momentum oscillator that relaxes back toward zero at a speed set by the current ATR relative to its own moving average, so decay speed adapts automatically to whether the market is calm or volatile.
 BotGuard - Terminal Health Heartbeat for VPS Monitoring
A lightweight, non-trading Expert Advisor that writes a JSON health heartbeat (connection, AutoTrading state, equity, daily P/L) and an equity log, so a VPS watchdog can detect frozen or disconnected terminals and alert you.
Prop Firm Equity Guard - Daily Loss Limit and Max Drawdown Protection
Closes all trades and blocks new ones when the daily loss limit, maximum loss or profit target is reached. Built for prop firm challenges. Works with manual trading and any other EA.