 MetaTrader 5
 Sistemi Esperti
 Indicatori
 Script
 Librerie
 Archiviazione
Unisciti alla nostra fan page

Prop Firm Daily Loss Tracker - Daily Loss Limit Monitor - indicatore per MetaTrader 5

nella specifica, e lo collaudo prima di consegnarlo.
COSA REALIZZO
- Expert Advisor per MT4 e MT5, su singolo simbolo o su piu' mercati
- Indicatori, script, pannelli
- Visualizzazioni:
- 57
- Valutazioni:
- Pubblicato:
-
 Ti stai perdendo delle opportunità di trading:
- App di trading gratuite
- Oltre 8.000 segnali per il copy trading
- Notizie economiche per esplorare i mercati finanziari
Registrazione AccediAccetti la politica del sito e le condizioni d’uso
Se non hai un account, registrati -
 Hai bisogno di un robot o indicatore basato su questo codice? Ordinalo su Freelance
Vai a Freelance
Hai bisogno di un robot o indicatore basato su questo codice? Ordinalo su Freelance
Vai a Freelance
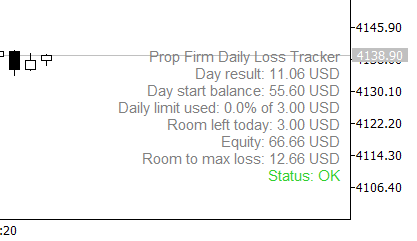
Prop Firm Daily Loss Tracker
A small on-chart panel that tracks how much of the daily loss limit of a funded / prop firm account is already used. It is a monitor only: it gives no signals and places no orders.
What it shows:
Day result in account currency (closed trades plus floating).
Day start balance.
Percent of the daily loss limit used.
Room left today and room left to the max total loss.
Current equity and a status line: OK, WARNING or LIMIT REACHED.
How it works:
Day result = closed result of the day + (equity - balance).
Daily limit = account size x daily loss percent.
Max loss floor = account size x (1 - max loss percent).
The day starts at the server hour you choose in the inputs. Deposits and withdrawals are excluded from the day result.
When the used share of the daily limit reaches the warning level, and again when it reaches 100%, the indicator shows one alert per day. A push notification can be enabled.
Inputs:
Account size, daily loss limit (%), max total loss limit (%).
Server hour when the trading day starts.
Warning level (%), popup alert, push notification.
Panel corner, font size, text color.
Notes:
The loss limits are values you set to match your own prop firm rules, including how your firm counts the day. Always check them against the rules of your firm.
Set the account size to the starting balance of your challenge or funded account. If it is far from the real account, the max loss line will not make sense.
The day start balance is calculated from the account history, so the history should be loaded in the terminal.
Works on any symbol. The panel refreshes on ticks.
Market Behavior Analyzer: Swing Structure and Market Context
The Market Behavior Analyzer is a practical indicator designed to make market structure easier to read directly from the chart. It identifies significant swing points, classifies them as Higher Highs, Higher Lows, Lower Highs, and Lower Lows, and tracks the movement between them in pips. It also provides a Market Story panel and an interactive Swing Inspector for examining impulses, pullbacks, retracements, swing duration, and the developing market structure.
 History Integrity Auditor
Audits the bar history your terminal actually holds, which is the history every backtest and every indicator reads. Six checks per symbol: impossible OHLC values, broken bar times, bars missing while the broker's own session table says it was quoting, empty and flat bars, bars that disagree with the broker's own M1 series, and spread sanity. The headline figure is session coverage, not a grid percentage that mostly measures how many weekends you audited. Every finding goes to CSV with its bar time, and the audited bars plus the session table can be dumped so the whole report can be recounted by something other than this tool.
 Edge or Luck: bootstrap test of your average trade
Resamples your closed trades 10,000 times to show whether your average trade is an edge or could still be luck: the 95% range of the average and the chance it is below zero.
MACD Signals
Indicator edition for new platform.