MintyGrid
- Experts
- Version: 10.2
- Mise à jour: 7 octobre 2026

MintyGrid keeps a basket of buys and a basket of sells open on the same symbol. When price moves against a basket, it adds a level one ATR step further away. The lot of each new level is worked out from the basket's drawdown at that moment, so that price coming back to the previous level brings the whole basket into profit. Once a basket reaches its profit target, half of the target is locked in and a stop trails behind price, so good moves keep running.
Read Risks before you run MintyGrid on real money. MintyGrid has no stop loss. A basket that runs out of grid levels is held until price comes back. Most of the time that ends in profit, but a long trend can take a large part of the account. No setting removes that risk; it is how grid strategies work.
How it works
- The grid follows volatility. The distance between levels is the ATR of the timeframe you choose (default: H3, 12 bars), measured when a basket opens. The basket keeps that step until it closes.
- Each basket is planned before it opens. MintyGrid simulates the whole ladder in advance, including spread and commission. It then picks the most levels, and the largest first lot, that keep the basket's loss at the end of the ladder within your Risk factor. It also checks that your margin can carry the full ladder. If the account is too small, deep levels are dropped. The early levels are never flattened to the minimum lot.
- Every level is sized from the live drawdown. When price reaches the next level, the lot is calculated from what the basket is losing right now: price, spread, commission and swap. The new lot is just big enough that price returning one step closes the whole basket at its target. There is no fixed multiplier. Lots grow only as fast as the drawdown does.
- Winners trail. At its target (one ATR step of profit on the first lot), every position in the basket gets a stop that locks half the target. The stop then trails one ATR step behind price. The broker holds these stops, so they work even while your terminal is offline.
- Losers are held. When a basket has used all its levels, it stops adding and waits for price to come back. If your margin cannot carry the next level, it holds without adding instead of risking a margin call.
- Buys stay below sells. A new basket only starts on the side where it does not overlap the other basket, so the price range between them is favourable to both.
- Broker limits are respected. A ladder is only planned if its total volume fits your broker's volume limit. A level that would break the limit is cut down or skipped, and a rejected order is retried after a pause, not on every tick.
Commission is not a setting. MintyGrid reads your broker's real round-trip cost per lot from your trade history.
Recommendations
Use a cent account with plenty of funds
This matters more than any setting.
MintyGrid's ladder roughly doubles at each level. With 12 levels, the last lot is about 2,500 times the first. Brokers only allow lots in steps of 0.01, so the first lot can never be smaller than 0.01. On EURUSD with a typical step, a 12-level ladder that starts at 0.01 lots plans a loss of about €13,000 at its end, and one that starts at 0.02 plans about €21,000. On a standard account this means:
- Small accounts cannot hold the full ladder. If the Risk factor doesn't cover a 0.01-lot ladder, MintyGrid drops deep levels. Fewer levels means less room before the ladder is full, so baskets get stuck holding far more often.
- Profits barely compound. The first lot can only jump from 0.01 to 0.02 when the balance roughly doubles. Until then every winning basket earns about the same amount, and the equity line grows in a straight line instead of curving upwards.
- Less room for drawdowns. A held basket needs free margin and equity to wait for price to come back. The more the account holds compared with the ladder, the more of a trend it can sit through.
On a cent account the balance is counted in cents, and the minimum lot moves about 100 times less money. A $1,000 deposit shows as 100,000 cents and is sized like a $100,000 standard account. MintyGrid can then:
- run the full ladder with real funds you can afford;
- grow its lots in fine steps as the balance grows, so profits compound;
- keep plenty of margin in reserve while a basket is held.
More funds still help on a cent account. The larger the balance compared with the ladder, the deeper and smoother the grid.
Don't run other EAs on the same account
MintyGrid plans every basket against the whole account: its balance, equity, used margin and free margin.
- Other EAs' losses shrink MintyGrid's room. A basket planned to hold its full ladder at a 10% Risk factor assumes the rest of the account is there to back it. If another EA is losing at the same time, the two drawdowns add up, and the account can reach a margin call that neither EA planned for.
- Other EAs' margin blocks the grid. Margin used by other trades can stop MintyGrid from adding a level when it needs to. A basket that cannot add levels recovers much more slowly.
- A margin call closes everything. If the broker stops out the account, it closes positions in its own order. That includes the other EA's trades, and it can leave one side of the grid open without the other.
Give MintyGrid an account of its own. If you trade more than one symbol with it, list them all in Symbols to trade in one copy of the EA, not in separate copies.
Other recommendations
- Account: hedging only. MintyGrid holds a basket of buys and a basket of sells on the same symbol at the same time, which a netting account cannot do. On a netting account MintyGrid does not trade; the panel says so.
- Symbol: EURUSD is the default and was one of the strongest symbols in our tests. Avoid CHF pairs (USDCHF, EURCHF, GBPCHF, AUDCHF, NZDCHF, CADCHF): the January 2015 Swiss franc shock wiped out the grid on every one of them in our simulation, even at a 10% Risk factor. The default 50% Risk factor is aggressive; lower it if you run symbols other than EURUSD. Backtest any other symbol over at least 10 years before using it.
- Timeframe: any. MintyGrid reads the ATR timeframe you set, not the chart's.
- VPS: recommended, so baskets are managed around the clock.
Settings
| Setting | Default | Description |
|---|---|---|
| Risk factor | 50% | How much of the balance one side's full ladder may be down at its last level. This sets the first lot and the number of levels. It is not a stop loss: past the last level, a basket is held. |
| Grid levels | 12 | Levels per side (up to 64). Fewer than 10 levels fill up quickly and get stuck in trends; 10–14 tested best. |
| ATR timeframe | H3 | Sets the distance between levels. A longer timeframe gives a wider grid that fills up less often but closes fewer cycles. |
| ATR period | 14 | Number of bars the ATR averages over. |
| Symbols to trade | EURUSD | Comma-separated list, e.g. EURUSD,AUDCAD . Each symbol runs its own grid. |
| Magic number | 777123 | Identifies MintyGrid's trades. Change it only if something else on the account already uses this number. |
The display needs no settings. On a live chart and in visual testing, MintyGrid switches the chart to a light theme and shows its panel and grid lines. In normal backtests and optimisation it draws nothing, so tests run faster.
On the chart
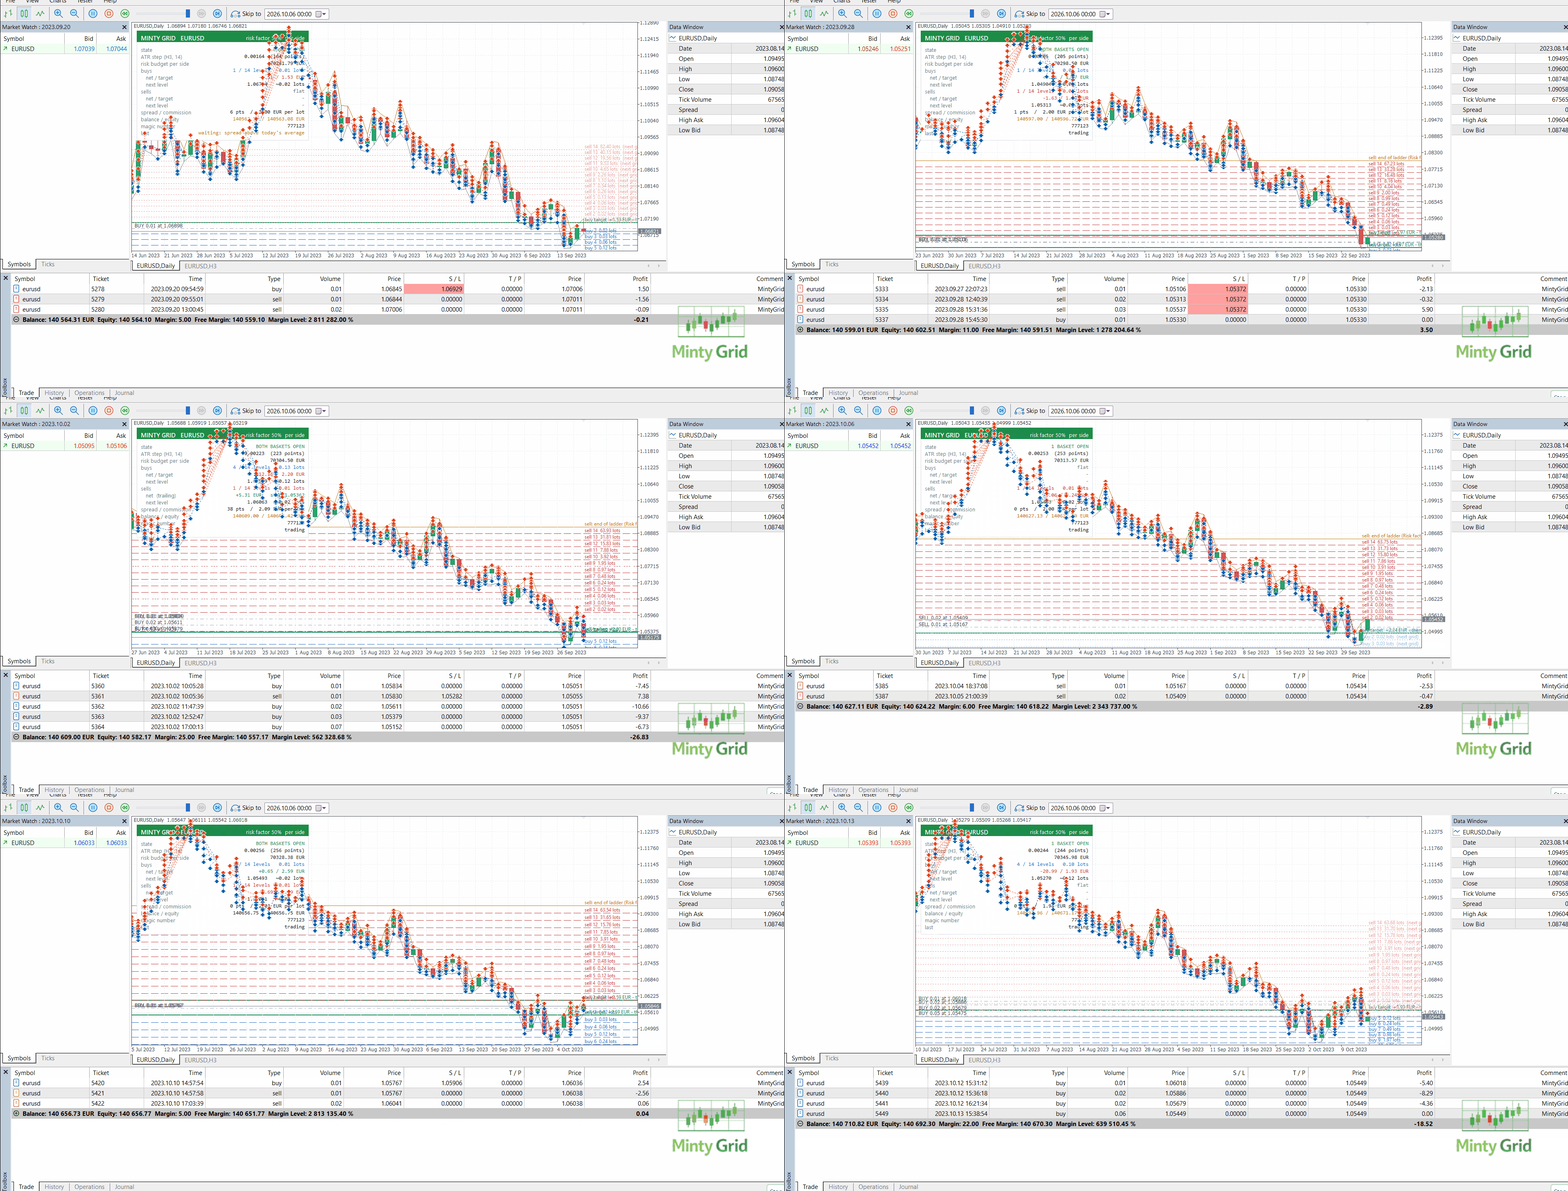
- Panel: for each side, the levels used, lots, net profit against target (or the trailing stop once it's active), and the next level's price and planned lot. It also shows the ATR step, the risk budget, spread and commission, balance and equity, and why it's waiting when it isn't opening anything.
- Grid lines:
- Dashed blue / red: the levels an open basket will still add, with their planned lots.
- Thick green: each basket's target. Once trailing starts, it becomes the trailing stop.
- Orange: the end of the ladder, where the basket's loss reaches the Risk factor.
- Light dotted: for a side with no open basket, the grid it would place right now.
Simulated results
The simulation uses broker H1 history from 2012 to 2026, recorded spreads and 1:500 leverage. It holds baskets exactly as MintyGrid does and ignores swap, so treat these numbers as optimistic.
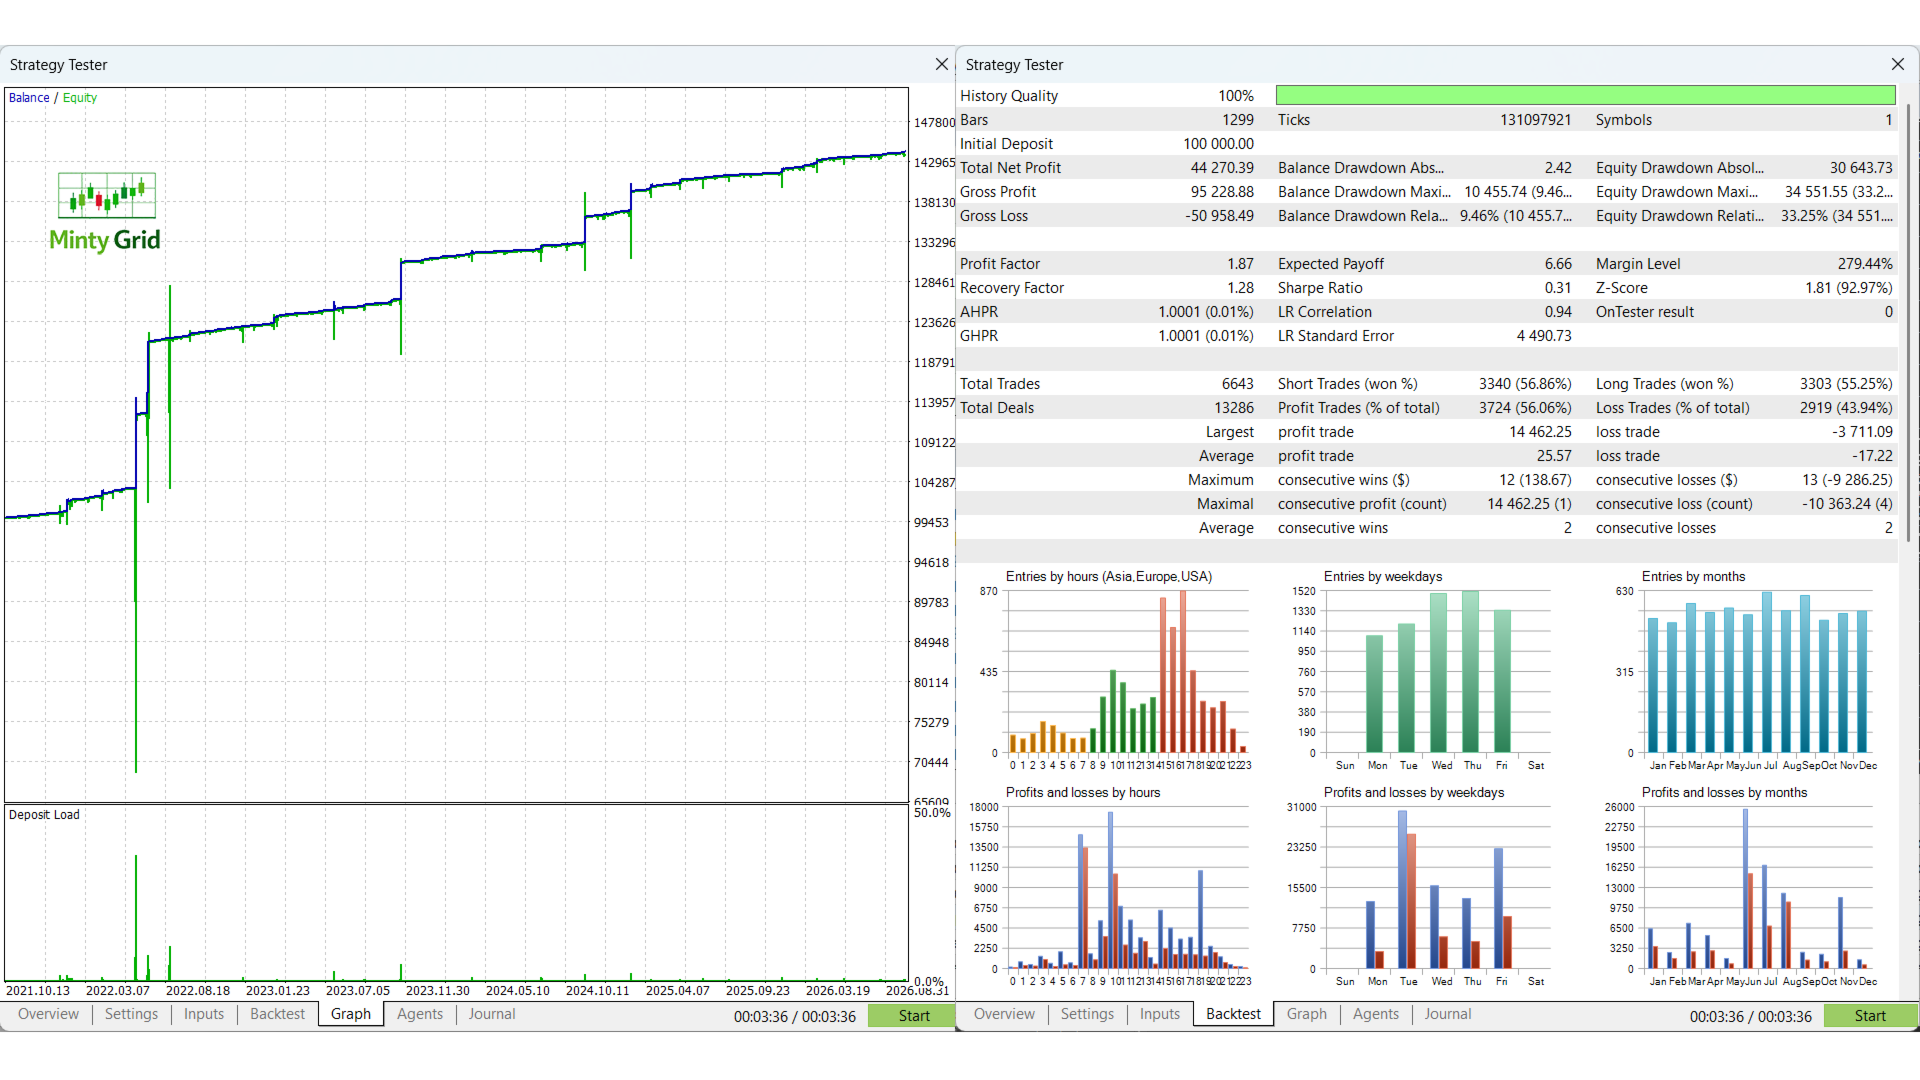
EURUSD, 12 levels, H3 ATR, from 100,000:
| Risk factor | 2012–2026 | Worst drawdown |
|---|---|---|
| 10% | 181,000 | 10% |
| 25% | 428,000 | 25% |
| 50% | 1,660,000 | 50% |
Across 33 symbols, 12 levels, H3 ATR, 2012–2026:
| Risk factor | Symbols wiped out | Median per year | Median worst drawdown |
|---|---|---|---|
| 10% | 5 of 33 (the CHF pairs) | +4.1% | 13% |
| 25% | 8 of 33 | +8.5% | 31% |
| 50% | 13 of 33 | +10.9% | 57% |
The same settings that grew EURUSD 16-fold wiped out 13 of 33 symbols. Choose your symbol and Risk factor with that in mind.
Risks: please read this part
- No stop loss. A basket at its last level is held until price comes back. In a long trend its loss keeps growing past the Risk factor. The Risk factor is the planned loss at the last level, not a limit.
- Large equity dips are normal. In a EURUSD test at a 50% Risk factor, equity fell to about two thirds of the balance while a basket was held, and later recovered. Expect dips of up to the Risk factor and beyond.
- Wipe-outs happen. A strong one-way move, or a price gap such as the 2015 Swiss franc shock, can take the whole account. Only trade money you can afford to lose. That is another reason for a cent account: you can run the full grid with a small real amount.
- Swap. Baskets held for weeks pay or earn swap every night. MintyGrid includes swap in every lot calculation and in the target, but long holds on high-swap symbols cost money.
- Past results don't guarantee future returns. Backtests and simulations show how the strategy behaved on past prices only. Trading involves risk.




































Danke für den tollen EA... läuft bisher einwandfrei