Cluster Intervals MT5
- Indicateurs
- Version: 2.7
- Activations: 5

MT4 version — https://www.mql5.com/en/market/product/70972
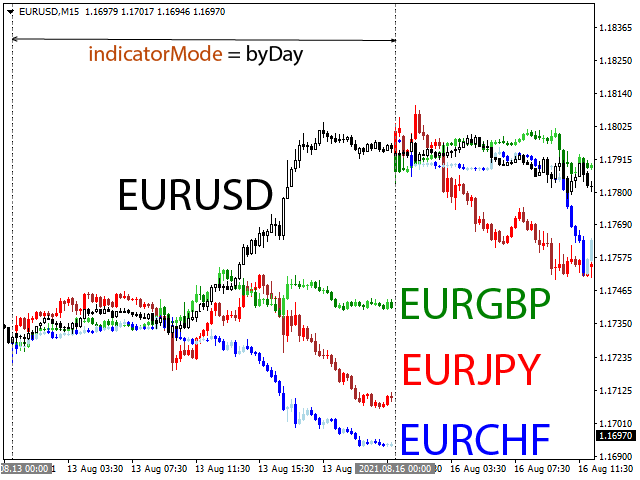
With this indicator, you will be able to observe the relative price changes of other instruments on the current chart.
Settings:
refreshEveryTick — updates every tick.
sym1 — The Name of the instrument. If empty or equal to "0", then it is ignored.
numberOfIntervals — number of intervals.
indicatorMode — display mode. Sets the value of each interval: by4h (4 hours), by6h (6 hours), etc. Mode byDeep - the interval is equal to the number of analyseDeep bars.
barOrLineWidthSym1 — line width.
colorUpSym1 — ascending line color.
colorDownSym1 — decreasing line color.
backgroundSym1 — show over the current chart (values 1 or 0).
periodSeparators — show period separators.
periodSeparatorsColor — period separators color.
uniquePrefix — unique prefix.
analyseDeep — analysis depth when indicatorMode = byDeep