Trend reversal lines

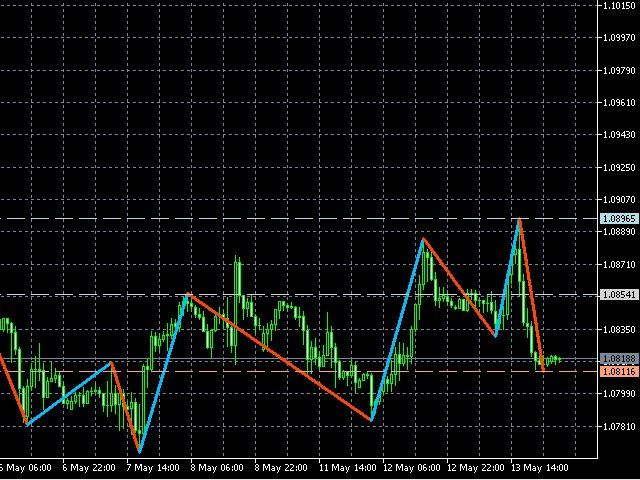
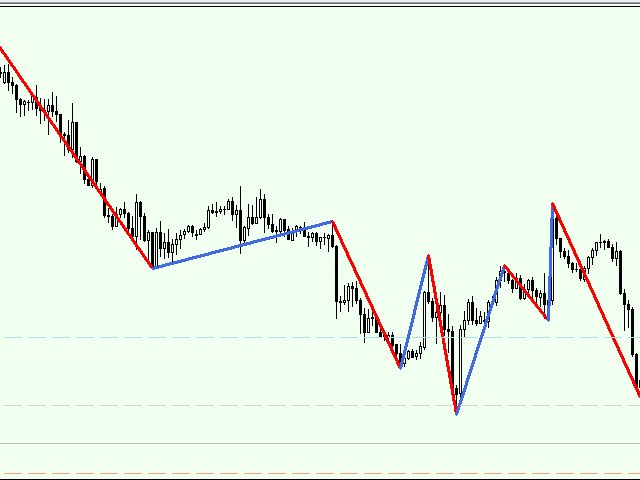
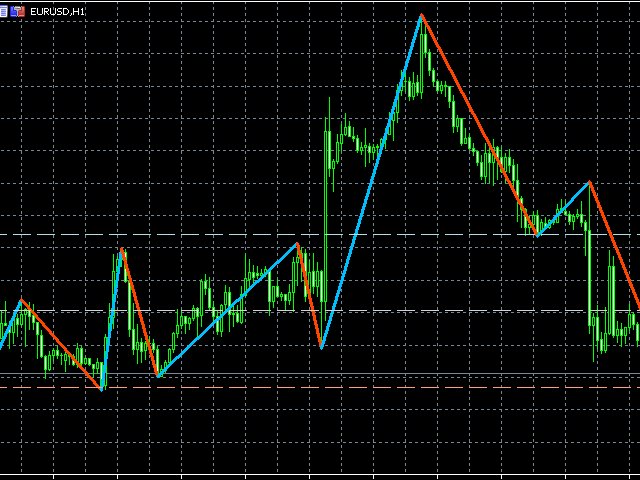
Trend indicator, draws 2 bars of different colors on the chart. A change of one lane to another signals a market reversal in the opposite direction. The indicator also places on the chart 3 parallel dashed lines High, Middle, Low line which show respectively the top, middle, bottom of the forming reversal.


Parameters

  • Depth - Depth of indicator calculation, the higher the parameter, the longer-term signals;
  • Deviation - Deviation of the indicator during drawing;
  • Backstep - The intensity of the display of turns, the less, the more intense.


* Trading strategy.

- When an ascending line is drawn, this is a buy signal;

- When a downward line is drawn, this is a sell signal.

Produits recommandés
Price Magnet — Price Density and Attraction Levels Indicator Price Magnet is a professional analytical tool designed to identify key support and resistance levels based on statistical Price Density. The indicator analyzes a specified historical period and detects price levels where the market spent the most time. These zones act as “magnets,” attracting price action or forming a structural base for potential reversals. Unlike traditional Volume Profile tools, Price Magnet focuses on price-time d
RBreaker
Zhong Long Wu
RBreaker Gold Indicators est une stratégie de trading intraday à court terme pour les contrats à terme sur l'or, qui combine deux approches : le suivi de tendance et le retournement intraday. Elle permet non seulement de capturer les profits dans les marchés en tendance, mais aussi de prendre des bénéfices en temps opportun lors des retournements de marché et d'ouvrir une position en sens inverse. Cette stratégie a été classée pendant 15 années consécutives parmi les dix stratégies de trading l
TrendDetect
Pavel Gotkevitch
The Trend Detect indicator combines the features of both trend indicators and oscillators. This indicator is a convenient tool for detecting short-term market cycles and identifying overbought and oversold levels. A long position can be opened when the indicator starts leaving the oversold area and breaks the zero level from below. A short position can be opened when the indicator starts leaving the overbought area and breaks the zero level from above. An opposite signal of the indicator can b
Terra Infinity is a flat indicator. This improved version of the CalcFlat indicator has three additional lines that significantly increase its effectiveness. Unlike its predecessor with two static levels, Terra Infinity adds three dynamic lines above the main histogram, which are interpreted as follows: base signal line, minimum signal line, maximum signal line. These lines are formed using the additional parameter Avg, which is the average value of the histogram. Averaging produces a line cl
Indicateur Crypto_Forex « Motif Marteau et Étoile Filante » pour MT5, sans modification, sans délai. - L'indicateur « Motif Marteau et Étoile Filante » est un indicateur très performant pour le trading Price Action. - L'indicateur détecte les motifs Marteau haussier et Étoile Filante baissière sur le graphique : - Marteau haussier : signal de flèche bleue sur le graphique (voir images). - Étoile Filante baissière : signal de flèche rouge sur le graphique (voir images). - Alertes PC, mobile et
Renko Plus
Eadvisors Software Inc.
With Renko Plus you can use the features in the Indicator functionality, just add it to the Metatrader5 chart.             The Renko chart is a type of chart, developed by the Japanese, that is constructed using price movement rather than standardized prices and time intervals like most charts. It is believed to be named after the Japanese word for bricks, "renga", as the graphic looks like a series of bricks.             A new brick is created when the price moves a specified pri
ATrend
Zaha Feiz
4.83 (18)
ATREND ATREND : Comment ça fonctionne et comment l'utiliser Comment ça fonctionne L'indicateur "ATREND" pour la plateforme MT5 est conçu pour fournir aux traders des signaux d'achat et de vente robustes en utilisant une combinaison de méthodologies d'analyse technique. Cet indicateur s'appuie principalement sur la plage vraie moyenne (ATR) pour mesurer la volatilité, ainsi que sur des algorithmes de détection de tendance pour identifier les mouvements potentiels du marché. Laissez un message ap
The indicator detects divergence signals - the divergences between the price peaks and the MACD oscillator values. The signals are displayed as arrows in the additional window and are maintained by the messages in a pop-up window, e-mails and push-notifications. The conditions which formed the signal are displayed by lines on the chart and in the indicator window. The indicator parameters MacdFast - fast MACD line period MacdSlow - slow MACD line period MacdSignal - MACD signal line period Macd
Separating Lines Trading System for MetaTrader 5 Separating Lines Trading System is a price action indicator for MT5 designed to detect 2-bar continuation patterns where both candles share the same opening level and the second candle resumes the prevailing trend. A detailed user guide is available on the author’s MQL5 Blog . Additional updates are available through the author’s   MQL5 Channel . Depending on the current support policy, buyers may receive additional access to selected companion t
Universal Soul Reaper
Pieter Gerhardus Van Zyl
Universal Soul Reaper is an atmospheric market-flow oscillator designed to interpret price behavior as a cycle of spiritual energy. Instead of reacting to raw price alone, it visualizes the state of the market’s soul —revealing when momentum is awakening, stabilizing, or fading. The indicator operates in a separate window and presents three interwoven entities: the Ectoplasmic Veil , the Spirit Boundary , and the Soul Core . Together, they form a living framework that helps traders sense pressu
The   Trendlines Oscillator   helps traders identify trends and momentum based on the normalized distances between the current price and the most recently detected bullish and bearish trend lines. The indicator features bullish and bearish momentum, a signal line with crossings, and multiple smoothing options. USAGE The   Trendlines Oscillator   works by systematically: Identifying pivot highs and lows. Connecting pivots to form bullish (support) and bearish (resistance) trendlines. Measuring
The RSI Divergence + FVG Signal indicator combines Relative Strength Index (RSI) Divergence with Fair Value Gap (FVG) detection to generate high-probability buy and sell signals based on both momentum shifts and institutional imbalance zones. Core Features: RSI Divergence Detection : Identifies both regular and hidden bullish/bearish divergences between price and RSI. Divergences indicate potential trend reversals or continuation. FVG Zone Recognition : Detects Fair Value Gaps (imbalances caused
##   ONLY GOLD ##   Тiльки Золото ## **Mercaria Professional Trading Zones - Complete Guide** ## **Mercaria Professional Trading Zones - Повний посібник** ### **How Mercaria Zones Work / Як працюють зони Mercaria** **English:** Mercaria Zones is an advanced trading indicator that identifies high-probability support and resistance areas using ZigZag extremes combined with mathematical zone calculations. The indicator works on multiple timeframes simultaneously, providing a comprehensive view
Double HMA MTF for MT5
Pavel Zamoshnikov
4 (4)
This is an advanced multi-timeframe version of the popular Hull Moving Average (HMA) Features Two lines of the Hull indicator of different timeframes on the same chart. The HMA line of the higher timeframe defines the trend, and the HMA line of the current timeframe defines the short-term price movements. A graphical panel with HMA indicator data from all timeframes at the same time . If the HMA switched its direction on any timeframe, the panel displays a question or exclamation mark with a tex
Renko System
Marco Montemari
This indicator can be considered as a trading system. It offers a different view to see the currency pair: full timeless indicator, can be used for manual trading or for automatized trading with some expert advisor. When the price reaches a threshold a new block is created according to the set mode. The indicator beside the Renko bars, shows also 3 moving averages. Features renko mode median renko custom median renko 3 moving averages wicks datetime indicator for each block custom notification
MercariaPattern1-2-3 відстежує рух ціни, знаходить трьоххвильові структури 1-2-3 та підсвічує момент, коли сценарій підтверджується пробоєм ключового рівня. MercariaPattern1-2-3 tracks price movement, detects three-leg 1-2-3 structures and highlights the moment when the scenario is confirmed by a key level breakout. Індикатор збирає локальні свінги в компактну фігуру 0–1–2–3 , чекає підтвердженого пробою та будує стрілку входу з готовими рівнями SL/TP. The indicator combines local swings into a
Unlock key market insights with automated support and resistance lines Tired of plotting support and resistance lines? This is a multi-timeframe indicator that detects and plots supports and resistance lines in the chart with the same precision as a human eye would. As price levels are tested over time and its importance increases, the lines become thicker and darker, making price leves easy to glance and evaluate. [ Installation Guide | Update Guide | Troubleshooting | FAQ | All Products  | 
Trade smarter, not harder: Empower your trading with Harmonacci Patterns This is arguably the most complete harmonic price formation auto-recognition indicator you can find for the MetaTrader Platform. It detects 19 different patterns, takes fibonacci projections as seriously as you do, displays the Potential Reversal Zone (PRZ) and finds suitable stop-loss and take-profit levels. [ Installation Guide | Update Guide | Troubleshooting | FAQ | All Products   |  Get Help ] It detects 19 differen
This is Gekko's Cutomized Relative Strength Index (RSI), a customized version of the famous RSI indicator. Use the regular RSI and take advantage two entry signals calculations and different ways of being alerted whenever there is potential entry or exit point. Inputs Period: Period for the RSI calculation; How will the indicator calculate entry (swing) signals: 1- Produces Exit Signals for Swings based on RSI entering and leaving Upper and Lower Levels Zones; 2- Produces Entry/Exit Signals for
Indicateur Crypto_Forex « Double Étoile Filante » pour MT5, sans refonte, sans délai. - L'indicateur « Double Étoile Filante » est très performant pour le trading Price Action. - L'indicateur détecte des figures rares mais efficaces : Double Étoile Filante baissière sur le graphique. - Double Étoile Filante baissière - Signal de flèche rouge sur le graphique (voir images). - Alertes PC et mobile intégrées. - L'indicateur « Double Étoile Filante » est idéal pour combiner les niveaux de support
The indicator detects and displays М. Gartley's Butterfly pattern. The pattern is plotted by the extreme values of the ZigZag indicator (included in the resources, no need to install). After detecting the pattern, the indicator notifies of that by the pop-up window, a mobile notification and an email. The pattern and wave parameters are displayed on the screenshots. The default parameters are used for demonstration purposes only in order to increase the amount of detected patterns. Parameters z
CosmiCLab SMC FIBO CosmiCLab SMC FIBO is a professional trading indicator designed for traders who use Smart Money Concepts (SMC), market structure analysis and Fibonacci retracement levels. The indicator automatically detects market swings and builds Fibonacci levels based on the latest impulse movement. It also identifies market structure changes such as BOS (Break of Structure) and CHOCH (Change of Character), helping traders understand the current market direction. CosmiCLab SMC FIBO also pr
STRICTLY FOR BOOM INDEX ONLY!!!!! Here I bring the Maximum Trend Arrows OT1.0 MT5 indicator. This indicator is made up of a combination of different trend indicators for entries and exits, for entries an orange arrow will paint on the chart below the current market and a red flag for closing of trades and it produces buy arrows only. When the orange arrow appears, it will appear along with it's sound to notify you. The 1H timeframe is recommended, don't use it anywhere else than on the 1H timefr
CosmiCLab METEORIT — SMC Fibo ZigZag CosmiCLab METEORIT is a professional Smart Money Concepts indicator designed for traders who want to identify institutional market movements. The indicator combines market structure analysis, liquidity sweeps, automatic Fibonacci levels and a smart ZigZag engine to help traders detect high-probability trading zones. It is designed for intraday trading on M15 and H1 , but also works well on other timeframes. Key Features Smart ZigZag market structure engine
Hush mt5
Iurii Plokhov
4.33 (3)
Hush mt5 is an advanced indicator that gives a signal about the overbought or oversold market in a certain period of time Hush mt5 the advantage of this indicator is that it does not disappear after the signal on the chart Suitable for any trade: forex, stocks, cryptocurrency, metals Hush mt5 can be used on any time period. The signal goes to the beginning of the next candle after the arrow Hush mt5 performed best on the period H1,H4,daily It can be used in addition to forex, in binary opt
Our new indicator is an important part of the Smart Money Concepts (SMC) system It uses a modern market vision and fast calculation methods. As a result, the trader has a complete picture of the trade at every moment in time, which makes the process of obtaining results easier and faster. Our new indicator displays the following important patterns:   Order Blocks. Imbalance – Fair Value Gap (FVG). Break Of Structures (BoS). Change of character (CHoCH). Equal highs & lows. Premium , Equilibrium
CurvedSmoothChannel_Enhanced - Enhanced Price Channel Indicator **CurvedSmoothChannel_Enhanced** is a powerful and visually appealing price channel indicator designed for MetaTrader 5 that helps you identify trends, potential reversals, and key price levels with precision. This enhanced version combines the power of the Hull Moving Average (HMA) and John Ehlers' Super Smooth Filter, creating a dynamic, adaptive channel that adjusts to market conditions across multiple time frames. #### Key Fea
Automated Trendlines MT5
Georgios Kalomoiropoulos
Les lignes de tendance sont l'outil d'analyse technique le plus essentiel dans le trading forex. Malheureusement, la plupart des commerçants ne les dessinent pas correctement. L'indicateur Automated Trendlines est un outil professionnel pour les traders sérieux qui vous aide à visualiser le mouvement de tendance des marchés. Il existe deux types de lignes de tendance, les lignes de tendance haussières et les lignes de tendance baissières. Dans la tendance haussière, la ligne de tendance du Fo
Time And Sales Delta
Evgeny Shevtsov
5 (2)
The indicator displays the delta and the cumulative delta based on the "Time & Sales" deals list data. In addition to the standard timeframes, the indicator displays data regarding the seconds timeframes (S5, S10, S15, S20, S30) to choose from. Using the rectangle, user can select an arbitrary area in the indicator subwindow to view the ratio of the volumes of deals of buyers and sellers within this area. Indicator features: The indicator works correctly only on those trading symbols for which
Les acheteurs de ce produit ont également acheté
SuperScalp Pro
Van Minh Nguyen
4.57 (21)
SuperScalp Pro – Système d’indicateur de scalping avancé multi-filtres SuperScalp Pro est un système d’indicateur de scalping avancé qui combine le Supertrend classique avec plusieurs filtres de confirmation intelligents. L’indicateur fonctionne efficacement sur toutes les unités de temps de M1 à H4 et est particulièrement adapté à XAUUSD, BTCUSD et aux principales paires Forex. Il peut être utilisé comme système autonome ou intégré de manière flexible dans des stratégies de trading existantes.
Entry In The Zone and SMC Multi Timeframe is a real-time 2-in-1 market analysis tool that combines market structure analysis and a No Repaint BUY / SELL signal system into a single indicator, built on Smart Money Concepts (SMC) — a widely adopted framework used by professional traders to understand market structure. This indicator helps you see the market more clearly, make decisions based on structure rather than guesswork, and focus on high-probability zones where price is more likely to react
Divergence Bomber
Ihor Otkydach
4.9 (86)
Chaque acheteur de cet indicateur reçoit également gratuitement : L’outil exclusif « Bomber Utility », qui accompagne automatiquement chaque opération de trading, fixe les niveaux de Stop Loss et de Take Profit, et clôture les positions selon les règles de la stratégie Des fichiers de configuration (set files) pour adapter l’indicateur à différents actifs Des set files pour configurer le Bomber Utility selon différents modes : « Risque Minimum », « Risque Équilibré » et « Stratégie d’Attente » U
Azimuth Pro
Ottaviano De Cicco
5 (6)
Azimuth Pro V2: Synthetic Fractal Structure and Confirmed Entries for MT5 Overview Azimuth Pro is a multi-level swing structure indicator by Merkava Labs . Four nested swing layers, swing-anchored VWAP, ABC pattern detection, three-timeframe structural filtering, and closed-bar confirmed entries — one chart, one workflow from micro-swings to macro-cycles. This is not a blind signal product. It is a structure-first workflow for traders who care about location, context, and timing. V2 Launch Offe
Quantum TrendPulse
Bogdan Ion Puscasu
5 (23)
Présentation de   Quantum TrendPulse   , l'outil de trading ultime qui combine la puissance de   SuperTrend   ,   RSI   et   Stochastic   dans un seul indicateur complet pour maximiser votre potentiel de trading. Conçu pour les traders qui recherchent précision et efficacité, cet indicateur vous aide à identifier les tendances du marché, les changements de dynamique et les points d'entrée et de sortie optimaux en toute confiance. Caractéristiques principales : Intégration SuperTrend :   suivez f
Gann Made Easy   est un système de trading Forex professionnel et facile à utiliser qui est basé sur les meilleurs principes de trading en utilisant la théorie de mr. WD Gann. L'indicateur fournit des signaux d'ACHAT et de VENTE précis, y compris les niveaux Stop Loss et Take Profit. Vous pouvez échanger même en déplacement en utilisant les notifications PUSH. VEUILLEZ ME CONTACTER APRÈS L'ACHAT POUR RECEVOIR GRATUITEMENT DES INSTRUCTIONS DE TRADING ET D'EXCELLENTS INDICATEURS SUPPLÉMENTAIRES! V
Si vous achetez cet indicateur, vous recevrez mon Gestionnaire de Trading Professionnel + EA  GRATUITEMENT. Tout d'abord, il convient de souligner que ce système de trading est un indicateur non repeint, non redessiné et non retardé, ce qui le rend idéal pour le trading manuel et automatisé. Cours en ligne, manuel et téléchargement de préréglages. Le "Système de Trading Smart Trend MT5" est une solution de trading complète conçue pour les traders débutants et expérimentés. Il combine plus de 10
FX Trend MT5 NG
Daniel Stein
5 (4)
FX Trend NG : La Nouvelle Génération d’Intelligence de Tendance Multi-Marchés Vue d’ensemble FX Trend NG est un outil professionnel d’analyse de tendance multi-timeframe et de surveillance des marchés. Il vous permet de comprendre la structure complète du marché en quelques secondes. Au lieu de naviguer entre de nombreux graphiques, vous identifiez immédiatement quels instruments sont en tendance, où le momentum s’affaiblit et où plusieurs unités de temps sont alignées. Offre de Lancement – Ob
OmniSync Projection
Antonio-alin Teculescu
5 (1)
Chronos Fractal Engine is an innovative price projection indicator for MetaTrader 5, designed to transform your technical analysis by intelligently identifying and projecting historical price patterns. Built upon an advanced correlation algorithm and the fractal principles of the market, this powerful tool visualizes potential future price movements, giving you a unique edge in your trading decisions. What is Chronos Fractal Engine? At its core, the Chronos Fractal Engine employs a sophisticat
Présentation       Quantum Breakout PRO   , l'indicateur révolutionnaire MQL5 qui transforme la façon dont vous négociez les zones d'évasion ! Développé par une équipe de traders expérimentés avec une expérience commerciale de plus de 13 ans,       Évasion quantique PRO       est conçu pour propulser votre parcours commercial vers de nouveaux sommets grâce à sa stratégie de zone de discussion innovante et dynamique. Quantum Breakout Indicator vous donnera des flèches de signalisation sur les z
Power Candles MT5
Daniel Stein
4.75 (8)
Power Candles – Signaux d’entrée basés sur la force pour tous les marchés Power Candles intègre l’analyse de force éprouvée de Stein Investments directement dans le graphique des prix. Au lieu de réagir uniquement au prix, chaque bougie est colorée en fonction de la force réelle du marché, ce qui permet d’identifier instantanément les phases de momentum, l’accélération de la force et les transitions de tendance propres. Une logique unique pour tous les marchés Power Candles fonctionne automatiqu
CGE Trading Suite
Carl Gustav Johan Ekstrom
5 (2)
Institutional-Grade Analytics for MT5 C GE Trading Suite delivers the analytical edge typically reserved for professional trading desks. The platform integrates a full suite of analytical tools into one seamless workflow: dynamic grid mapping, liquidity behavior analysis, ECM, trend lines, MIDAS, trade cycles, and directional channel projections. Together, these provide a unified view of market structure and momentum. Directional clarity is further enhanced by the capital flow index, which meas
Voyez quelle strategie fonctionne reellement sur votre symbole - avant de risquer de l'argent reel. Power Bar detecte les barres de prix extremes sur n'importe quel symbole et n'importe quel timeframe, puis backteste instantanement 3 strategies de trading differentes pour que vous puissiez comparer les taux de reussite, les facteurs de profit et les P&L cote a cote. Le tout dans un seul panneau interactif. Pas de suppositions. Pas de suroptimisation. Juste des donnees. Qu'est-ce qui rend Power
Meridian Pro
Ottaviano De Cicco
5 (1)
Meridian Pro: Professional Multi-Timeframe Trend Matrix for MT5 Overview Meridian Pro is a multi-timeframe trend matrix by Merkava Labs that compresses directional state, strength, momentum condition and matrix agreement into one compact panel. One adaptive engine, applied consistently from M1 to W1. No per-symbol tuning. No indicator stacking. One structured readout across every asset and every timeframe. Launch Offer — Get Meridian Pro for USD 99 (introductory). Regular price: USD 149. 1. Why
Grabber System MT5
Ihor Otkydach
4.83 (23)
Je vous présente un excellent indicateur technique : Grabber, qui fonctionne comme une stratégie de trading "tout-en-un", prête à l'emploi. En un seul code sont intégrés des outils puissants d'analyse technique du marché, des signaux de trading (flèches), des fonctions d'alerte et des notifications push. Chaque acheteur de cet indicateur reçoit également gratuitement : L'utilitaire Grabber : pour la gestion automatique des ordres ouverts Un guide vidéo étape par étape : pour apprendre à installe
Commençons par être honnêtes. Aucun indicateur ne vous rendra rentable à lui seul. Si quelqu’un vous dit le contraire, il vous vend un rêve. Tout indicateur qui affiche des flèches parfaites d’achat/vente peut être rendu impeccable — il suffit de zoomer sur la bonne partie de l’historique et de capturer uniquement les trades gagnants. Nous ne faisons pas cela.  SMC Intraday Formula est un outil. Il lit la structure du marché pour vous, identifie les zones de prix à la probabilité la plus élevée
Trend Screener Pro MT5
STE S.S.COMPANY
4.85 (104)
Indicateur de tendance, solution unique révolutionnaire pour le trading et le filtrage des tendances avec toutes les fonctionnalités de tendance importantes intégrées dans un seul outil ! Il s'agit d'un indicateur multi-période et multi-devises 100 % non repeint qui peut être utilisé sur tous les symboles/instruments : forex, matières premières, crypto-monnaies, indices et actions. Trend Screener est un indicateur de suivi de tendance efficace qui fournit des signaux de tendance fléchés avec des
Btmm state engine pro
Garry James Goodchild
5 (4)
BTMM State Engine Pro is a MetaTrader 5 indicator for traders who use the Beat The Market Maker approach: Asian session context, kill zone timing, level progression, peak formation detection, and a multi-pair scanner from a single chart. It combines cycle state logic with a built-in scanner dashboard so you do not need the same tool on many charts at once. What it does Draws the Asian session range; session times can follow broker server offset or be set in inputs. Tracks level progression (L
Atomic Analyst MT5
Issam Kassas
3.94 (31)
Tout d'abord, il convient de souligner que cet indicateur de trading n'est ni repainting, ni redrawing et ne présente aucun délai, ce qui le rend idéal à la fois pour le trading manuel et automatisé. Manuel de l'utilisateur : réglages, entrées et stratégie. L'Analyste Atomique est un indicateur d'action sur les prix PA qui utilise la force et le momentum du prix pour trouver un meilleur avantage sur le marché. Équipé de filtres avancés qui aident à éliminer les bruits et les faux signaux, et à
Smart Stop Indicator – Précision intelligente du stop-loss directement sur votre graphique Présentation Smart Stop Indicator est la solution idéale pour les traders qui souhaitent placer leur stop-loss de manière claire et méthodique, sans deviner ni suivre leur intuition. Cet outil combine la logique classique de price action (succession de plus hauts et de plus bas) avec une reconnaissance moderne des cassures pour identifier le prochain niveau de stop réellement logique. Que le marché soit
Crystal Heikin Ashi Signals
Muhammad Jawad Shabir
5 (2)
Crystal Heikin Ashi Signals - Professional Trend & Signal Detection Indicator Advanced Heikin Ashi Visualization with Intelligent Signal System for Manual & Automated Trading Final Price: $149 ---------> Price goes up $10 after every 10 sales . Limited slots available — act fast . Overview Crystal Heikin Ashi Signals is a professional-grade MetaTrader 5 indicator that combines pure Heikin Ashi candle visualization with an advanced momentum-shift detection system. Designed for both manual traders
FX Power MT5 NG
Daniel Stein
5 (31)
FX Power : Analysez la force des devises pour des décisions de trading plus intelligentes Aperçu FX Power est l'outil essentiel pour comprendre la force réelle des principales devises et de l'or, quelles que soient les conditions du marché. En identifiant les devises fortes à acheter et les faibles à vendre, FX Power simplifie vos décisions de trading et révèle des opportunités à forte probabilité. Que vous suiviez les tendances ou anticipiez les retournements à l'aide de valeurs extrêmes de D
Auto Optimized Parabolic RSI : Moteur de Momentum 3D Avancé La plupart des indicateurs pour les particuliers échouent car ils s'appuient sur des paramètres statiques qui se brisent dès que la volatilité du marché change. L'Auto Optimized Parabolic RSI résout le problème de l'« obsolescence des indicateurs » en recalculant continuellement son propre avantage mathématique, apportant une adaptation quantitative de niveau institutionnel directement sur votre terminal MT5. L'Avantage Principal : Opti
RelicusRoad Pro : Système d'Exploitation Quantitatif du Marché 70% DE RÉDUCTION ACCÈS À VIE (DURÉE LIMITÉE) - REJOIGNEZ 2 000+ TRADERS Pourquoi la plupart des traders échouent-ils même avec des indicateurs "parfaits" ? Parce qu'ils tradent des concepts isolés dans le vide. Un signal sans contexte est un pari. Pour gagner, il faut de la CONFLUENCE . RelicusRoad Pro est un Écosystème Quantitatif complet . Il cartographie la "Fair Value Road", distinguant le bruit des cassures structurelles. Arrête
Market Structure Order Block Dashboard MT5 est un indicateur MT5 conçu pour les traders qui veulent lire la structure de marché et les principales zones de réaction du prix directement sur le graphique. Il combine BOS, ChoCH, Order Blocks, Fair Value Gaps (FVG), Liquidité, Kill Zones, Volume Profile, et un dashboard compact pour une analyse rapide. Cet indicateur s’adresse aux traders qui utilisent la structure de marché, les concepts ICT et Smart Money comme cadre de décision. Il peut aider à r
ARICoins
Temirlan Kdyrkhan
ARICoin is a powerful trading companion designed to generate high-probability entry signals with dynamic TP/SL/DP levels based on volatility. Built-in performance tracking shows win/loss stats, PP1/PP2 hits, and success rates all updated live. Key Features: Buy/Sell signals with adaptive volatility bands Real-time TP/SL/DP levels based on ATR Built-in MA Filter with optional ATR/StdDev volatility Performance stats panel (Success, Profit/Loss, PP1/PP2) Alerts via popup, sound, push, or email Cust
ARIPoint
Temirlan Kdyrkhan
ARIPoint is a powerful trading companion designed to generate high-probability entry signals with dynamic TP/SL/DP levels based on volatility. Built-in performance tracking shows win/loss stats, PP1/PP2 hits, and success rates all updated live. Key Features: Buy/Sell signals with adaptive volatility bands Real-time TP/SL/DP levels based on ATR Built-in MA Filter with optional ATR/StdDev volatility Performance stats panel (Success, Profit/Loss, PP1/PP2) Alerts via popup, sound, push, or email Cu
Meravith Scanner
Ivan Stefanov
5 (1)
MERAVITH SCANNER est un indicateur professionnel pour les marchés financiers sur MetaTrader 5, qui regroupe plusieurs outils d’analyse en un seul système intégré. Il effectue tous les calculs automatiquement en utilisant une méthodologie propriétaire de prix moyen pondéré par le volume (VWAP), éliminant ainsi toute interprétation subjective. Cet indicateur fonctionne sur toutes les classes d’actifs (Forex, actions, indices, matières premières, cryptomonnaies) et sur toutes les périodes, de M1 au
Market Structure Patterns
Samuel Manoel De Souza
4.47 (19)
Disponible pour   MT4   et   MT5 . Rejoignez le canal Market Structure Patterns pour télécharger des documents d'étude et/ou des informations supplémentaires. Articles connexes : Market Structure Patterns - Introdução Beyond Fancy Order Blocks: Using True Volumetric Analysis with Market Structure Patterns & Timeless Charts Market Structure Patterns – Complete SMC Indicator Guide (Concepts + Settings) Market Structure Patterns   est un indicateur basé sur les   Smart Money Concepts   qui affich
Blahtech Supply Demand MT5
Blahtech Limited
4.54 (13)
Was: $299  Now: $99  Supply Demand uses previous price action to identify potential imbalances between buyers and sellers. The key is to identify the better odds zones, not just the untouched ones. Blahtech Supply Demand indicator delivers functionality previously unavailable on any trading platform. This 4-in-1 indicator not only highlights the higher probability zones using a multi-criteria strength engine, but also combines it with multi-timeframe trend analysis, previously confirmed swings a
Plus de l'auteur
Pending provider
Andrey Frolov
5 (1)
The script greatly simplifies trader's work with pending stop orders (BuyStop, SellStop). The script places any number of pending orders at a user-defined distance (in points). Order expiration time in seconds can also be specified. It is also possible to place only Buy Stop or only Sell Stop orders. All stop orders are accompanied by user-defined take profit and stop loss levels. Volume is customizable as well. Parameters Open BuyStop - place a pending Buy order Open SellStop - place a pending
Mirage
Andrey Frolov
This tool set Stop Loss and Take Profit, which are invisible for the broker. But keep in mind that the terminal must be constantly running and connected. It means that you cannot turn off your computer or close the terminal. In the strategy tester, the tool opens positions and manages them using stop-order for demonstration purposes. Parameters Take Profit Stop Loss Slippage
This candlestick indicator searches for candlesticks, at which the direction on all selected timeframes coincides (M1, M5, M15, M30, H1, H4, D1, W1, MN). For example, if the candlestick on all timeframes is rising (bullish) or falling (bearish). You can: Turn off the display of unnecessary arrows and leave, for example, only those showing changes in signal direction, i.e. only the first arrow in each direction. Set the candlestick for the signal: the zero candlestick or a completely formed one.
Программа передвигает уровень стоп-лосс вслед за ценой на расстоянии в пунктах, которое будет указано в настройках, то есть является самостоятельным плавающим стоп-лоссом. При необходимости, программу можно настроить таким образом, чтобы она передвинула стоп-лосс при достижении какого-либо уровня прибыли в пунктах. Также можно установить шаг трейлинга, чтобы программа передвигала стоп-лосс только через определенное количество пунктов. Несколько причин отдать предпочтение "Mobile trailing stop":
Trend indicator. Designed for long-term trading. It is recommended to use on a chart with the M30 timeframe or higher. When the red line crossed the green line below the zero mark, and the green line, respectively, crosses from above, then it is a buy signal. When the green line crossed the red line above the zero mark, and the red line, respectively, crosses from above, then it is a sell signal. Parameters Indicator period - period of the indicator. (The greater the period, the more long-term
The indicator displays points showing a symbol trend. Bullish (blue) points mean buy signals. Bearish (red) points mean sell signals. I recommend using the indicator in conjunction with others. Timeframe: M30 and higher. Simple strategy: Buy if there are two blue points on the chart. Sell if there are two red points on the chart. Parameters Trend points period - The main period of the indicator; True range period - The auxiliary period of the indicator; Points calculation method - Calculation m
Trend indicator. Displays a two-colored line on the chart, which shows the market direction. The blue color shows the uptrend. The red, respectively, shows the downtrend. It is recommended to use on charts with the M30 timeframe or higher. Simple strategy: When the line changes its color to blue, buy. When it changes to red, sell. Parameters Trend Uncover period - period of the indicator;
This is a trend-following indicator that is most efficient in long-term trading. It does not require deep knowledge to be applied in trading activity. It features a single input parameter for more ease of use. The indicator displays lines and dots, as well as signals informing a trader of the beginning of a bullish or bearish trend. Parameter Indicator_Period - indicator period (the greater, the more long-term the signals).
Bollinger Prophecy is a multicurrency trending tool for technical analysis of financial markets. Draws 3 lines on the chart that show the current price deviations of the currency pair. The indicator is calculated based on the standard deviation from a simple moving average. The parameters for the calculation are the standard double deviation and the period of the moving average, which depends on the settings of the trader himself. A trading signal is considered when the price exits the trading c
Filtrer:
Aucun avis
Répondre à l'avis