Supreme Range Profile Structure MT4
- Indicateurs
-
Kestutis Balciunas
 Avec plus de 16 ans d'expérience active sur les marchés financiers, je suis spécialisé dans le développement de stratégies de trading forex haute performance, d'indicateurs techniques et d'Expert Advisors automatisés pour MT4/MT5. Mon travail couvre des systèmes de trading conçus avec précision
- Version: 1.0
- Activations: 10
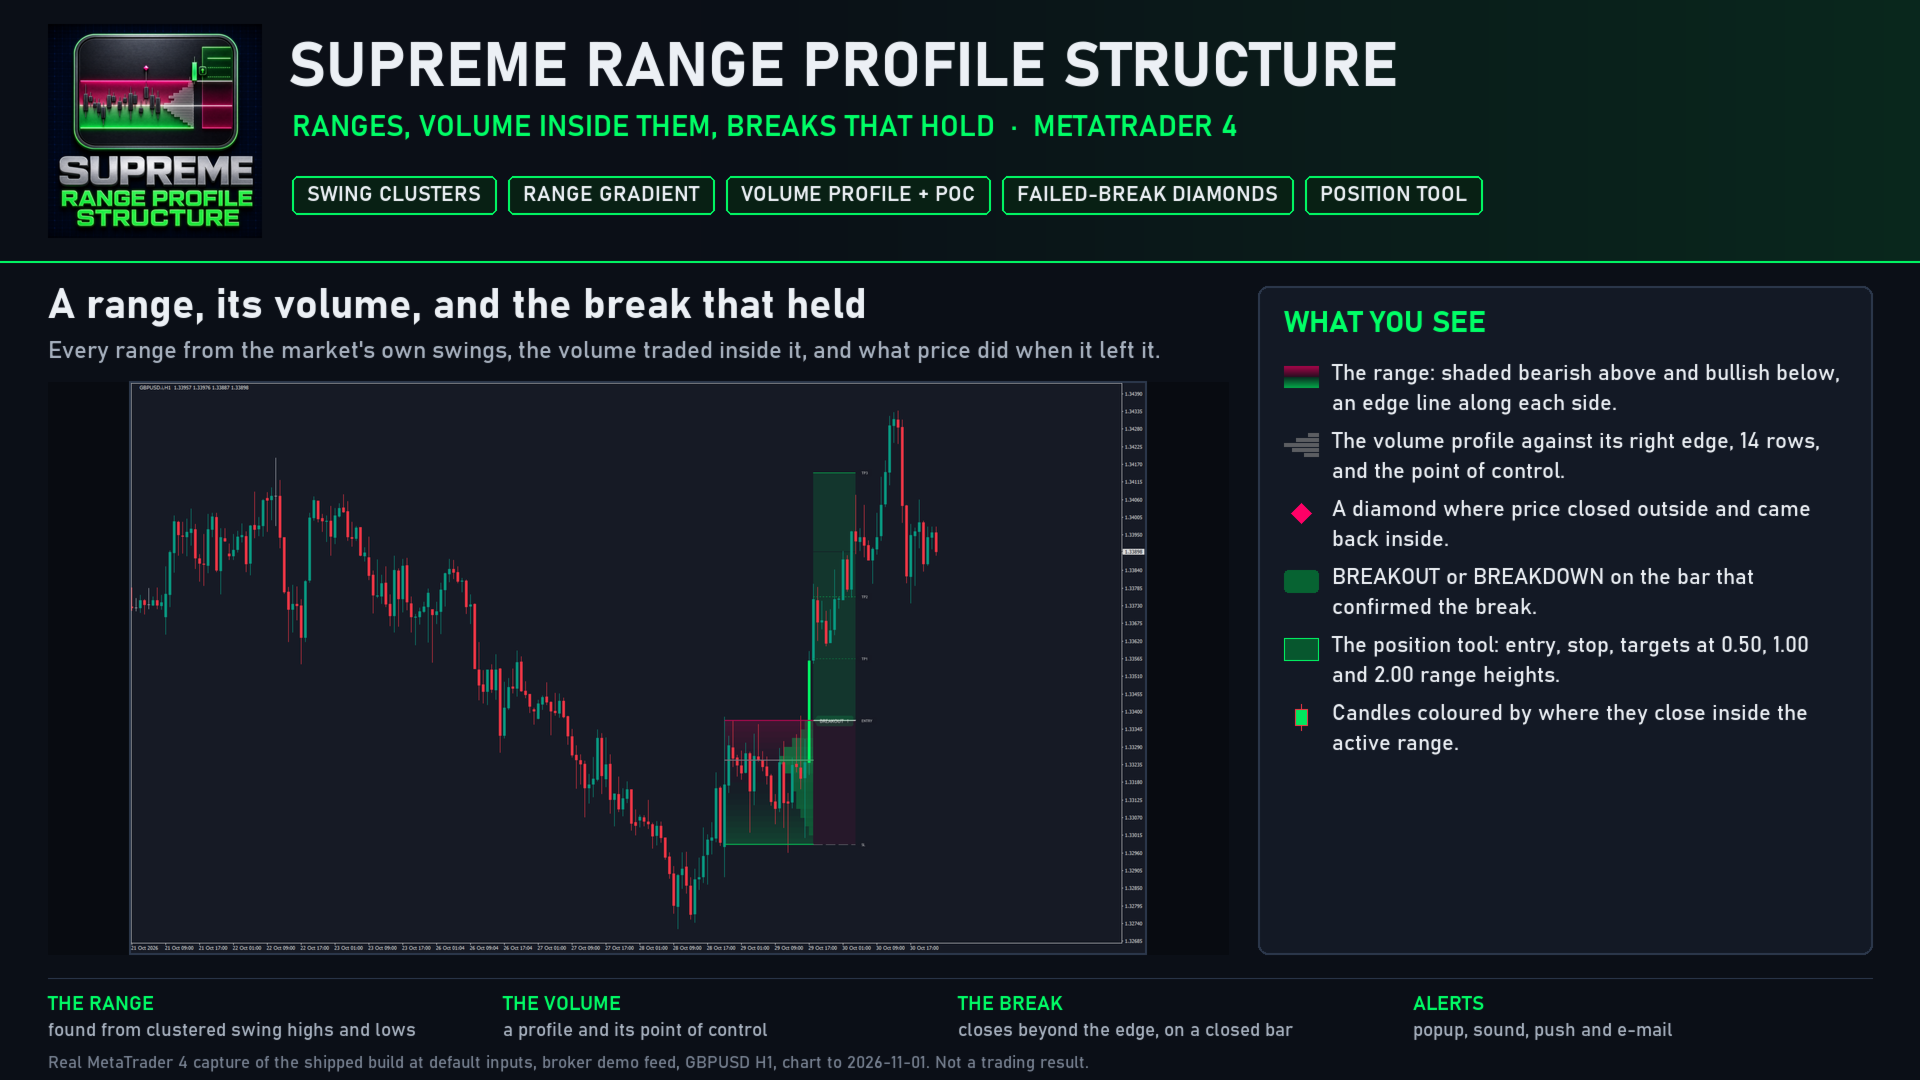
Supreme Range Profile Structure finds sideways ranges from the market's own swings, shows where the volume traded inside each one, marks the moves that left the range and failed, and draws a position tool when a range finally breaks. A range is drawn only when recent swing highs and lows cluster tightly, alternate often enough, span enough bars and fit an ATR width window, so it marks a real balance rather than any pause. Breaks and failed breaks are decided on a closed bar and stay where they were drawn.
- MT5 version: {{OTHER_URL}}
- Trading guide, how to trade ranges with it step by step: {{BLOG_URL}}
- User manual, every setting explained: {{MANUAL_URL}}
WHAT IT DRAWS
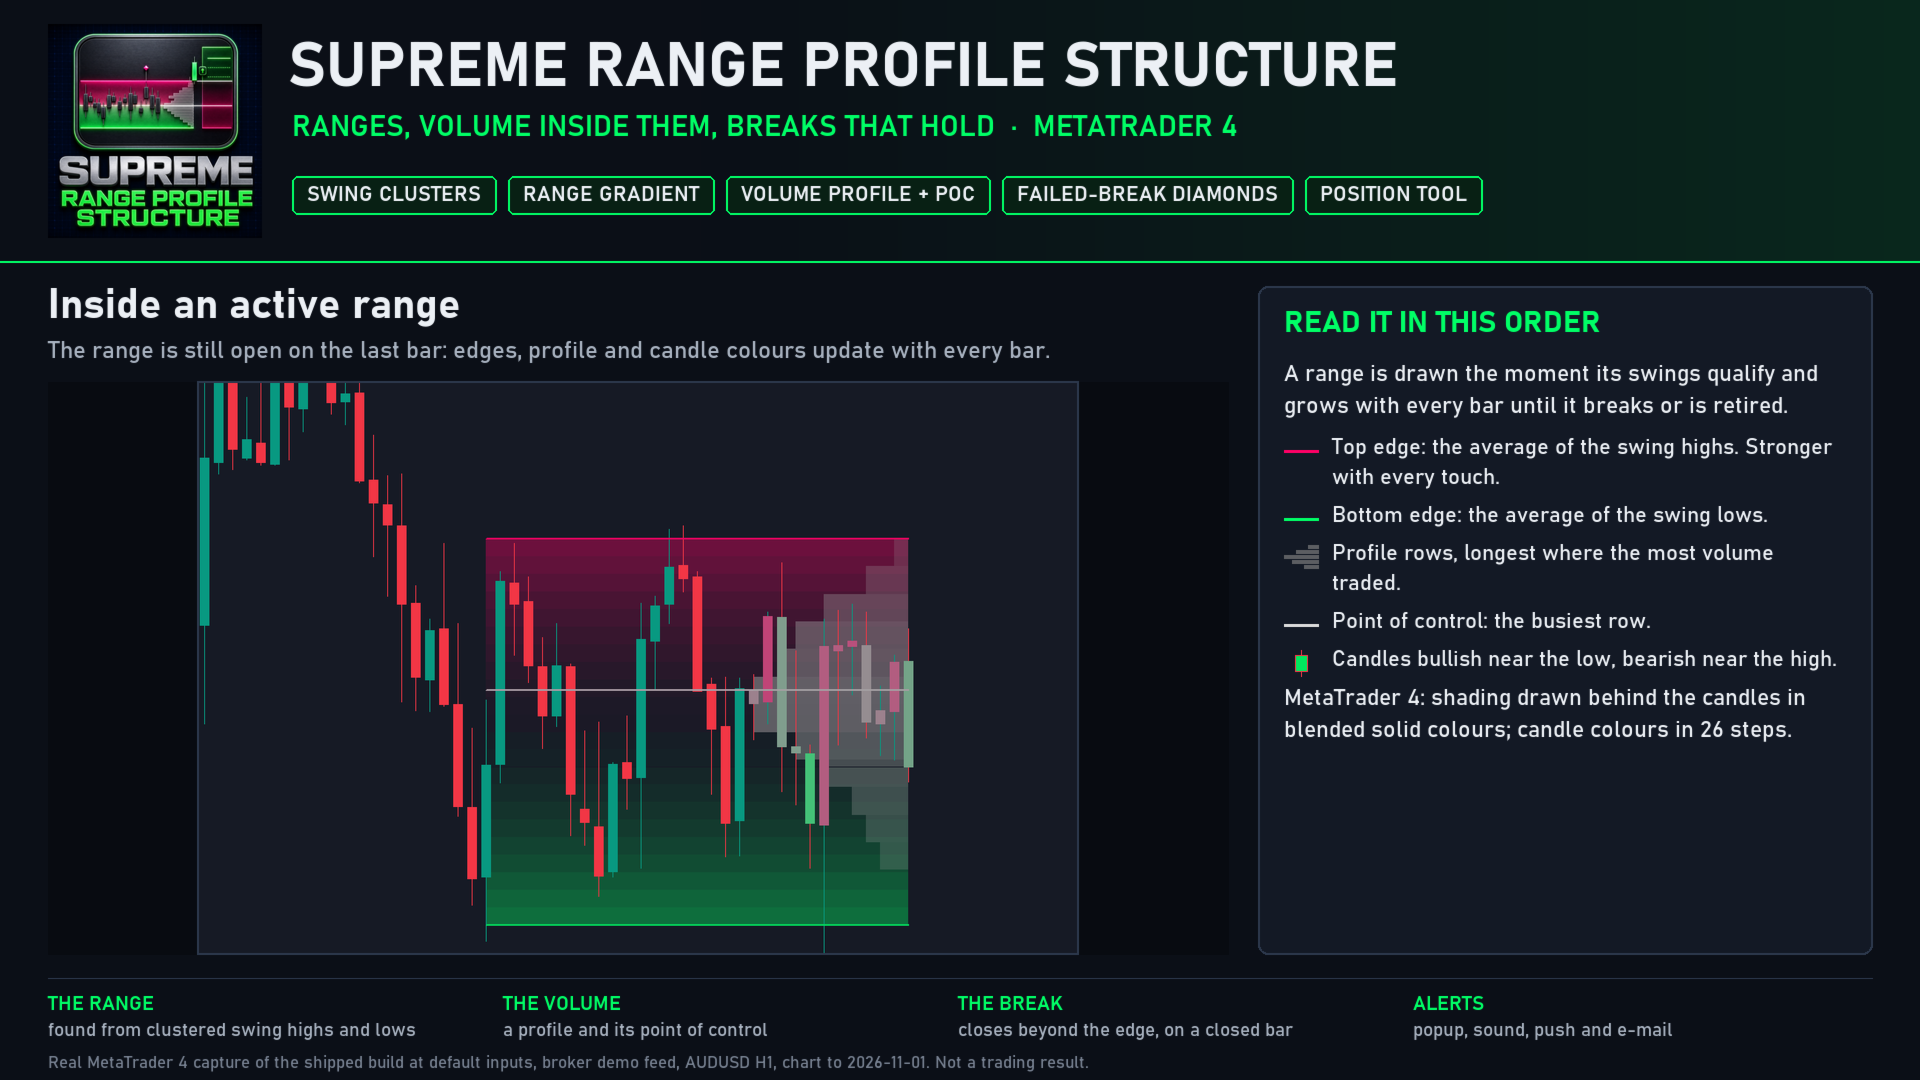
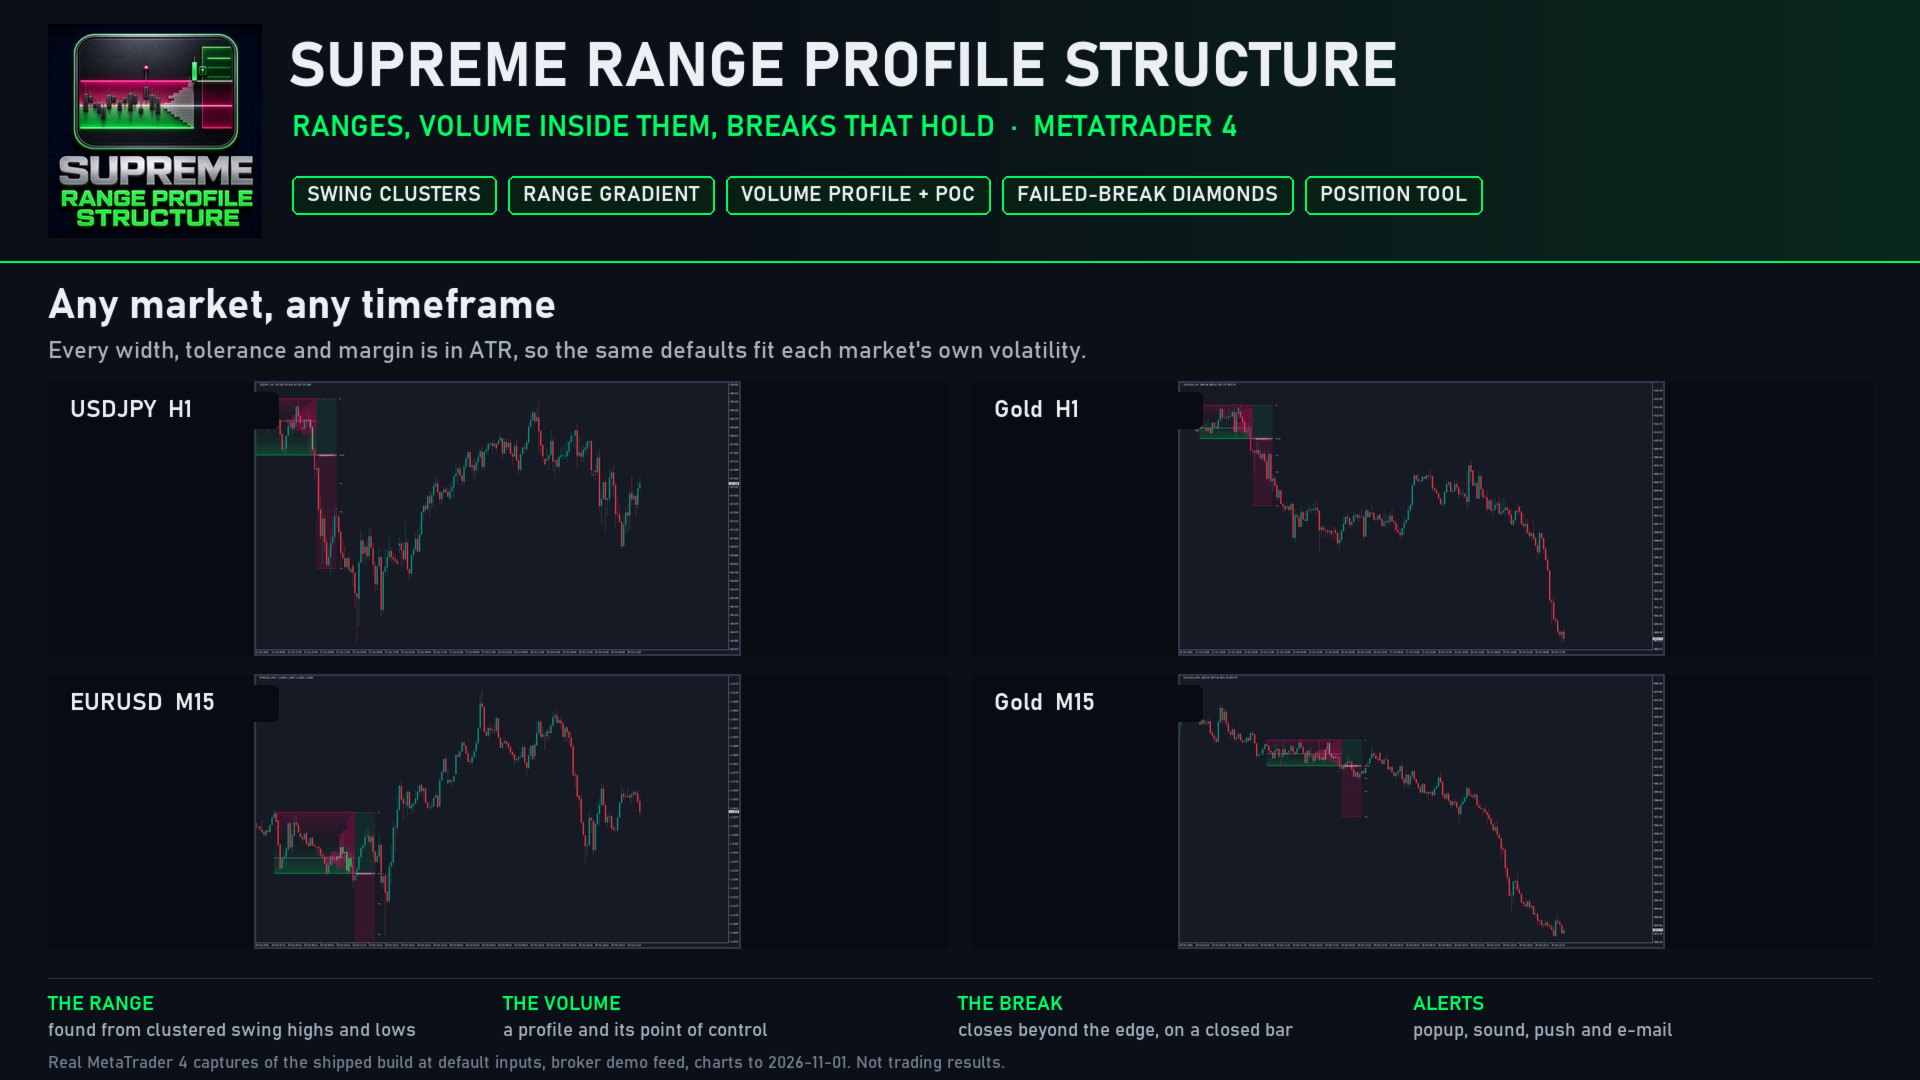
- Each range as a band shaded in two colours, bearish above and bullish below, fading into each other in the middle, with a line along each edge. An edge line gets stronger with every swing that touches it.
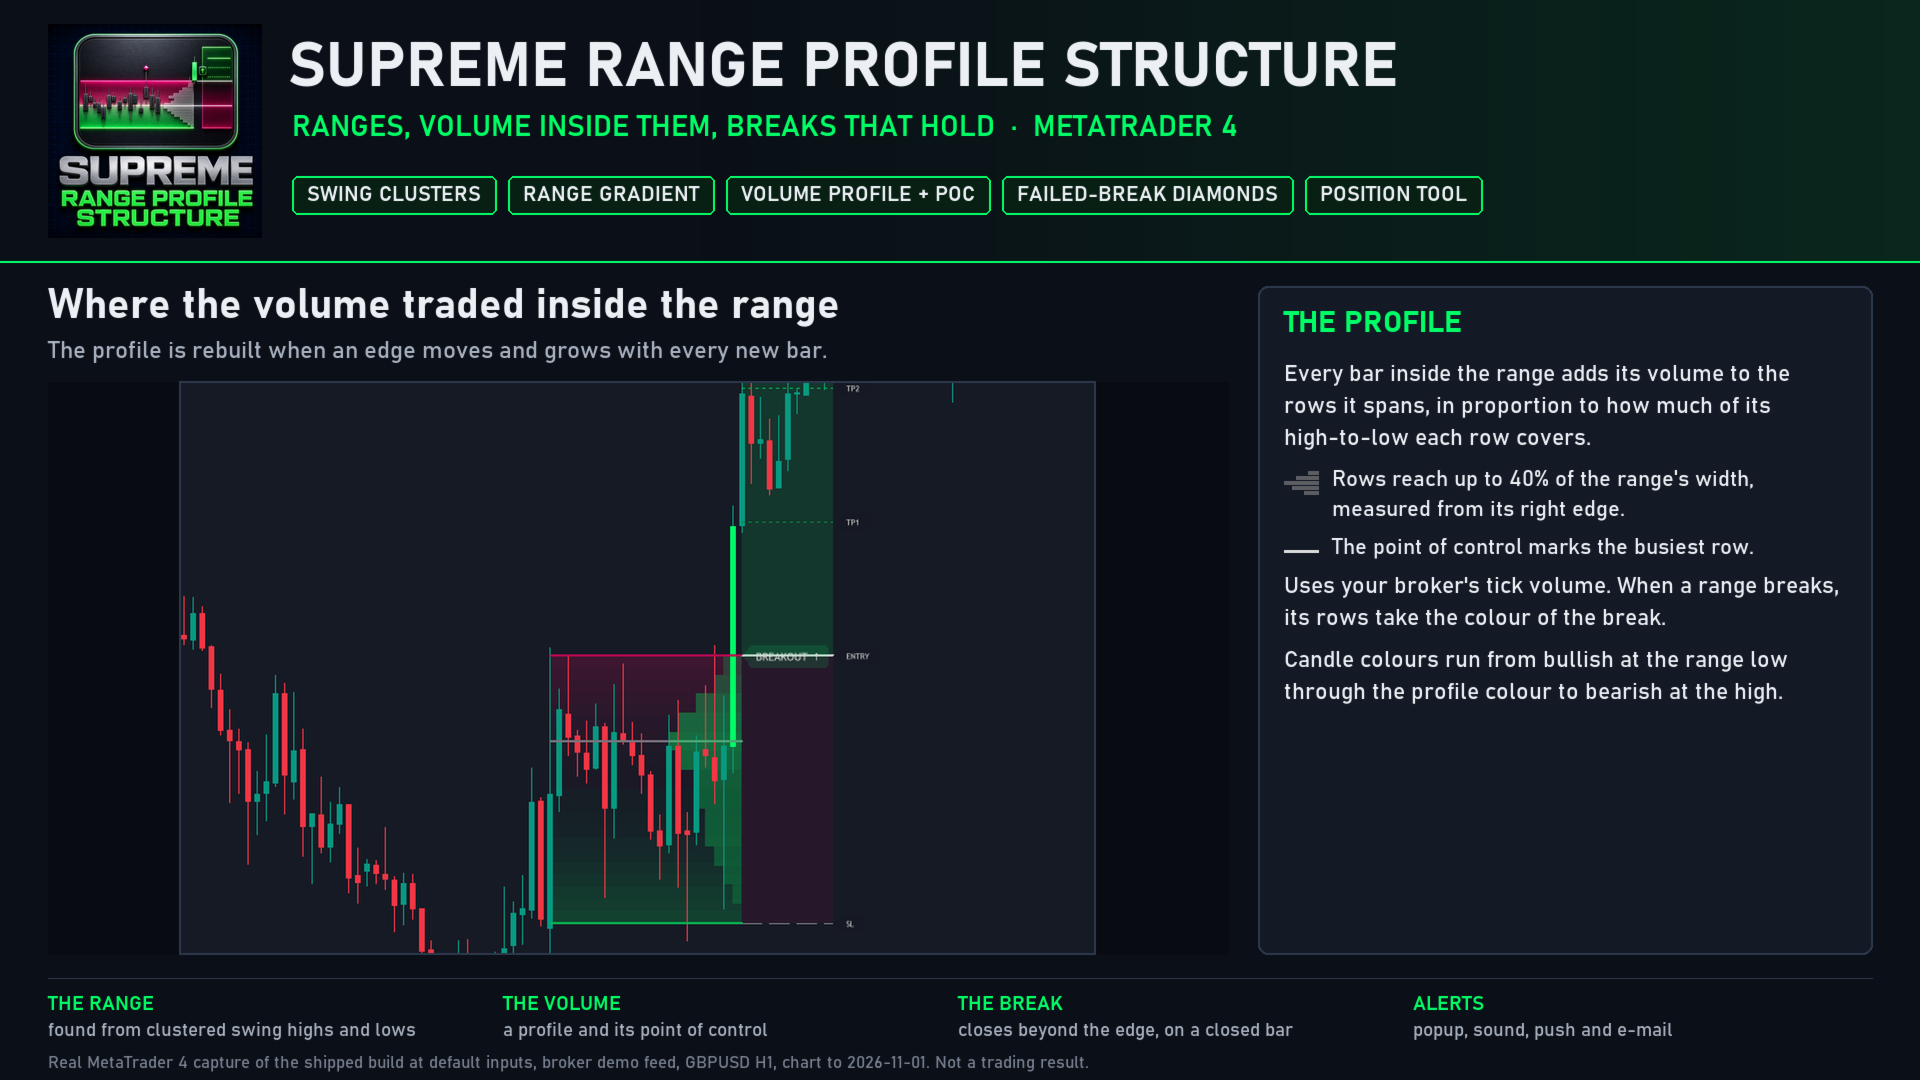
- A volume profile inside the range: 14 horizontal rows by default (8 to 16) against its right edge, each as long as the volume traded at its prices, with a point-of-control line at the busiest row.
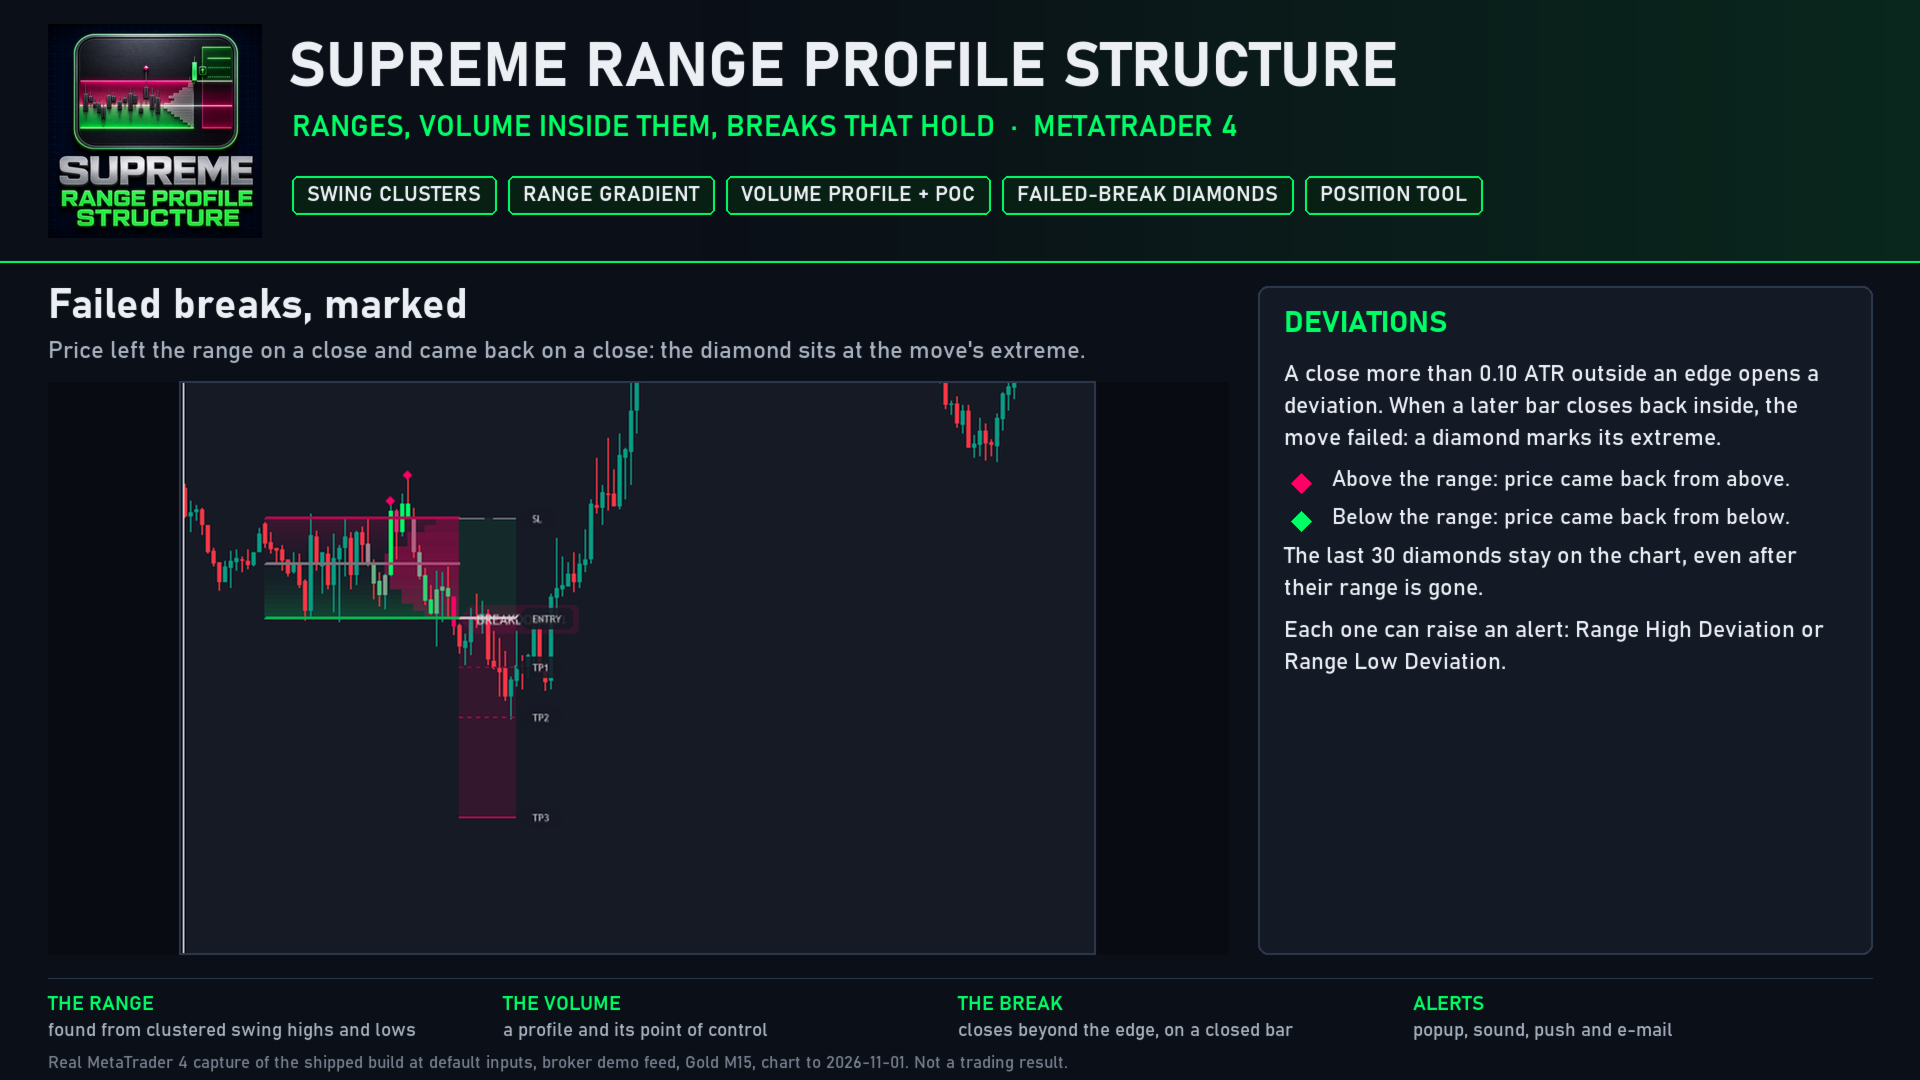
- Diamonds at the extreme of every move that closed outside the range and then closed back inside it: above the range when price came back from above, below it when it came back from below.
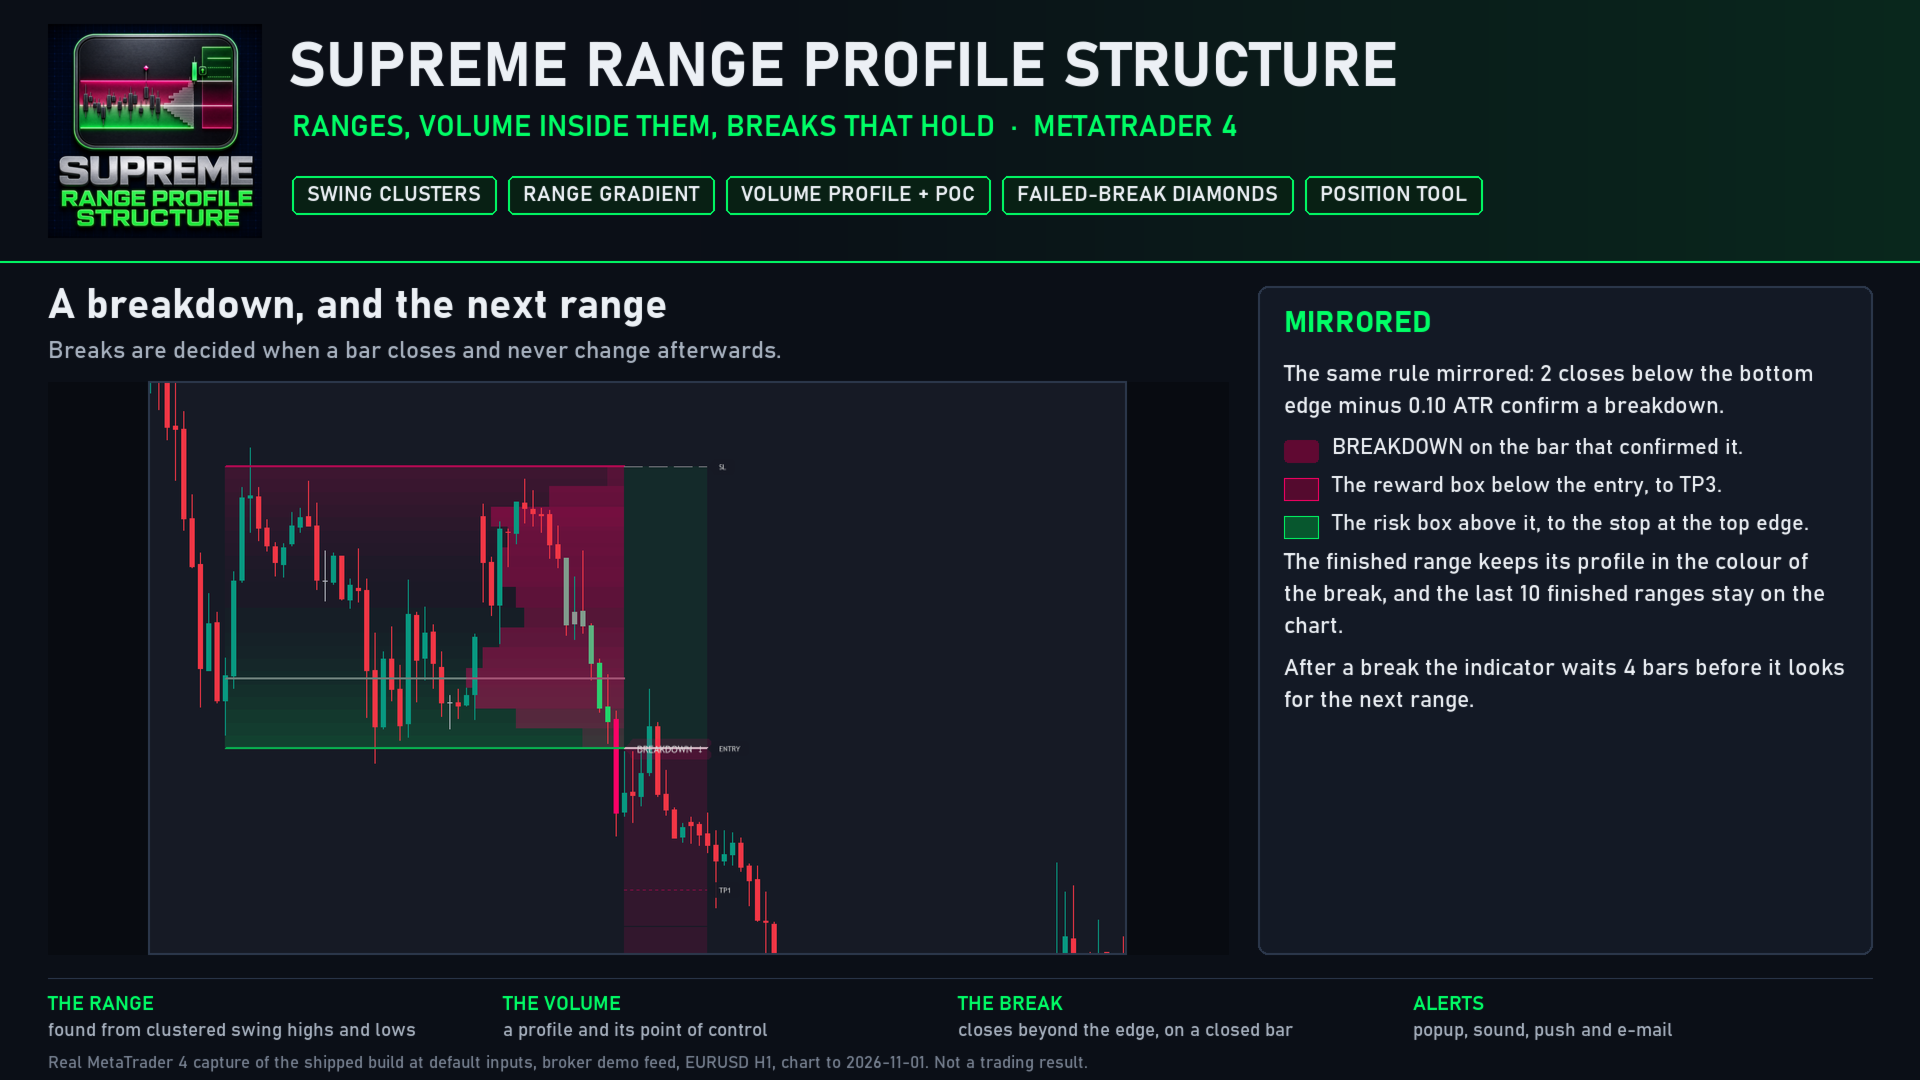
- The BREAKOUT or BREAKDOWN tag on the bar that confirmed a break.
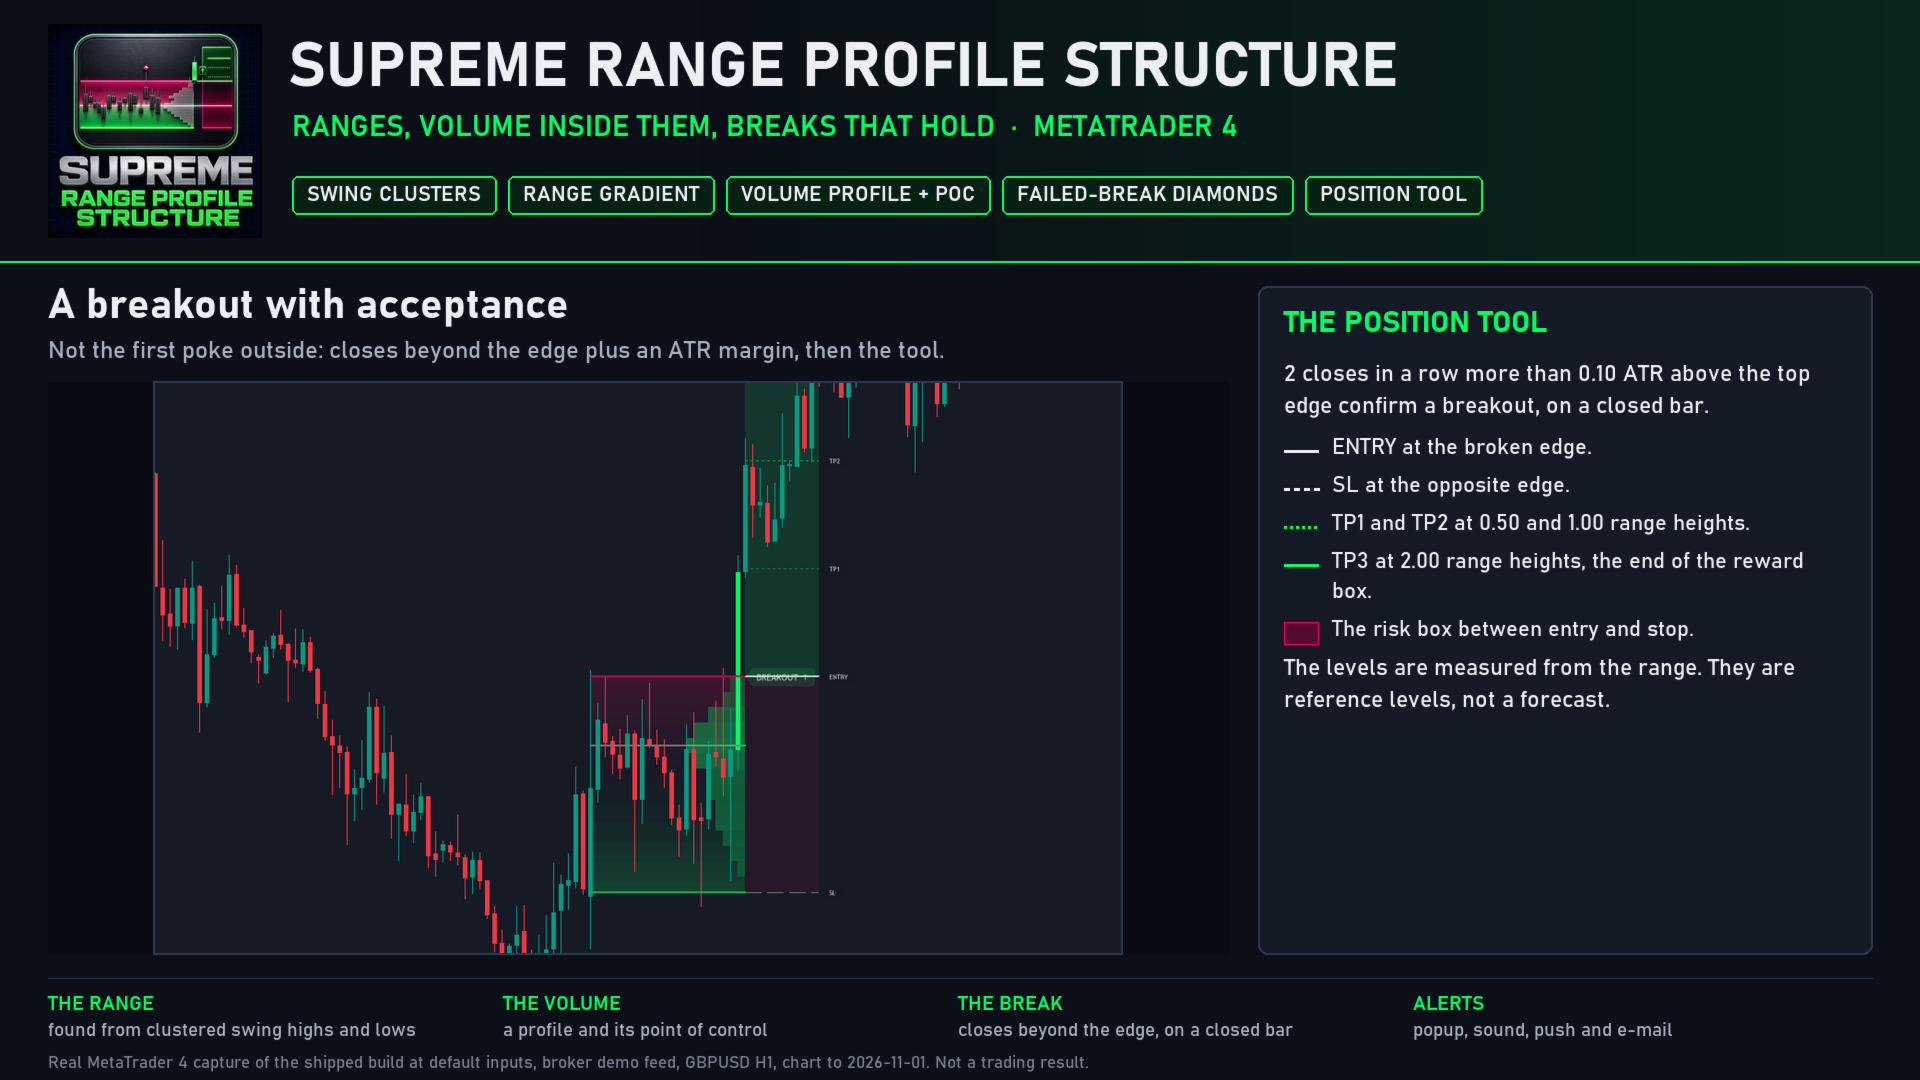
- A position tool on every break: entry at the broken edge, stop at the opposite edge, three targets at 0.50, 1.00 and 2.00 times the range height, a reward box and a risk box, and ENTRY, SL, TP1, TP2 and TP3 tags.
- Candles coloured by where they close inside the active range, in 26 steps from bullish near its low to bearish near its high, and in full colour once they close outside.
- An optional dotted equilibrium line at the middle of each range.
- The last 10 finished ranges stay on the chart with their profile, tag and position tool.
- The shading and the profile are drawn behind the candles in solid colours, each the blend of the transparent colours over your chart's background, and the lines and tags over the candles.
HOW IT DECIDES
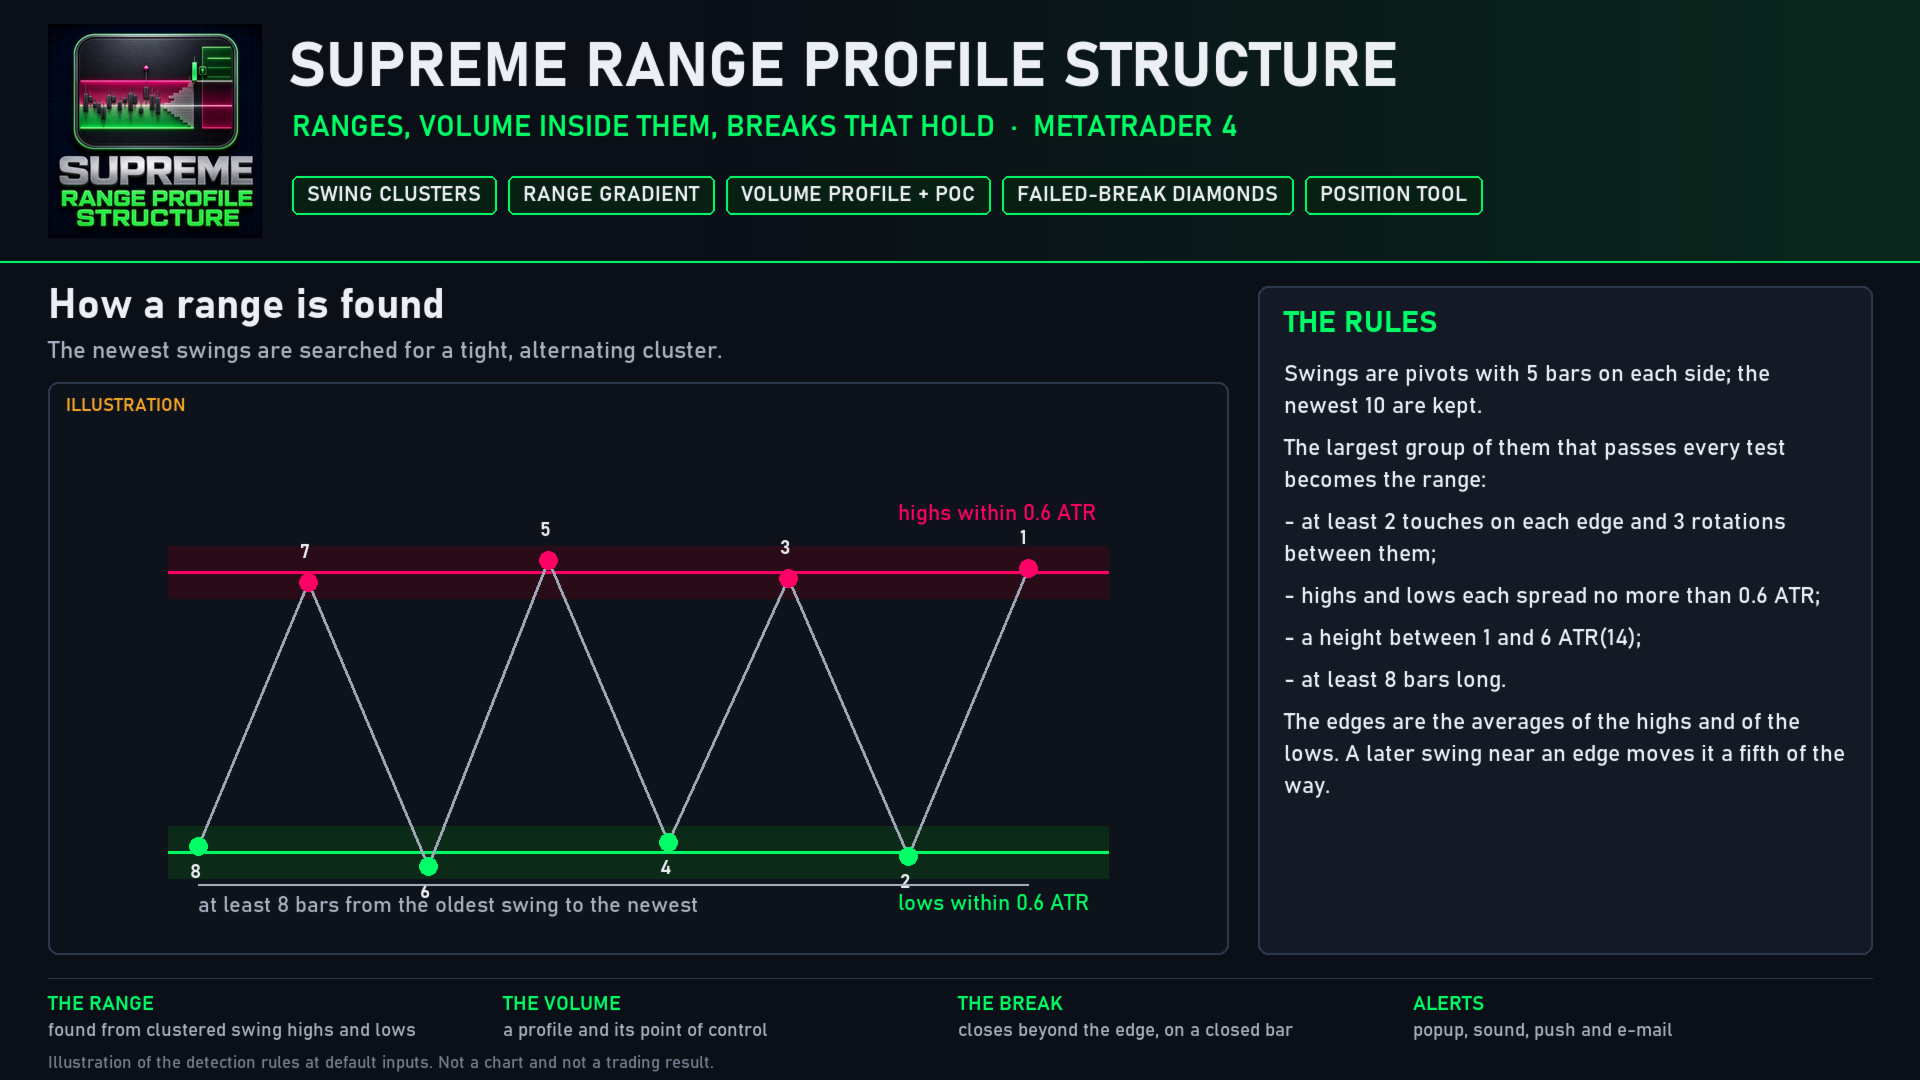
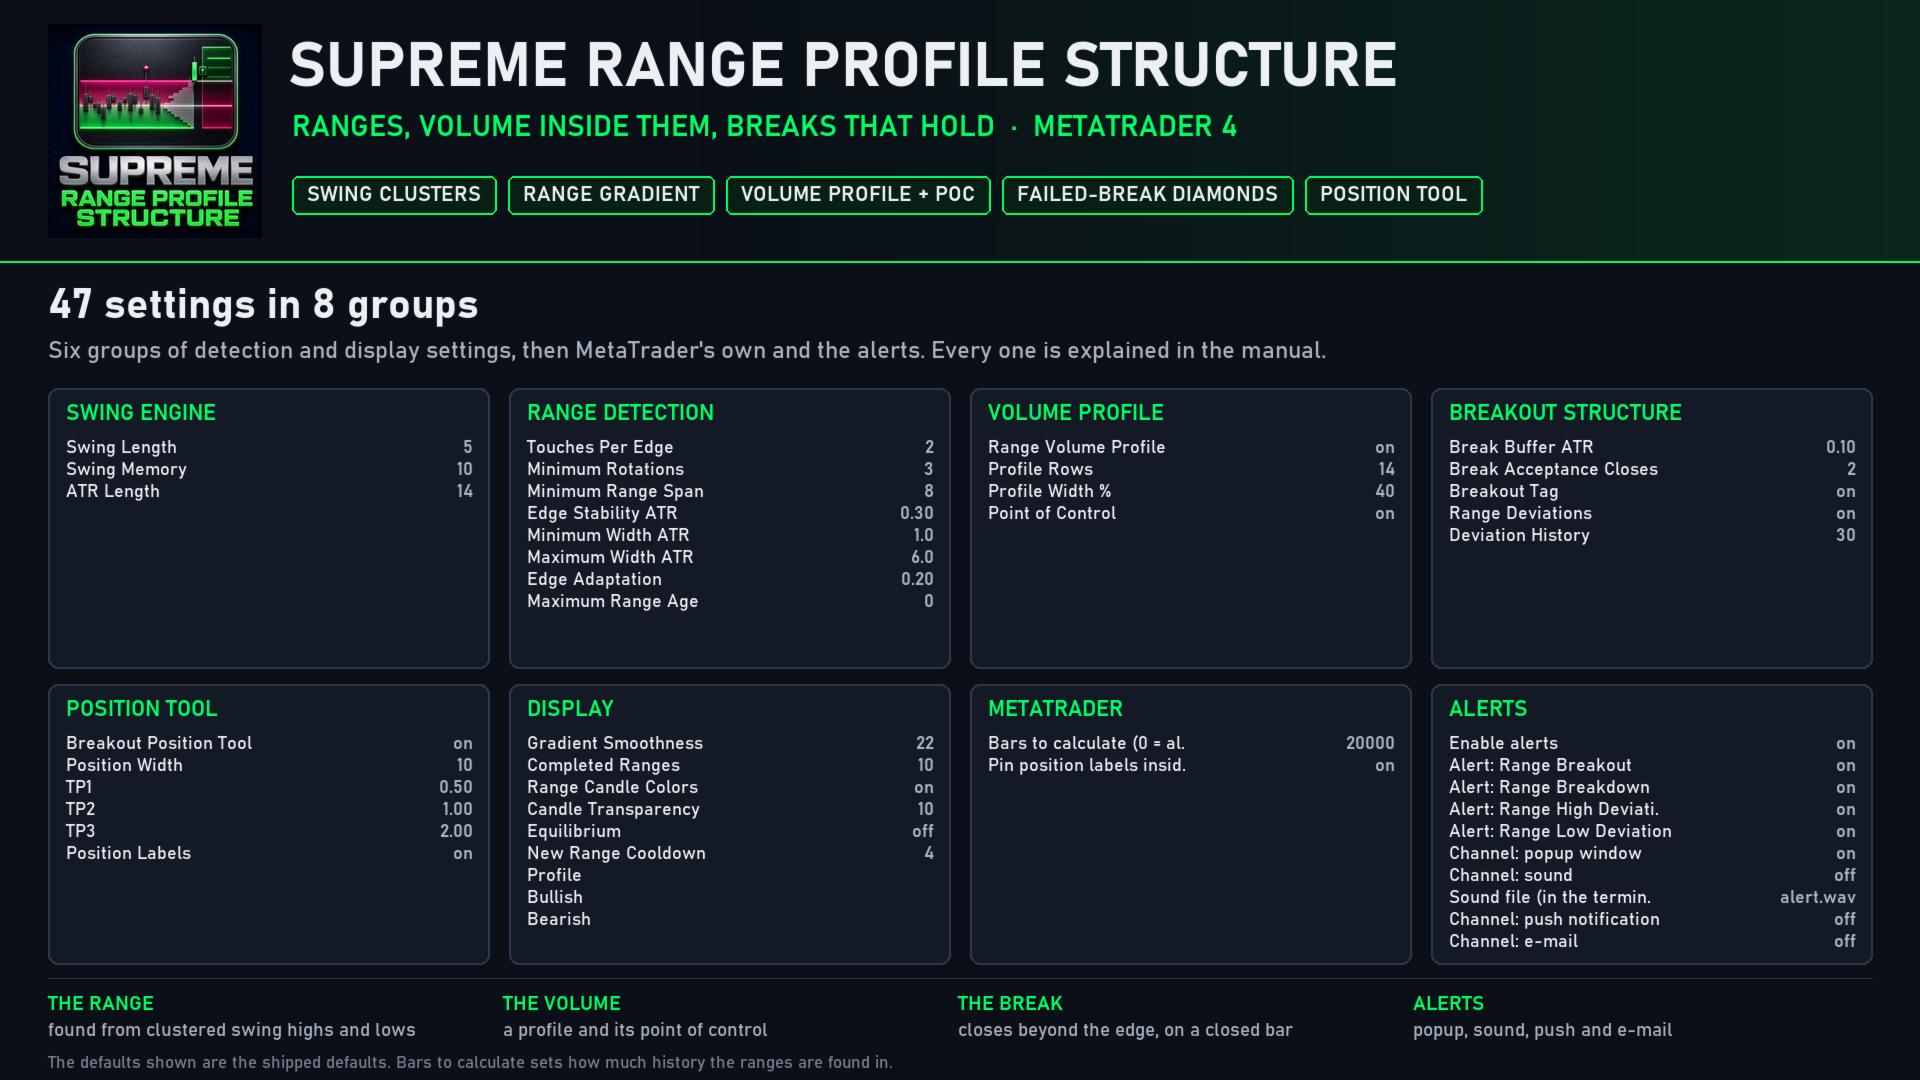
- Swings are pivots with 5 bars on each side. The newest 10 swings are searched for the largest group whose highs spread no more than 0.6 ATR, whose lows do the same, with at least 2 touches on each edge, 3 rotations between them, covering at least 8 bars, and a height between 1 and 6 ATR. The averages of those highs and lows become the range edges.
- While the range is active, a new swing that comes close to an edge moves that edge a fifth of the way toward it and counts as a touch, and the profile grows with every new bar.
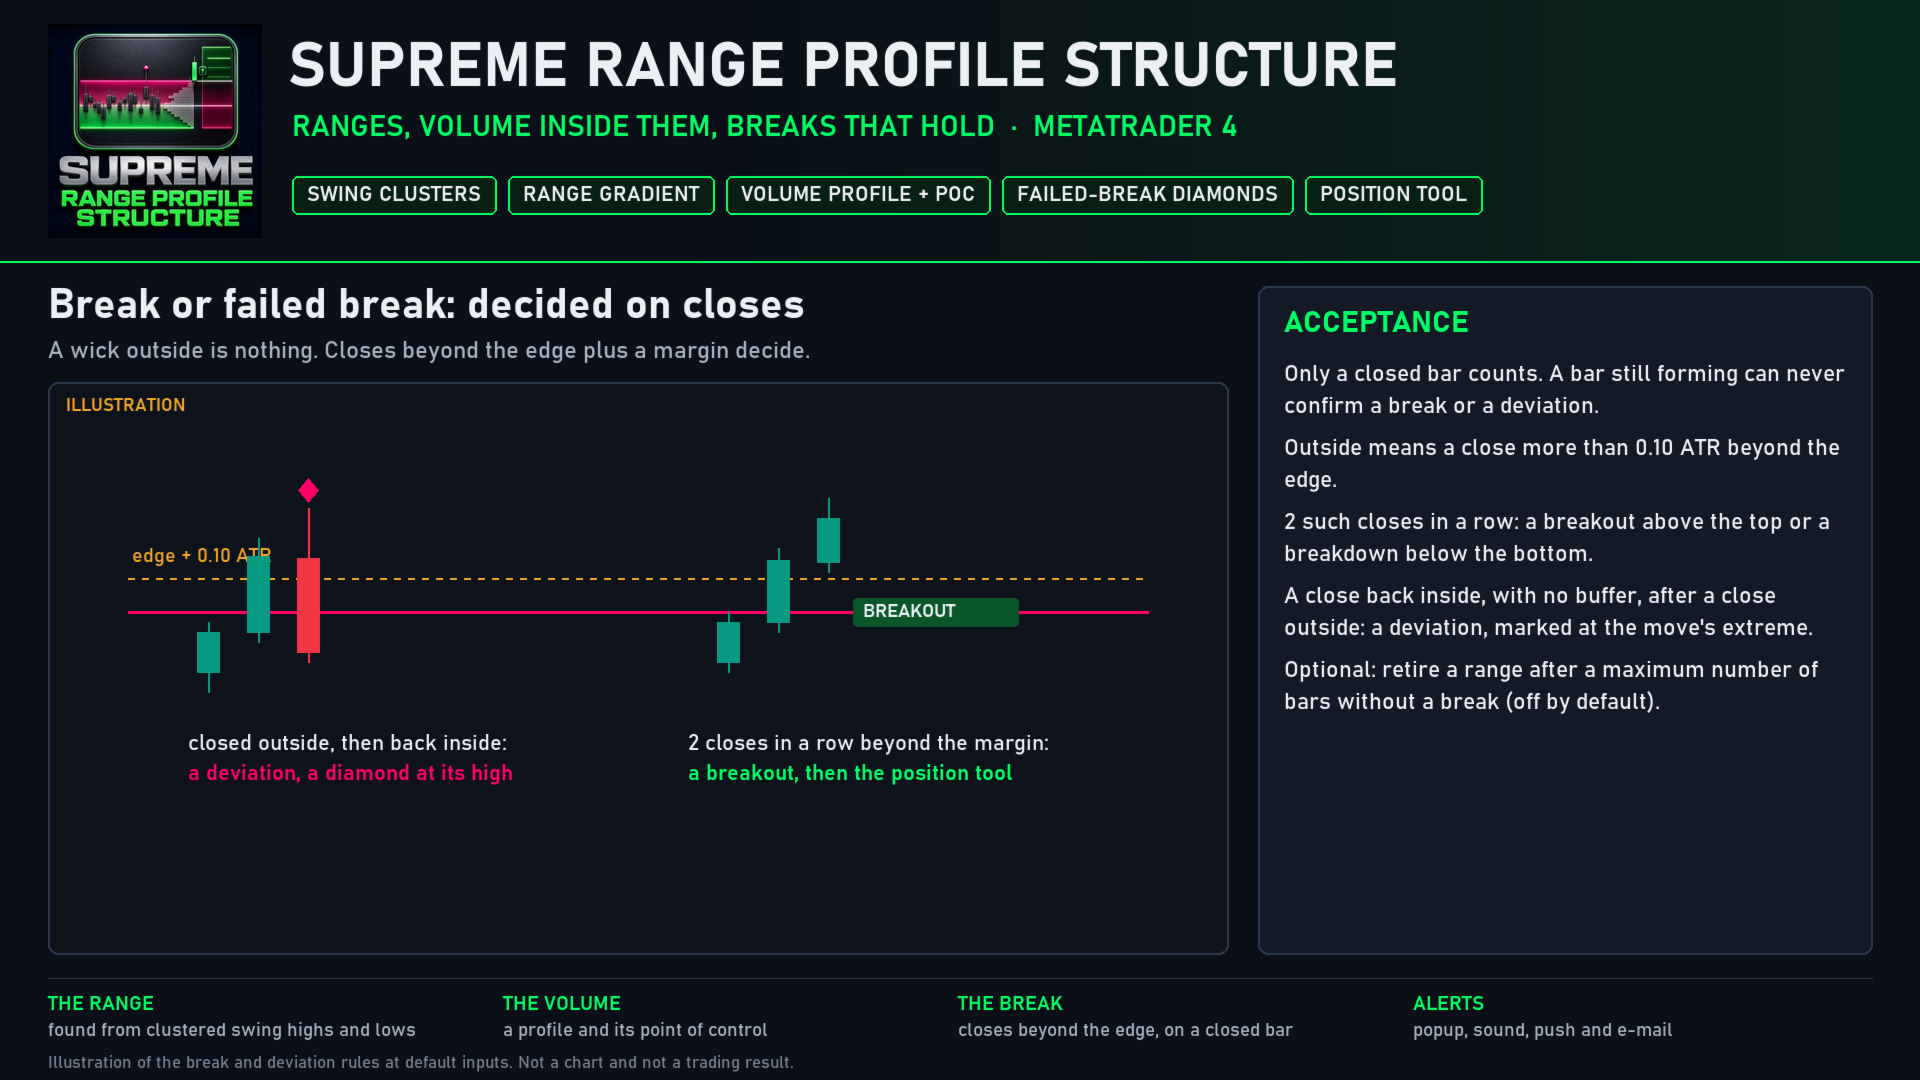
- A close more than 0.10 ATR beyond an edge counts as outside, and 2 such closes in a row confirm a breakout or a breakdown. A move that closed outside and then closed back inside is a deviation, marked at its extreme. A range can be retired after a maximum number of bars too, without a break (off by default). After a range is resolved, the indicator waits 4 bars before it looks for the next one.
- Every width, tolerance and break margin is measured in ATR(14), so the same settings fit each market's own volatility.
ALERTS
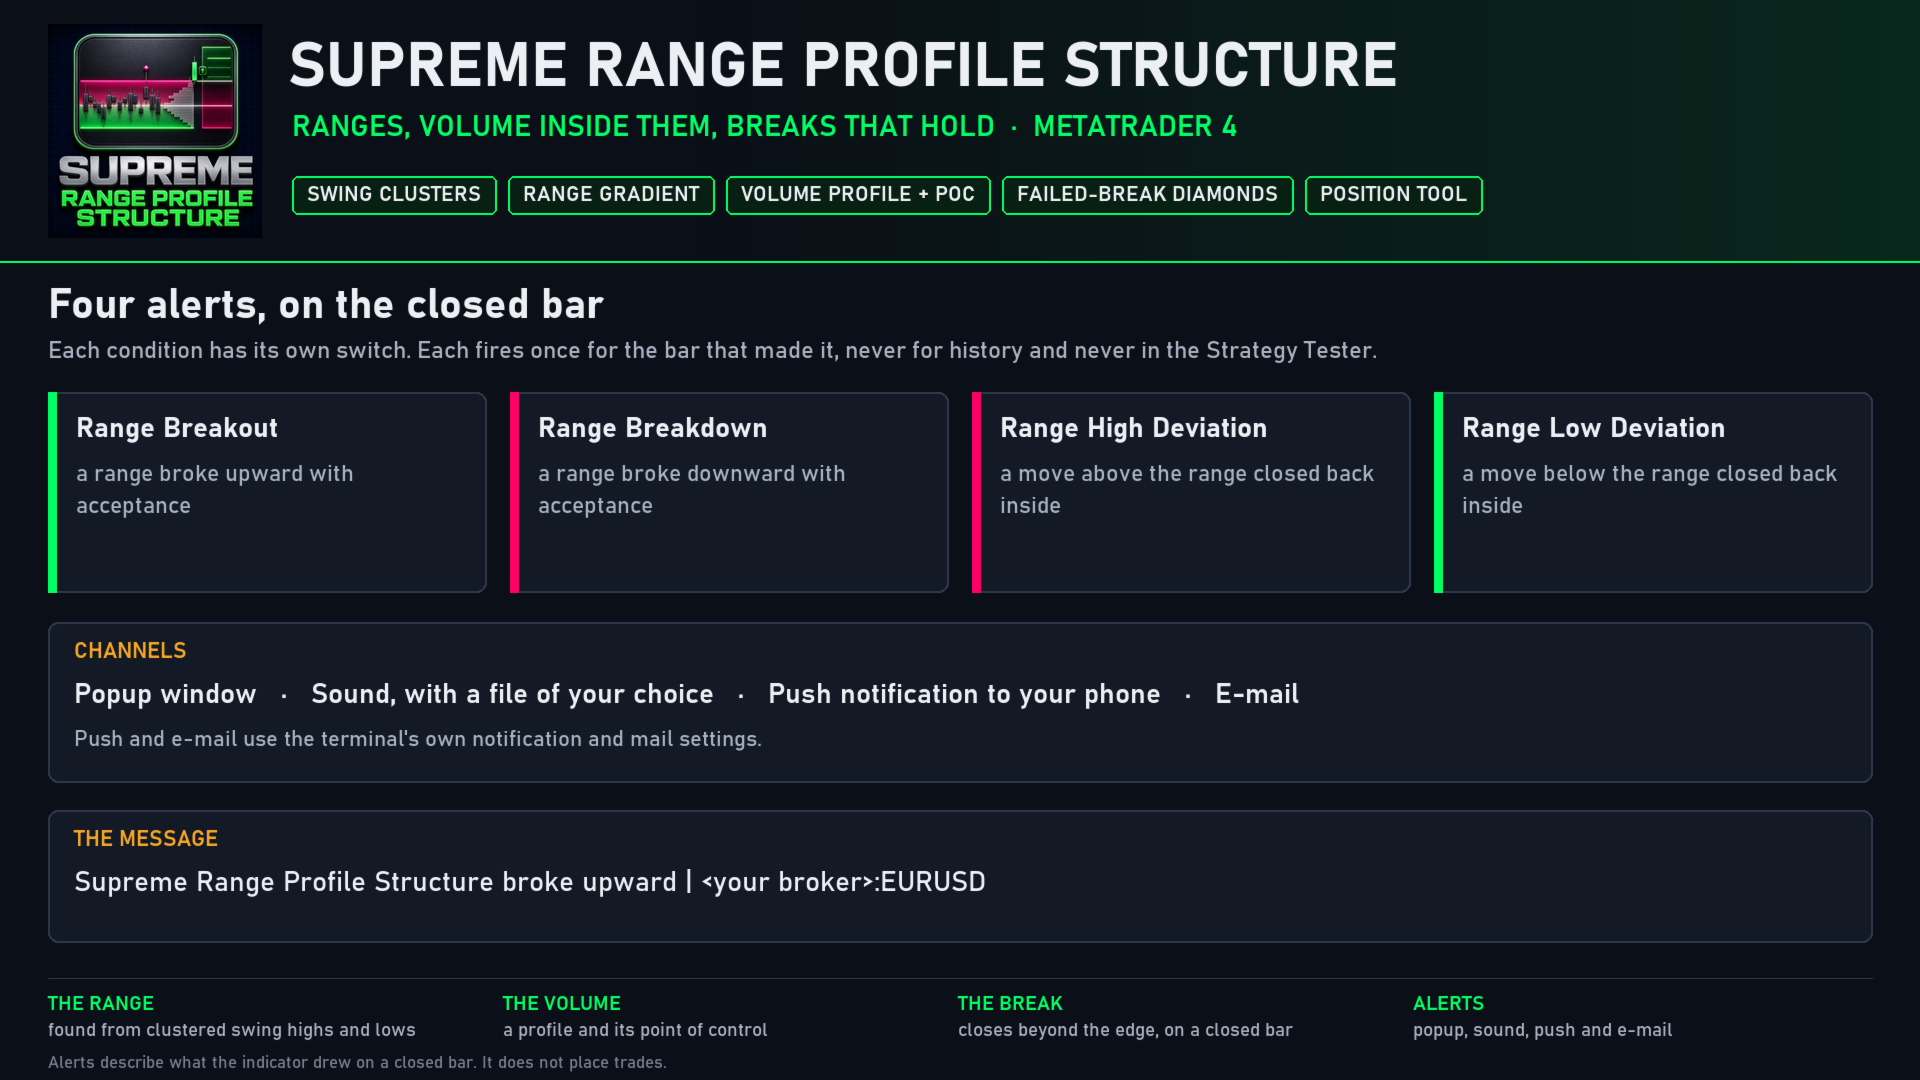
Four conditions, each with its own switch: a breakout, a breakdown, a high deviation and a low deviation. Channels: popup, sound with a file of your choice, push notification and e-mail. Every alert is decided on a closed bar, fires once for that bar, and never fires for history or in the Strategy Tester. Example:
Supreme Range Profile Structure broke upward | Your Broker:EURUSD
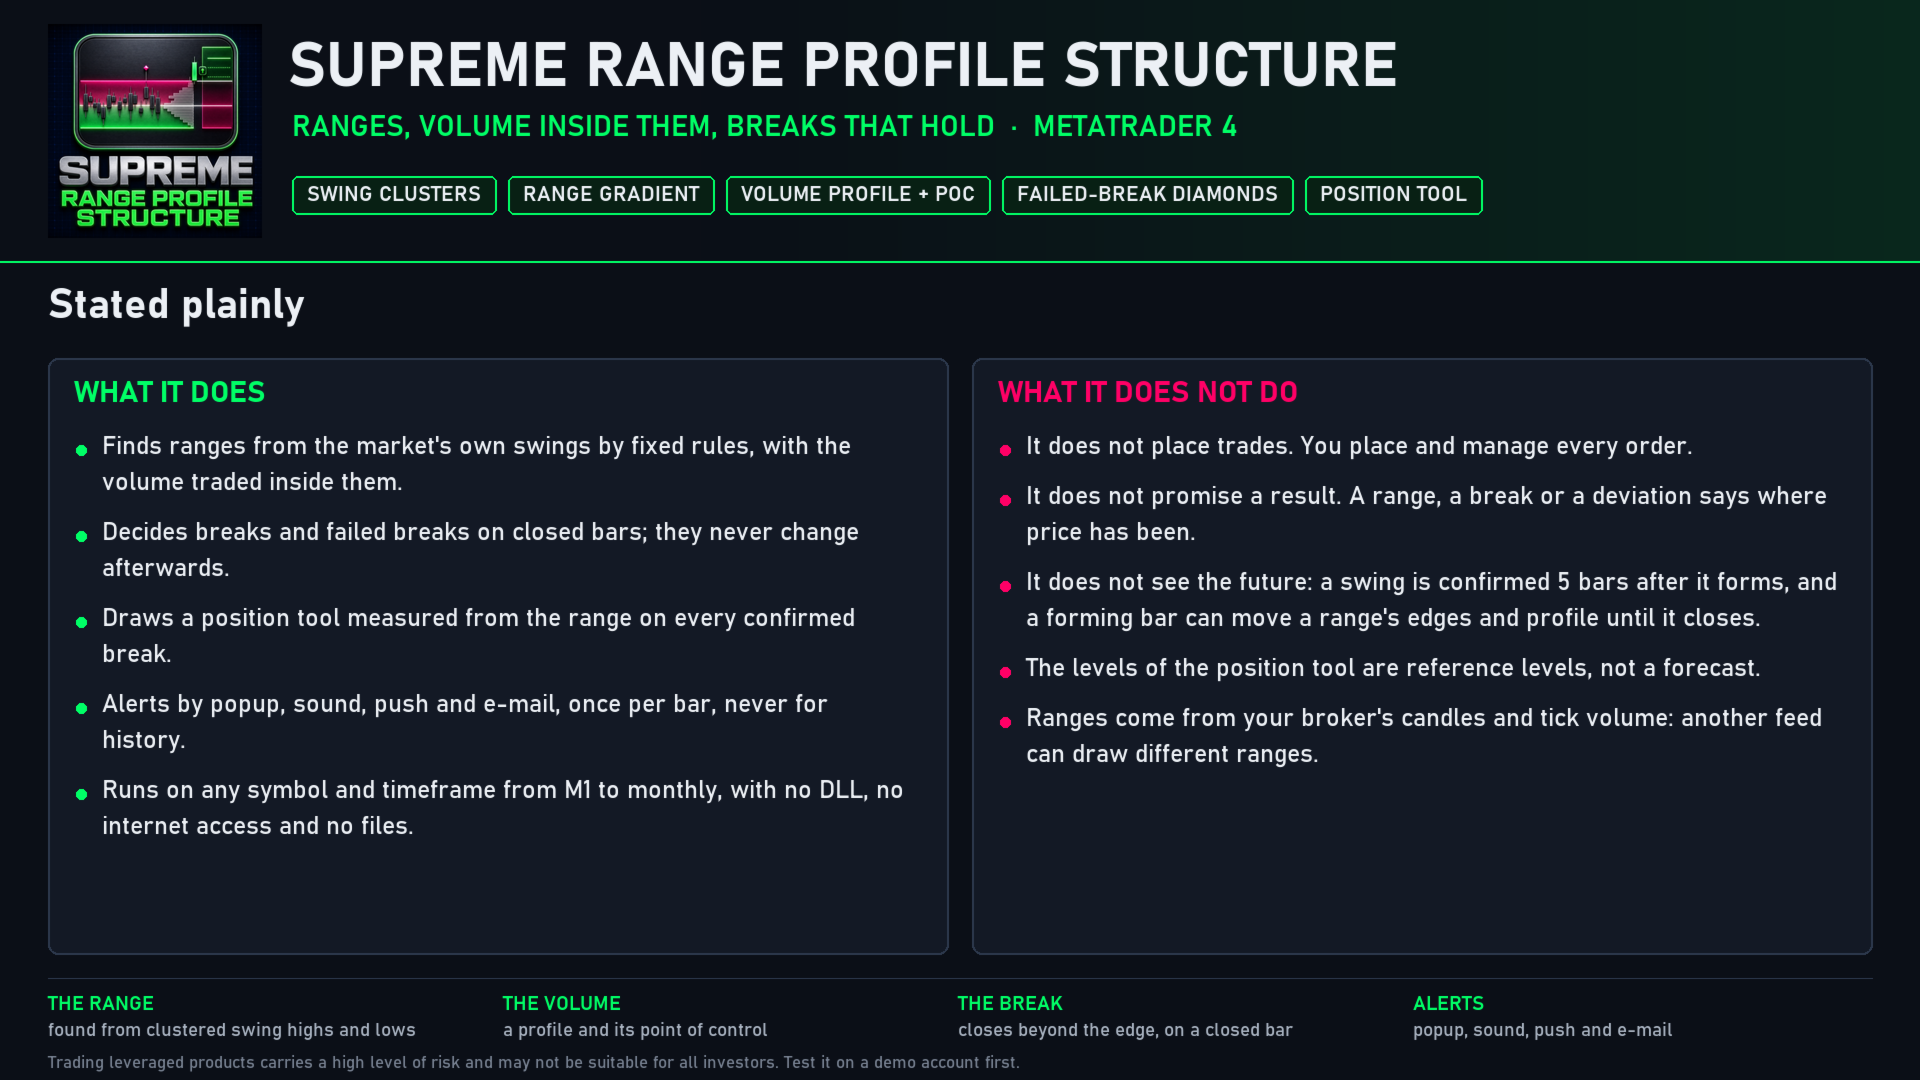
WHAT IT DOES NOT DO
- It does not place trades. It draws and alerts; you place and manage every order. The position tool's levels are measured from the range; they are reference levels, not a forecast.
- It does not promise a result. A range, a break or a deviation says where price has been, not where it will go.
- It does not see the future. A swing is confirmed 5 bars after it forms. A range can be found, and its edges and profile can move, while a bar is still forming; breaks and deviations wait for the bar to close, and what a bar shows is final when it closes.
SETTINGS AND NOTES
- 47 inputs in 8 groups, each explained in the manual. It runs on any symbol and timeframe from M1 to monthly: forex, metals, indices and crypto.
- Bars to calculate (20,000 by default) sets how much history the ranges are found in, and keeps loading fast. With more or less history loaded, the first ranges found may differ.
- The position tool reaches 10 bars past its break. Its tags stay inside the chart while the last bar is in view: with a narrow right margin the tool ends closer to the last bar. With "Pin position labels inside the chart" switched off, the tool keeps its exact bars.
- The profile and its point of control use your broker's tick volume, and the swings use your broker's candles, so another feed can draw different ranges.
- No DLL, no internet access and no files: the indicator only reads the chart it is attached to.
Trading leveraged products carries a high level of risk and may not be suitable for all investors. Supreme Range Profile Structure is an analysis tool, not financial advice. Test it on a demo account first.