Ttf Method
- Indicateurs
- Version: 4.11
- Activations: 5

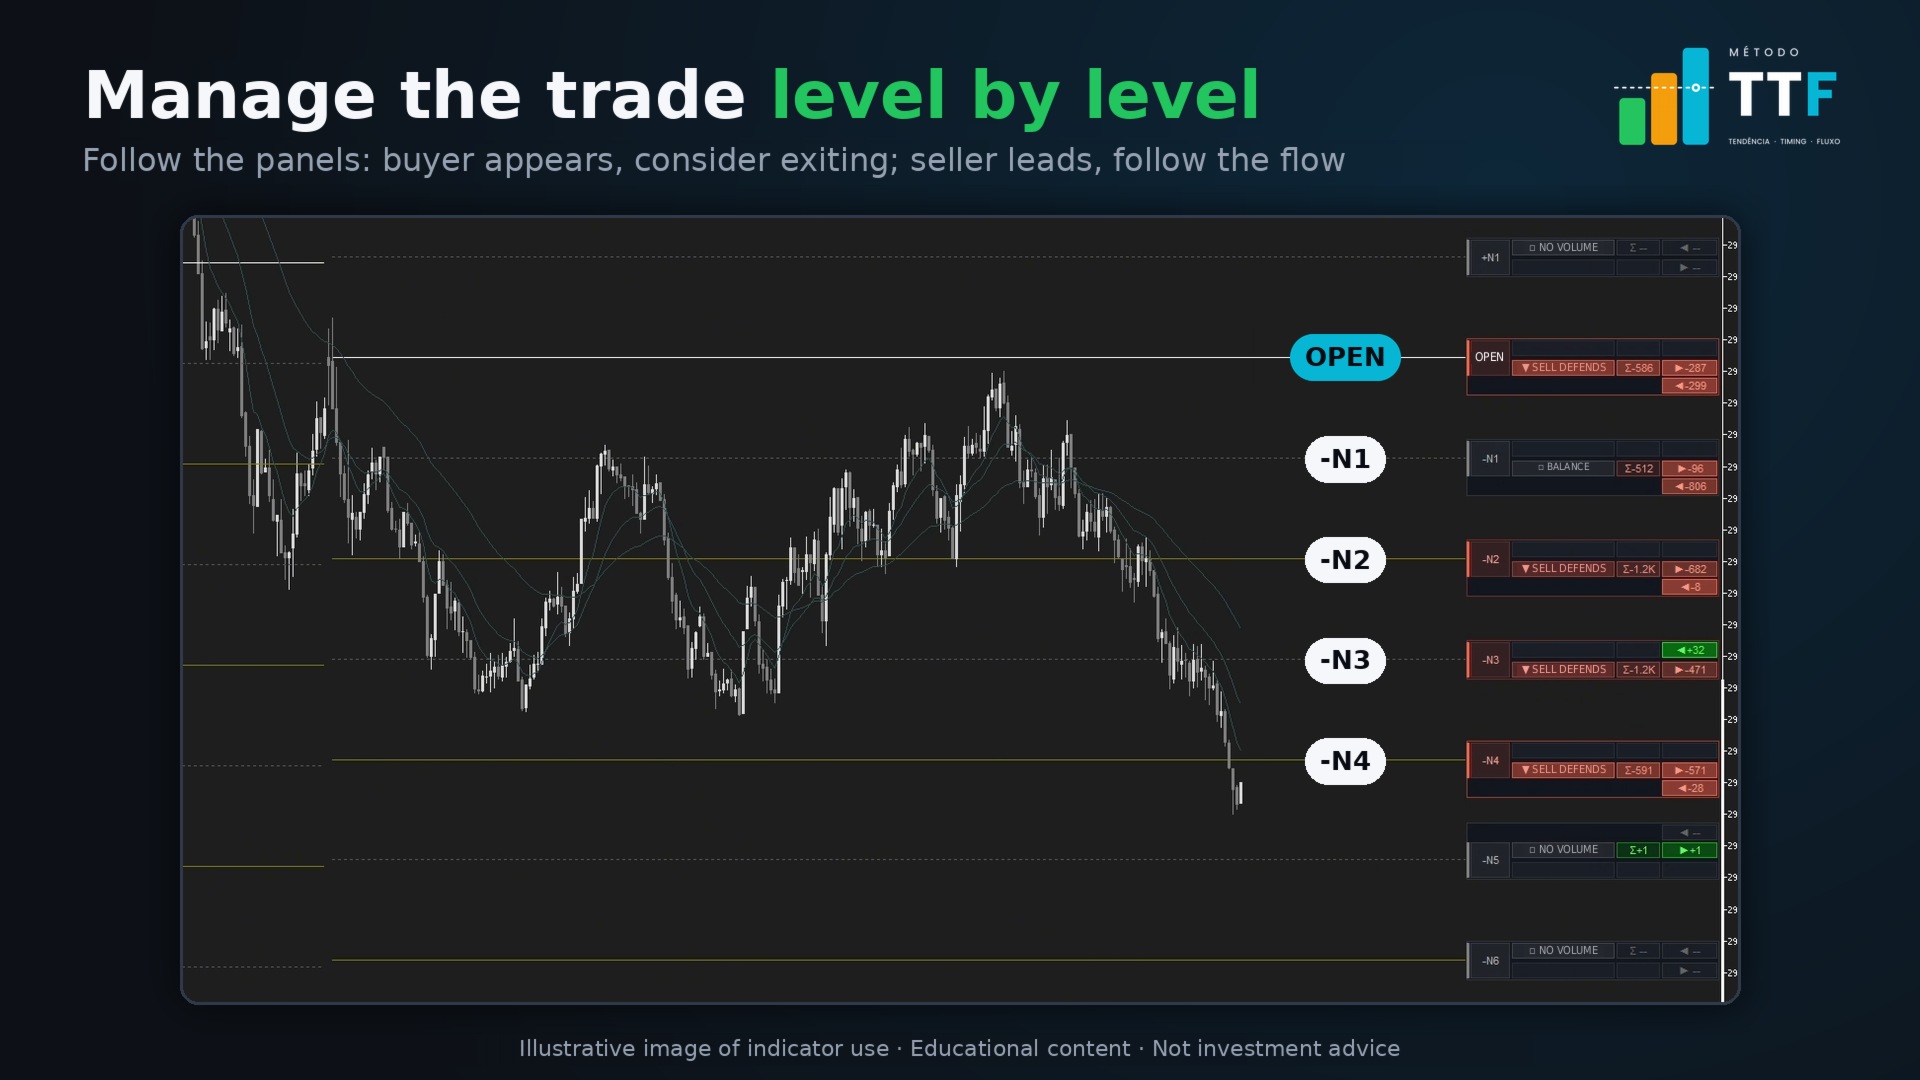
MÉTODO TTF plots levels from the daily open and shows, at each level, who is defending or acting: buyers or sellers. You read the context without switching windows or cluttering your chart.
Features
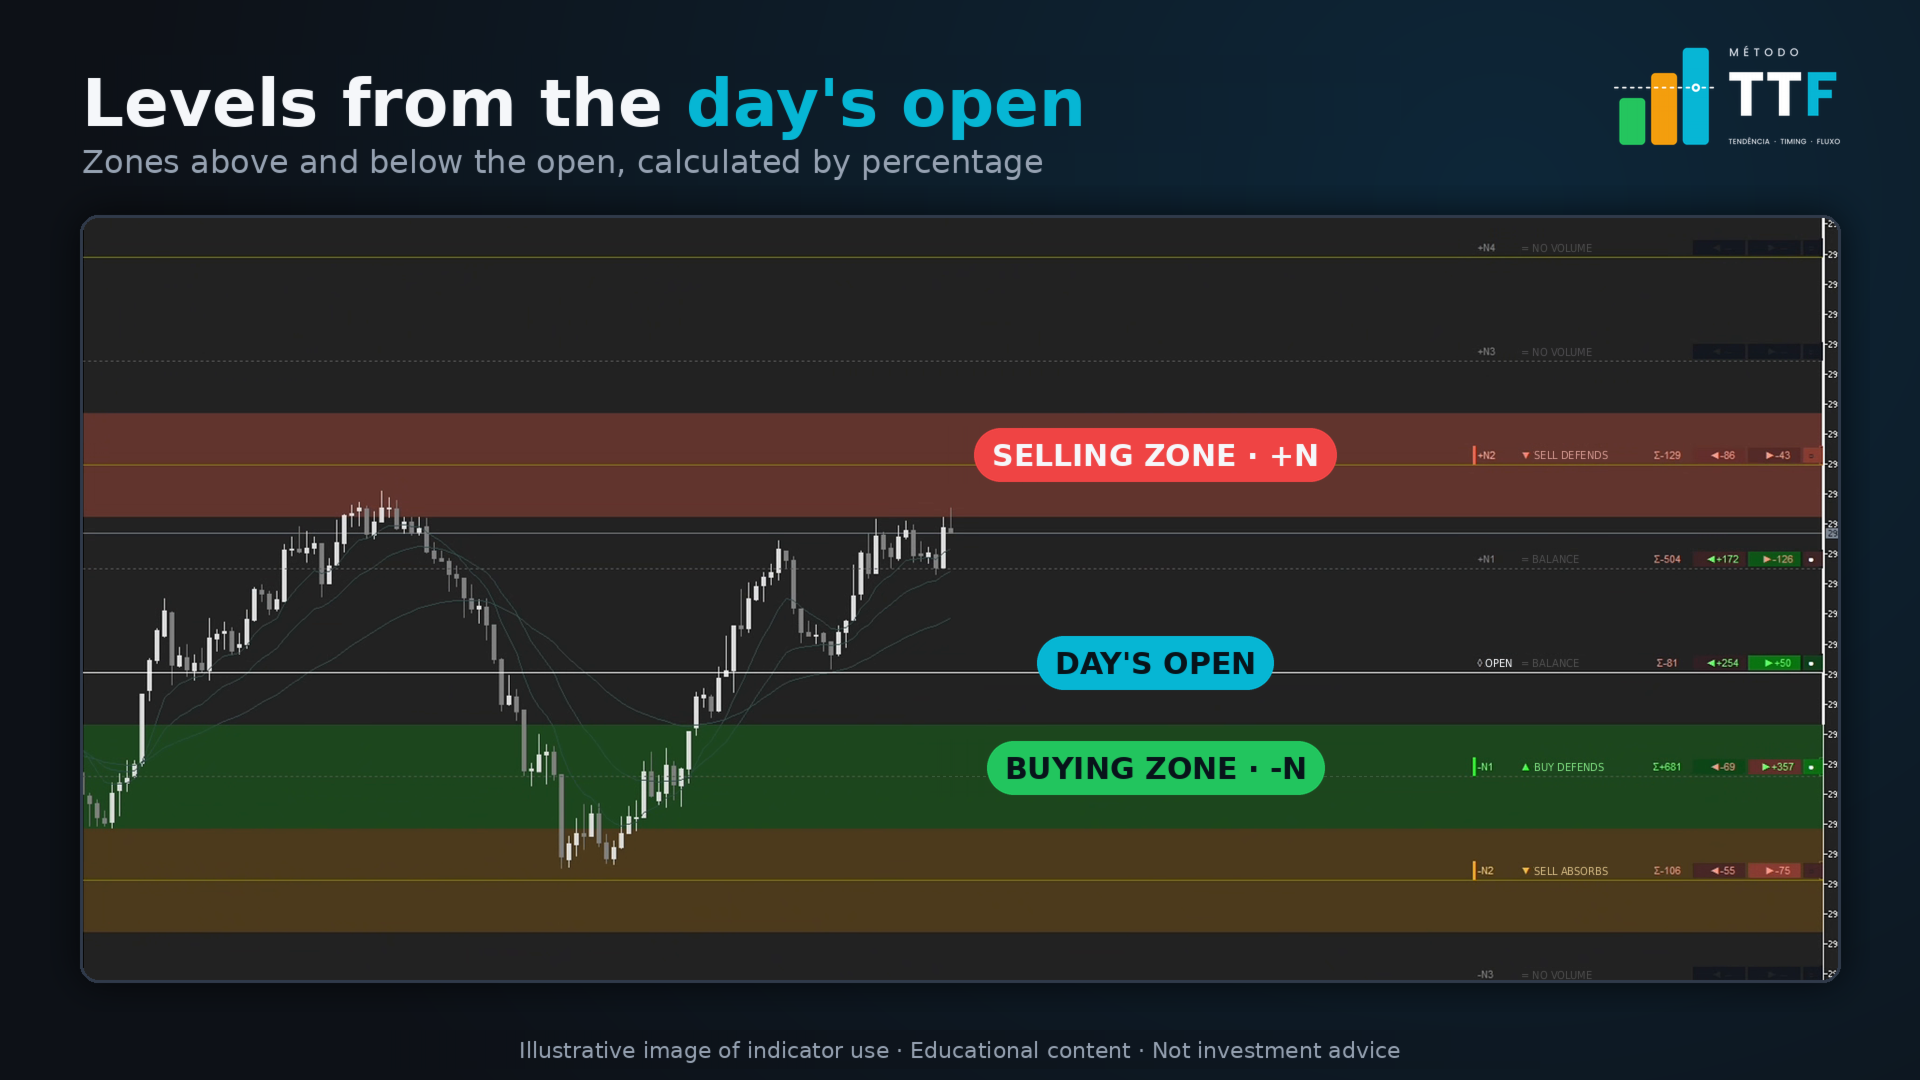
- Daily-open levels: up to 20 levels above and below the open, spaced by a configurable percentage (default 0.50%).
- Shaded zone for each level: buyer zones (green), seller zones (red) and absorption zones (orange) are drawn directly on the chart.
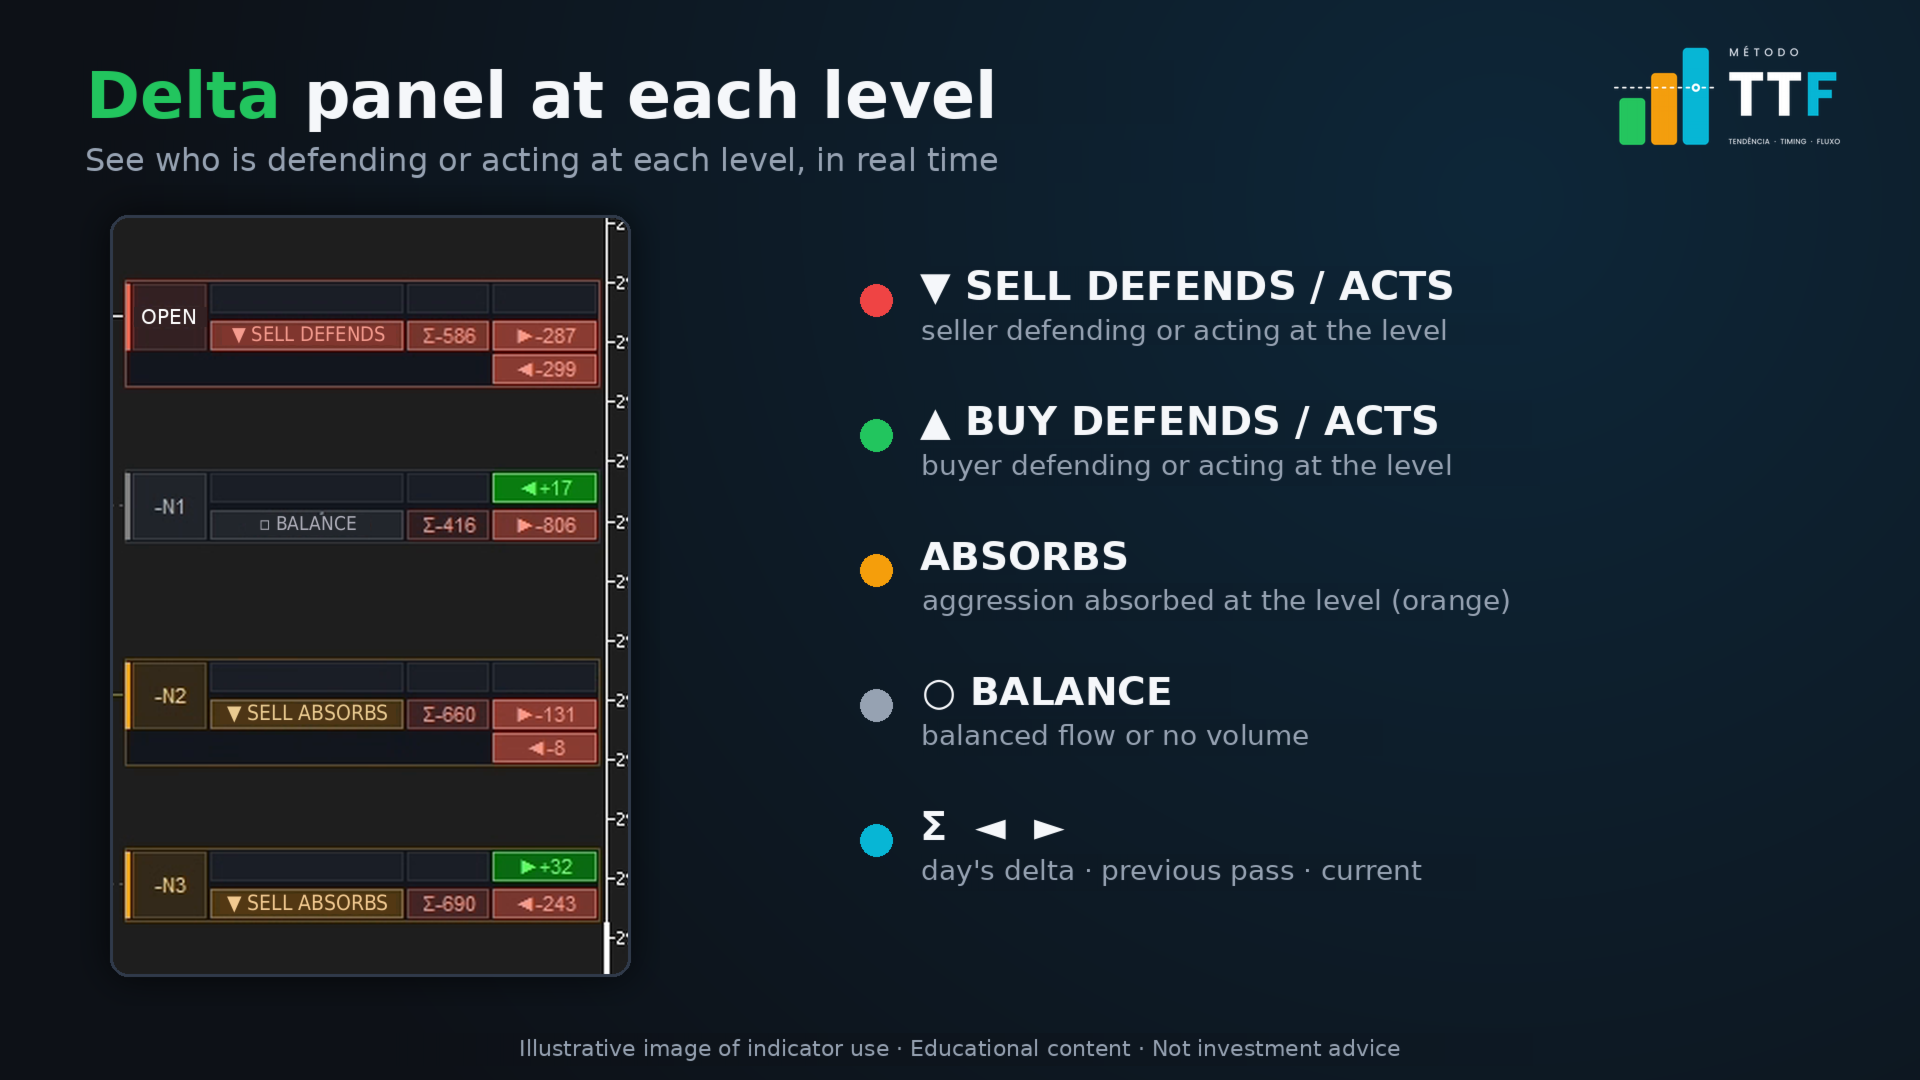
- Delta panel on every level:
- Level state: buyers or sellers defending, acting or absorbing, balance, or no volume.
- Σ: cumulative delta of the day.
- ◄ and ►: delta of the previous and the current price pass through the level.
- Touched-level marker: levels the price has already visited are marked.
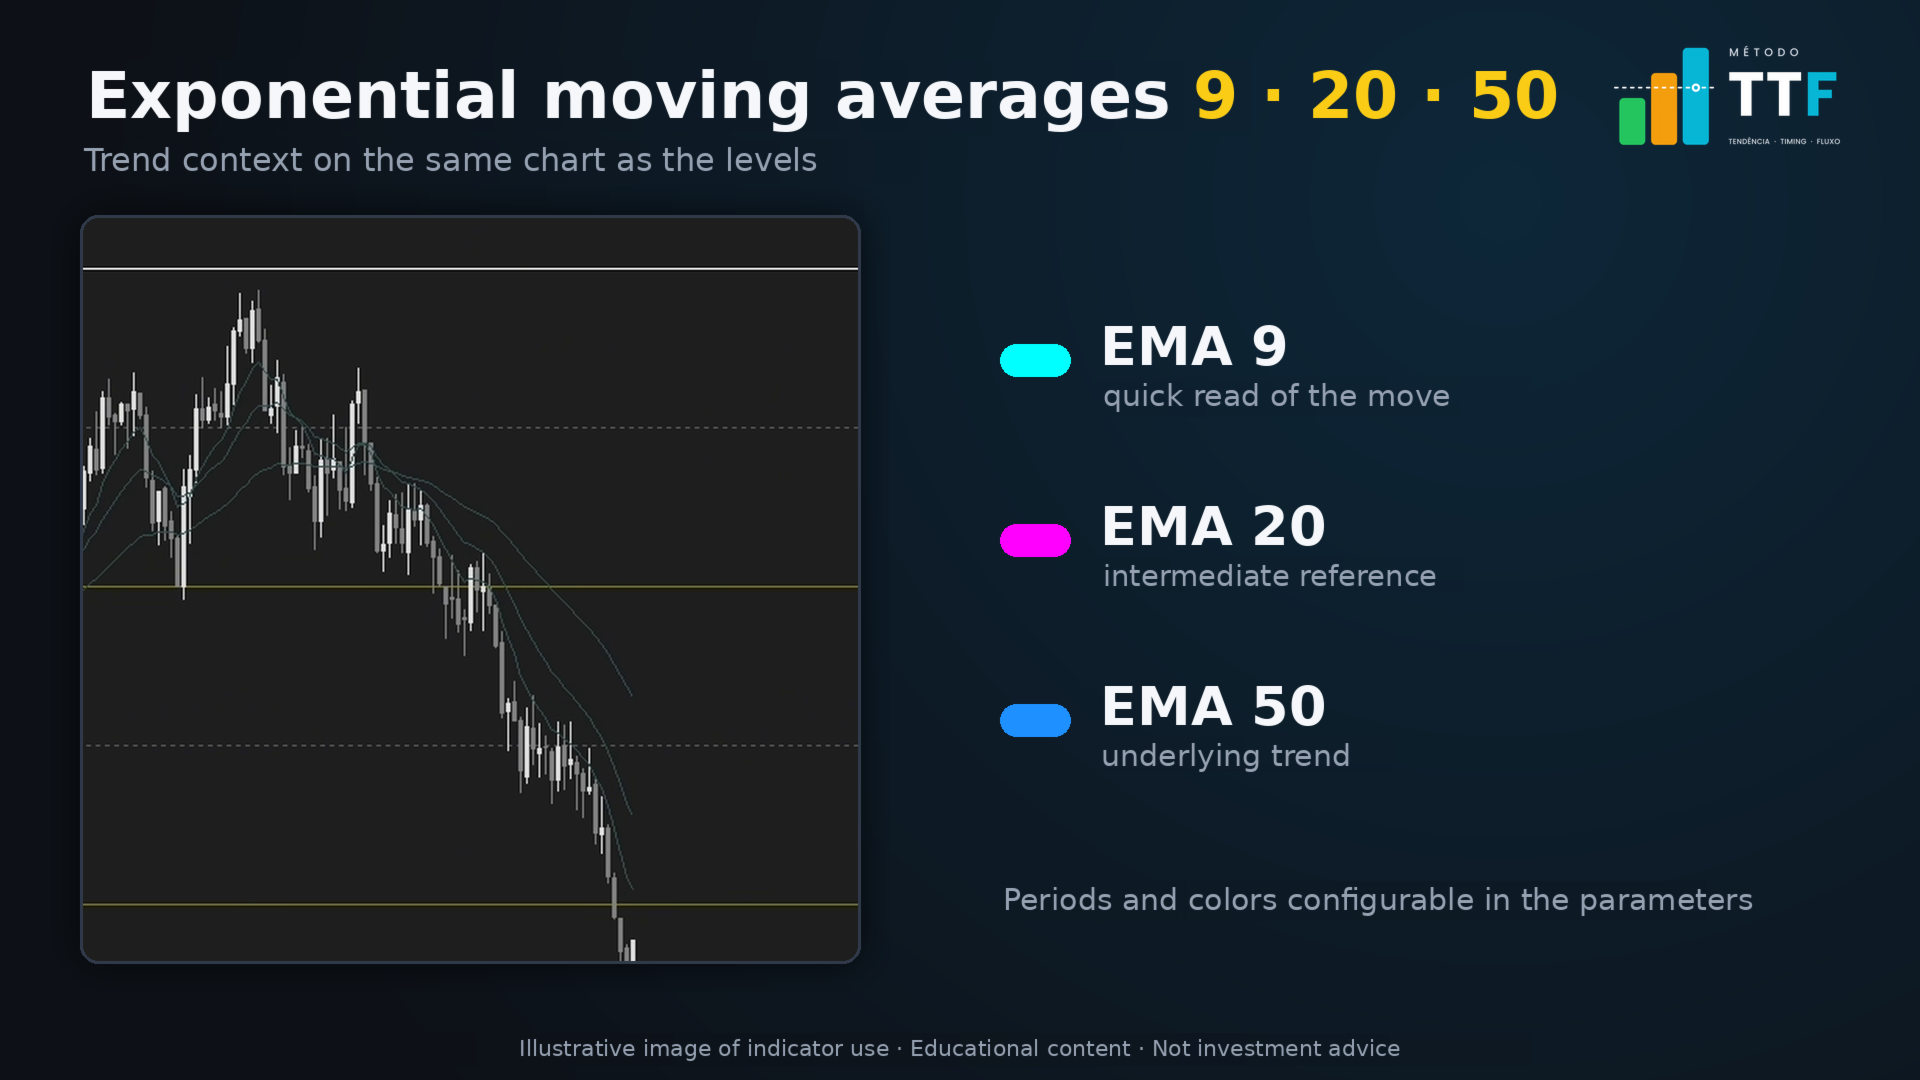
- EMAs 9, 20 and 50: fast, medium and slow exponential moving averages, with configurable periods, colors and line width.
- Customization: percentage between levels, number of levels, start date, colors and flow-classification sensitivity.
How to use (example of reading)
Watch for seller or buyer participation near the open and use the levels as references for entry, stop and partial exits. At each level, check the panel: if the opposite side shows up, reassess the position; if the flow keeps going your way, stay with the move.
Disclaimer
This indicator is an analysis aid. It is not investment advice and does not guarantee results. Trading involves risk of loss. Test it on a demo account and set your own risk management.