Footprint Matrix Pro
- Indicateurs
-
Kay Zaremba
 Trader and MQL4 / MQL5 / Pine Script developer behind trader.lifestyle.
YouTube: youtube.com/@traderlifestyle
What I do:
• Build free indicators and Expert Advisors for MT4, MT5
• Turn strategies from YouTube videos, TradingView scripts and forum posts into working code - Version: 1.0
- Activations: 5
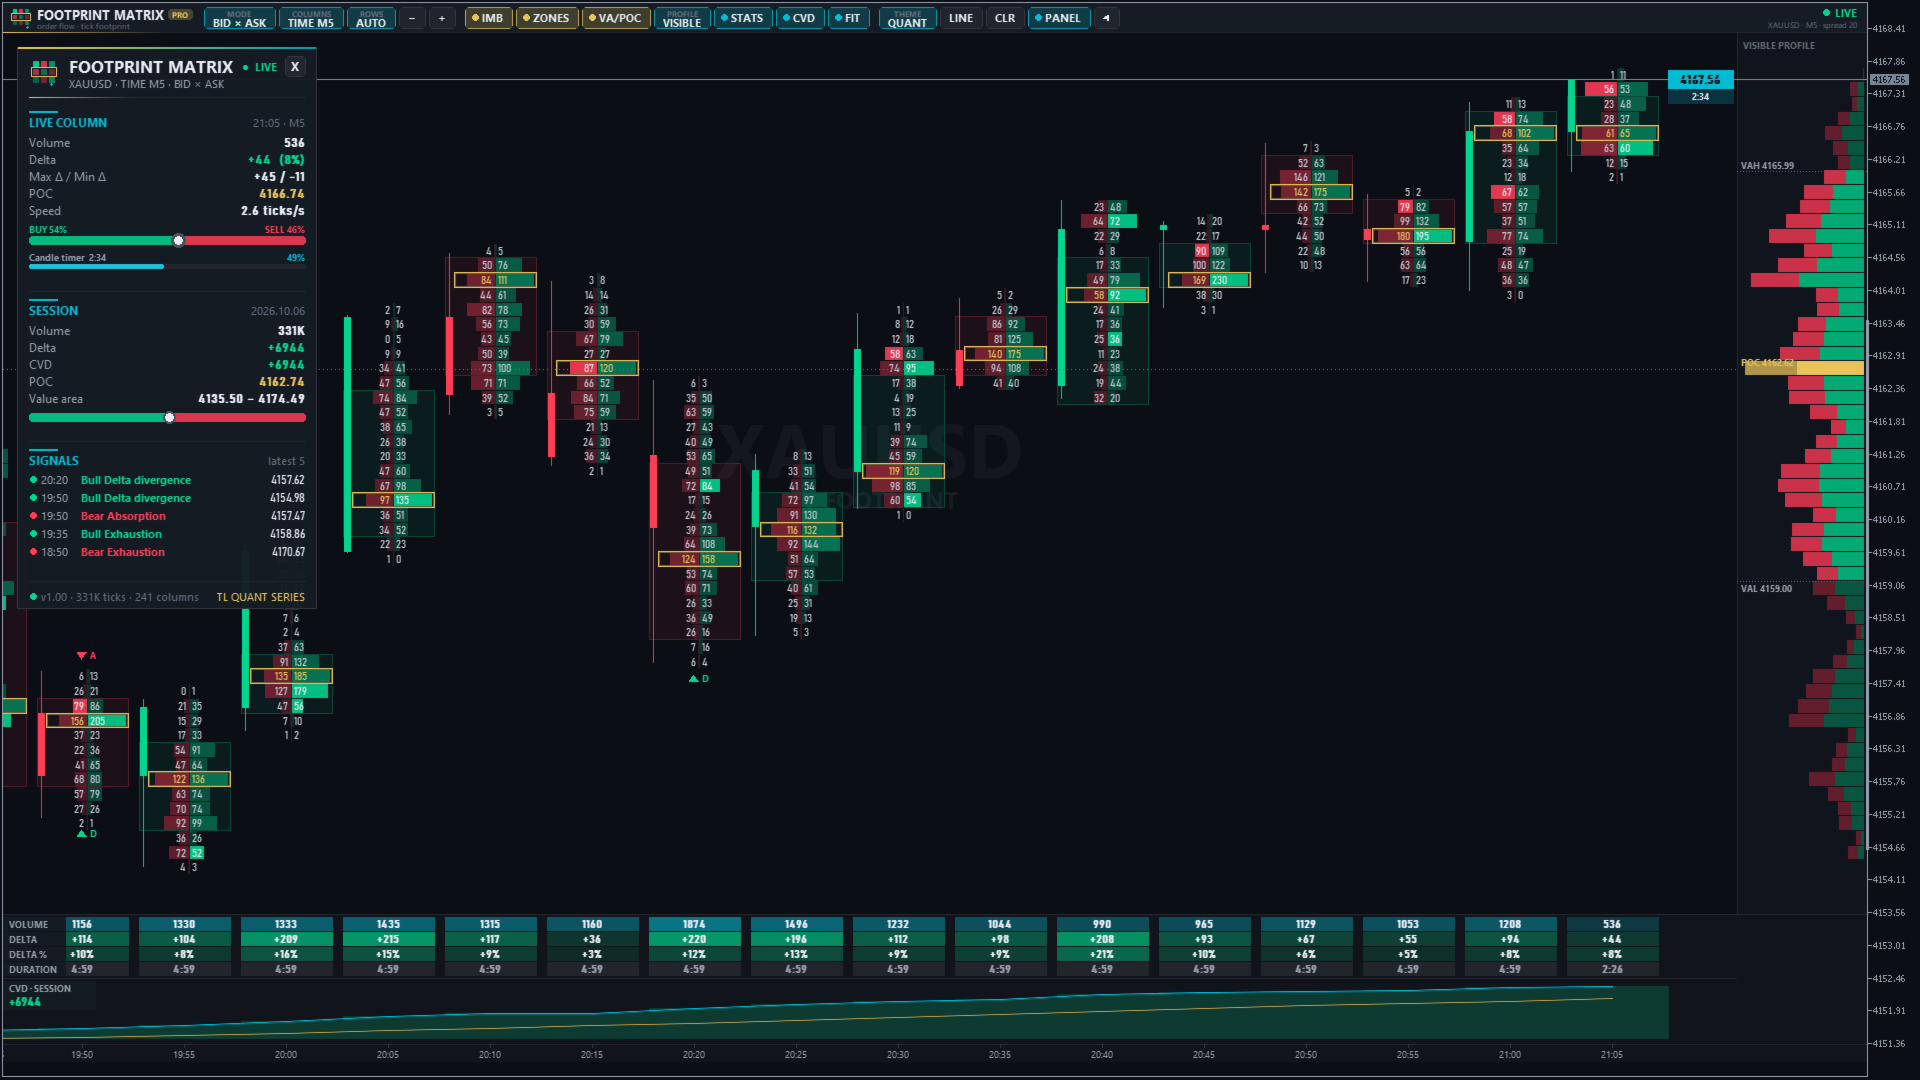
Footprint Matrix Pro turns your MetaTrader 5 chart into an order-flow footprint chart. Every column shows who traded at each price: aggressive buyers lifting the ask against aggressive sellers hitting the bid. It is built from the real tick history of your broker, and every number is recorded tick by tick from the market data.
You can see absorption, exhaustion, imbalances and real displacement as they happen, inside the candle and not only after it closes.
■ Five footprint modes (one click)
- Bid x Ask – sellers on the left, buyers on the right, with diagonal imbalances highlighted
- Delta – buyers minus sellers at every price level
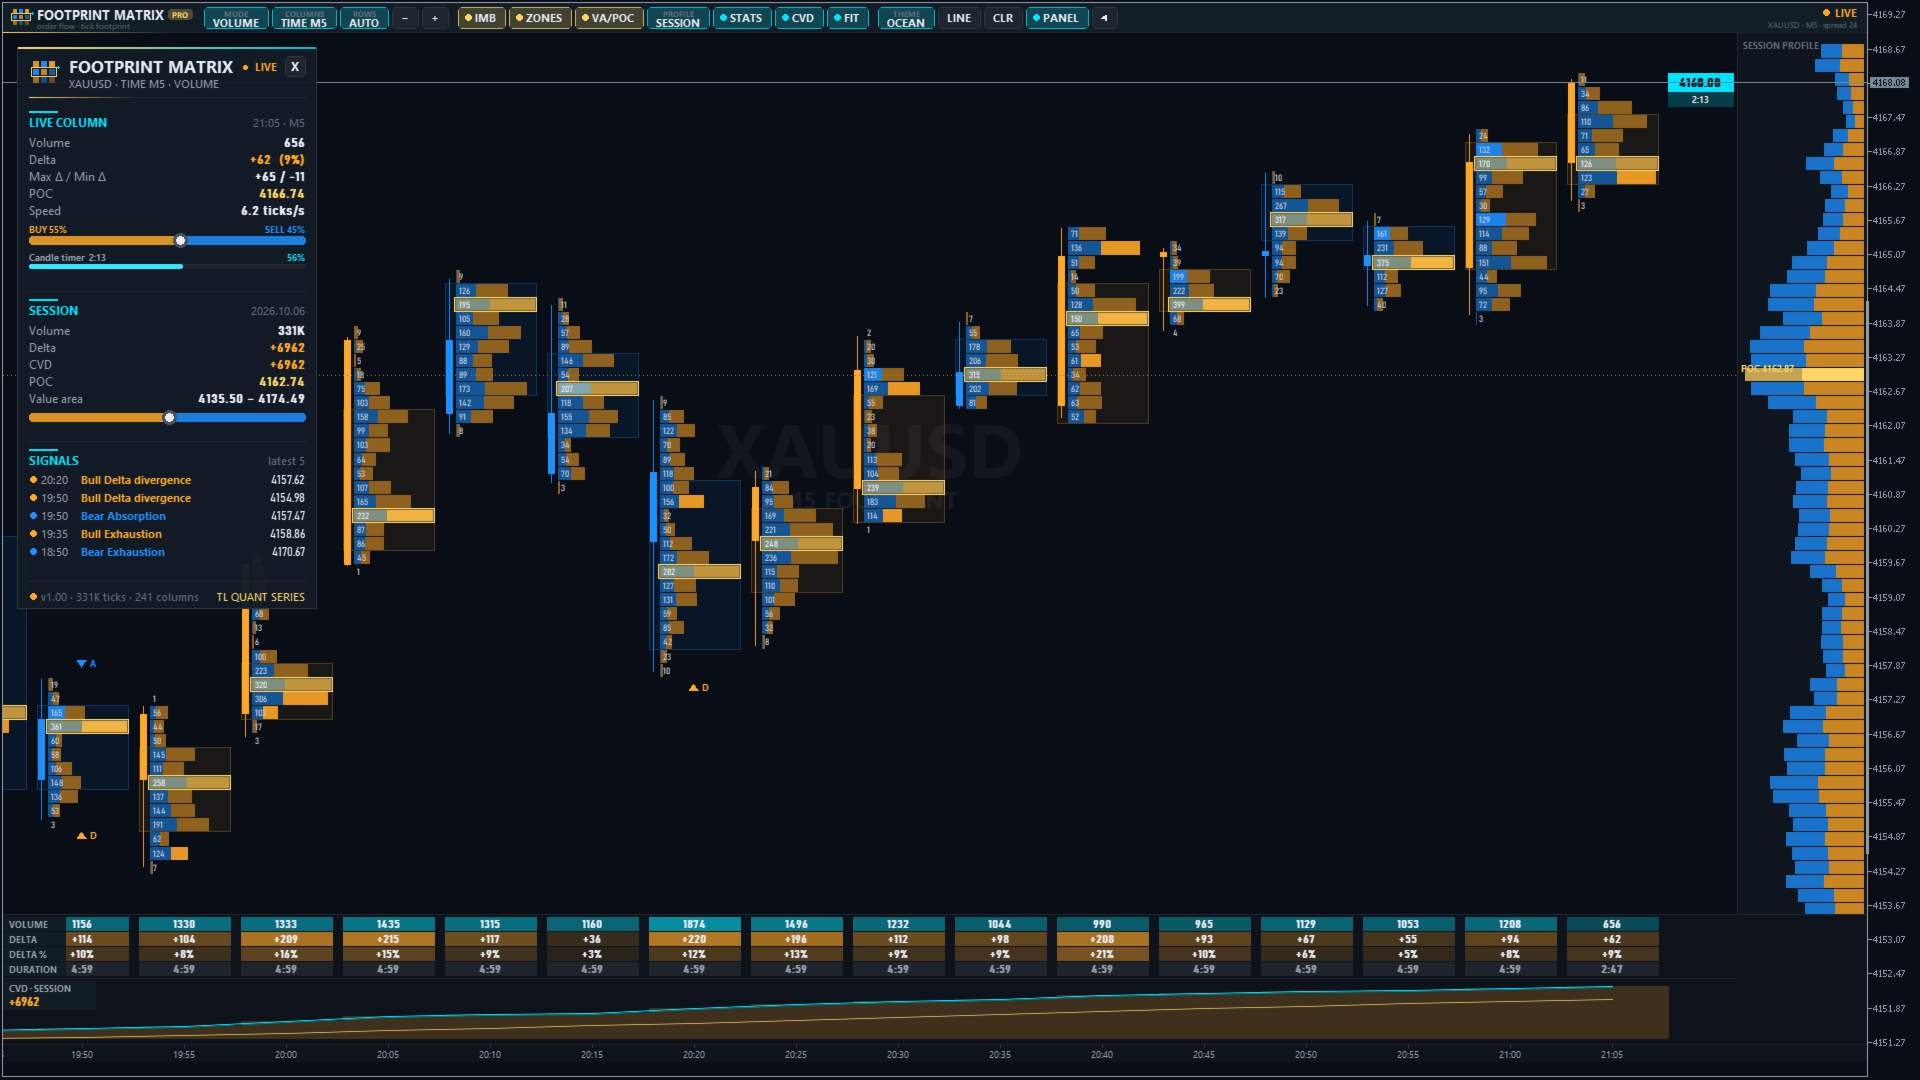
- Volume – total volume per price, split into buy and sell
- Heatmap – volume intensity per price, from cool to hot
- Delta + Volume – both numbers at every price level
■ Three ways to build columns
- Time – one column per chart candle, on any timeframe
- Delta – a new column starts only when the net delta reaches the target. Sideways noise disappears and you see where real pressure moved the price.
- Volume – a new column every N volume
The delta and volume targets are calculated automatically from your tick history. You can also set them yourself.
■ Order-flow toolkit
- Diagonal imbalances with an adjustable ratio (default 300 %)
- Stacked imbalance zones that extend to the right until price trades through them
- Value area (70 %) and point of control for every single column
- Bar statistics table – volume, delta, delta % and duration of every column
- Cumulative volume delta (CVD) pane with a smoothing line. It resets each session, or never.
- Volume profile on the right for the visible columns or the current session, with POC, VAH and VAL
- Open positions at their entry price with live P/L
- Candle countdown next to the live price
■ Signals with alerts
| A | Absorption – heavy aggressive volume at the extreme of a column, but price could not follow through |
| E | Exhaustion – the auction runs out of volume at a new high or low and closes back inside |
| D | Delta divergence – a new high with negative delta, or a new low with positive delta |
| S | Stacked imbalance – three or more imbalances in a row |
| I | Initiative – a burst of volume with strong one-sided delta |
Alerts can be sent as a popup, a sound or a push notification to your phone. Every signal can be switched on or off.
■ Designed for daily use
- Animated toolbar – switch mode, column build, row size, zoom, imbalances, zones, VA/POC, profile, statistics, CVD, auto-fit and theme with one click
- Live dashboard – live column, session totals and the signal log. You can drag it anywhere or close it to a small pill.
- Hover any cell to see its buyers, sellers, delta and imbalance, plus the details of the column
- Auto row size – rows merge automatically so the numbers stay readable at every zoom level
- Six color themes – Quant, Midnight, Ocean, Cyber, Ember and Mono
- Your original chart colors are restored when you remove the indicator
■ For Expert Advisors
Four buffers can be read with iCustom (in Time mode):
0 Delta | 1 Volume | 2 CVD | 3 Signal
Signal values: +1 to +5 bullish, -1 to -5 bearish, in the order Absorption, Exhaustion, Divergence, Stacked imbalance, Initiative.
■ Good to know
- Forex and CFD symbols have no exchange volume. On those symbols every price change is counted as one tick and classified with the tick rule (uptick = buyer, downtick = seller). Exchange symbols such as futures and stocks automatically use real trade volume with buy/sell flags.
- The footprint needs tick history from your broker. The first load takes a few seconds and shows a progress bar. Up to 21 days of ticks are loaded.
- Works on all symbols and timeframes. The best detail is on M1 to M15.
- In the Strategy Tester, use the "Every tick" or "Every tick based on real ticks" model. The "1 minute OHLC" model contains no ticks.
■ Input parameters
Columns
- Build columns by – Time, Delta target or Volume target
- Delta target per column – 0 = automatic
- Volume target per column – 0 = automatic
- History – chart candles to load ticks for (max. 21 days)
- Volume source – Auto, tick count or real volume
Footprint
- Footprint mode – Bid x Ask, Delta, Volume, Heatmap, Delta + Volume
- Row size in points – 0 = automatic, follows the zoom
- Minimum row height – pixels for automatic rows
- Imbalance ratio / minimum volume – when a diagonal imbalance is highlighted
- Stacked imbalance rows – consecutive imbalances needed for a zone
- Value area %, show imbalances, show zones (max. length), show VA + POC
- Column width factor – 0.5 to 2.0
Panels
- Bar statistics, CVD pane and CVD reset (session / never)
- Volume profile (visible / session / off) and width
- Live dashboard, open positions, auto fit, hide native candles, price grid
- Color theme and hover info boxes
Signals and alerts
- Each signal on/off: Absorption, Exhaustion, Delta divergence, Stacked imbalance, Initiative
- Thresholds: absorption share, exhaustion %, initiative volume multiplier and delta share
- Alerts: popup, sound, push notification, sound file
- Redraw interval – milliseconds while live
Footprint Matrix Pro is an analysis tool. It does not place trades.