Volume Profile Anchored

You have been there. The market moves without you, and you are left guessing where the actual volume sits. You want to see the value area, but you are stuck squinting at a static daily profile that resets on a schedule you do not care about.


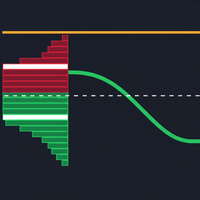
This is a volume profile indicator. It maps out volume distribution between two points in time that you choose, so you can see where the market accepted price and where it rejected it.


The problem with most volume tools is that they force you into fixed sessions. You miss the true swing high or the exact low because the tool resets at midnight. This tool hands you control of the context. Attach the indicator to your chart and press the Add Anchor button at the top. Click a candle to set the start. If you use standard mode, the profile draws from that anchor to the current price. If you select the interactive end point, you can drag a second line to lock the profile to a specific historical range. It keeps up to five of these profiles running simultaneously.


Once anchored, the tool calculates the point of control and the value area boundaries. It draws these as lines across your chart. It also shades a zone around these levels based on recent average true range, giving you a visual buffer rather than a thin line. The histogram bars use an estimated delta calculation based on where the close sits within the candle body. Deep sky blue represents bullish volume. Black represents bearish volume. You can switch this to display total volume, only buy volume, or only sell volume.


This is a manual analysis tool. It does not place trades. It does not provide buy or sell signals. You define the exact zones you want to analyze by clicking on the chart. Because it relies on your manual inputs to map context, it requires you to actively place anchors on your chart to function. It also cannot display more than five profiles at once.


Please note on colors: The default bearish bar color is black. If you trade on a dark chart background, you will need to change this input color (for example, to red or orange) to make the bearish bars visible.


Disclosure. This indicator manages chart objects, not trades. It will not close your positions, nor will it alter your stop losses. It requires you to click the Add Anchor button to function. It writes data to your local terminal global variables to remember your anchor placements across timeframe changes. Removing the indicator from the chart deletes those saved points.


You must test this in the visual Strategy Tester or on a demo account before going live. MQL5 purchases are final once activated. The demo is your only verification step. You will see in the tester screenshots that the tool builds the profile sequentially as new bars form. It does not look into the future, and the POC will shift as the anchored range extends.


Run the demo. Click the Add Anchor button. See if the visual mapping helps your analysis.


Frequently Asked Questions


Does it repaint?

The volume calculation updates as the current candle ticks. If your anchor is set to the current time, the profile will expand and the POC may shift until the candle closes. Historical profiles do not repaint.


Can I use this for order flow trading?

The tool estimates delta by calculating tick volume and candle anatomy. It provides a visual approximation of buying and selling pressure to help you map market structure.


Does it find the best anchor points automatically?

No. You must click the chart to place the start anchor. You can drag the start and end lines to adjust them after placement.


Why are the bearish bars invisible on my chart?

The default bearish color is black. If your chart background is black or a dark color, the bars will blend in. Change the bearish color input to red or orange to see them.

Produits recommandés
Adaptive Volume Profile dessine le Profil de Volume des dernières barres directement sur le graphique : le Point of Control (POC), la Value Area (VAH / VAL), les nœuds de volume élevé (HVN), les nœuds de faible volume (LVN) et un histogramme de volume optionnel. La taille des lignes de prix s'adapte à la volatilité actuelle (ATR), de sorte que le profil reste lisible sur tout symbole et toute unité de temps. Fonctionnalités POC - le niveau de prix avec le plus grand volume échangé dans la fenêtr
FREE
Indicador de Volume
Devscode Desenvolvimento de Softwares LTDA
4.5 (2)
This indicator is a volume indicator it changes the color of the candles according to a certain number of ticks, and this number of ticks can be informed by the user both the number of ticks and the color of the candles, this indicator works in any graphical time or any asset, provided that the asset has a ticker number to be informed. This indicator seeks to facilitate user viewing when analyzing candles with a certain number of ticks.
FREE
Macro-R Pro Signal — Advanced Trading Signal Indicator Macro-R Pro Signal is a professional trading indicator designed to deliver high-quality BUY and SELL signals with enhanced precision and reduced market noise. By combining Bollinger Bands, RSI, and adaptive volatility filtering , this indicator helps traders identify high-probability reversal points while avoiding unfavorable market conditions. How the Strategy Works This indicator is built on a mean reversion + momentum confirmation concep
FREE
IBI Vwap
Brahim Eljaziri
IBI Vwap trace le prix moyen pondéré par le volume (VWAP), calculé sur le vrai volume de la bourse , avec des bandes à ±1 et ±2 écarts-types. Ce que vous voyez VWAP : le prix moyen payé par tous les participants depuis le début de la séance, pondéré par le vrai volume échangé. Les institutions s'en servent comme référence : au-dessus, les acheteurs contrôlent ; en dessous, les vendeurs contrôlent. Bandes ±1 et ±2 écarts-types : elles mesurent jusqu'où le prix s'éloigne de son prix moyen. La band
FREE
Read This : Please provide comments and reviews for future improvements. WaveTrendPro_Indi v1.05 WaveTrend indicator with enhanced histogram visualization : Histogram is now scaled higher (adjustable via  HistScale ). Different colors for positive & negative bars, making trend direction clearer. Lightweight & responsive across pairs and timeframes. Perfect for scalpers, swing traders, and trend-following strategies. WaveTrendPro_Indi v1.05 Indikator WaveTrend dengan tampilan histogram yang le
FREE
Blahtech VWAP MT5
Blahtech Limited
5 (1)
Blahtech VWAP - Volume Weighted Average Price (VWAP) is the ratio of price to total volume. It provides an average price over a specified time interval.  Links [  Install  |  Update  |  Documentation   ] Feature Highlights Configurable VWAP Line Sessions, intervals, anchored or continuous Previous day settlement line Standard Deviation bands Alerts at bar close or real time Automatic Broker or Tick volumes Significantly reduced CPU usage Input Parameters Expert Advisor Mode  - Reserved for iCu
FREE
Basic Vwap
james mugendi
4 (1)
Simple Vwap with the daily, weekly and monthly VWAP is the abbreviation for   volume-weighted average price , which is a technical analysis tool that shows the ratio of an asset's price to its total trade volume. It provides traders and investors with a measure of the average price at which a stock is traded over a given period of time. How it's used Identify entry and exit points:   Traders can use VWAP to determine when to buy or sell an asset.   Understand price trends :  Traders can use V
FREE
PRODUCT TITLE: Mindgame  SHORT DESCRIPTION (Max 150 chars): All-in-One professional indicator: 5 SMAs, Non-Repainting MACD Crossover Arrows, NY Session Shading, and Live HUD Dashboard for MT5. CATEGORY: Market > MetaTrader 5 > Indicators > Trend / Oscillators PRICE RECOMMENDATION: $39 - $59 (or Free with premium upgrade / rental options) ================================================================================ FULL PRODUCT DESCRIPTION (Copy-paste directly into MQL5 Market description
FREE
Description Générale L’Indicateur Fair Gap Value identifie et met en évidence les « fair value gaps » sur le graphique de MetaTrader 5. Un fair gap se forme lorsqu’un vide de prix apparaît entre le plus bas d’une bougie et le plus haut d’une bougie située deux périodes plus tôt. L’indicateur dessine des rectangles colorés (haussiers et baissiers) pour souligner ces zones et offrir un support visuel aux stratégies basées sur les mouvements de prix. Fonctionnalités Clés Détection de gap haussier :
FREE
Value Chart Candlesticks
Flavio Javier Jarabeck
4.57 (14)
The idea of a Value Chart indicator was presented in the very good book I read back in 2020 , " Dynamic Trading Indicators: Winning with Value Charts and Price Action Profile ", from the authors Mark Helweg and David Stendahl. The idea is simple and the result is pure genius: Present candlestick Price analysis in a detrended way! HOW TO READ THIS INDICATOR Look for Overbought and Oversold levels. Of course, you will need to test the settings a lot to find the "correct" one for your approach. It
FREE
Market Time
Kaan Caliskan
3 (1)
MarketTime - Horloge Multi-Fuseaux Horaires et Indicateur de Sessions Professionnel Ne Manquez Plus Jamais une Session de Trading - Surveillez les Heures du Marché Mondial en Temps Réel MarketTime est un indicateur de niveau professionnel qui affiche plusieurs fuseaux horaires, des comptes à rebours de sessions en direct et des zones de sessions de trading visuelles directement sur vos graphiques MetaTrader 5. Dans le trading forex, le timing est primordial - savoir quand les principaux centres
FREE
Session and Anchored VWAP plots the volume-weighted average price (VWAP), the average price paid in a period weighted by volume. Two versions are included: one that resets every day, week or month, and one anchored at a moment you choose. How it works - Periodic VWAP: starts fresh at the beginning of each day (broker server time), each week (Monday) or each month, and accumulates price × volume from there. - Up to two bands at a chosen number of standard deviations show how far price has moved
FREE
VWAP Indicator
LUC JACOBUS A VERHEECKE
4.11 (27)
Volume Weighted Average Price (VWAP) The volume weighted average price (VWAP) is a  trading   benchmark  used by traders that gives the average price a security has traded at throughout the day, based on both volume and price. It is important because it provides traders with insight into both the trend and value of a security. This indicator VWAP V2 is free and is the manual version of the extended Easy VWAP indicator (30 Euro), where the date and time properties are automatically entered. With
FREE
PositionMap Pro — Account Overview Panel for MT5 A real-time panel that groups all open positions by symbol and shows Buy lots, Sell lots and net profit/loss directly on your chart — the whole account at a glance. Instead of counting lots symbol by symbol in the Terminal tab, PositionMap Pro groups everything automatically. You instantly see how much exposure you have on each symbol, split by direction. Panel example Symbol Buy Lot Sell Lot Net P/L EURUSD 0.50 — +12.30 XAUUSD — 1.00 −45.00 GBPUS
FREE
Professional Gold Trading Levels Indicator Features: - Daily & Weekly Pivot Points - Fibonacci Retracement Levels   - Round Number Levels - Customizable Colors & Fonts - Auto-Update Daily - Clean & Simple Interface Perfect for Gold (XAUUSD) traders Reliable Support/Resistance levels Lightweight & Fast Performance Easy to install and use Compatible with all MT5 accounts. No complex settings required! SimpleGoldLevels v1.0 - User Manual Professional Support & Resistance Levels
FREE
Trading panel for manual trading. Has a fairly wide functionality. Allows you to automatically calculate the order size, open both market and pending orders. It has a wide range of options for closing orders, it is possible to partially close orders, close orders after reaching a certain profit or loss, separately close profitable and unprofitable, buy and sell, as well as pending orders. The panel also contains a simple implementation of a grid of pending orders, reverse and lock functions, tr
FREE
The "Volume Range Profile with Fair Value" (VRPFV) indicator is a powerful volume analysis tool designed to help traders better understand market structure and identify key price areas where significant institutional activity occurs. Instead of just looking at volume on individual candlesticks, VRPFV analyzes the distribution of volume by price level within a specific time range, providing deep insights into the "footprint" of smart money. VRPFV consists of the following core components: Upper &
FREE
Risk Manager Lot Calculator vous indique la taille de lot exacte a trader pour qu'un trade perdant ne coute que le montant que vous decidez, pas davantage. Vous definissez votre risque en pourcentage du compte ou en montant fixe, et vous definissez votre stop loss en pips, en prix, ou en glissant une ligne sur le graphique. Le panneau affiche alors la taille de position correcte, l'argent risque, la valeur du pip et, quand vous ajoutez un take profit, le rapport gain sur risque et le profit pote
FREE
Sweep Liquidity
Nawal Kishor Yadav
5 (1)
Liquidity Sweep Pro v3.2 — Détection de Liquidité Smart Money Indicateur professionnel conçu pour détecter les balayages de liquidité institutionnels en temps réel. Identifie les balayages de Buy-Side Liquidity (BSL) et Sell-Side Liquidity (SSL) avec une classification automatique en Strong et Weak. Fonctionnalités Principales : • Détection en temps réel des balayages BSL et SSL • Classification Strong vs Weak basée sur le ratio de mèche, la clôture du corps et le volume • Filtres de qualité int
FREE
Volume By Color RSJ colore la barre de volume d'une teinte plus foncée lorsque le volume échangé est supérieur à sa propre moyenne mobile, ce qui fait ressortir les bougies à l'activité inhabituelle. Un mode optionnel à quatre couleurs indique par paliers la force du volume de chaque bougie. Par défaut, l'indicateur compare chaque barre à la moyenne simple du volume sur 20 périodes. Le type et la période de la moyenne peuvent être modifiés dans les paramètres d'entrée. Utilisation Les barres col
FREE
The indicator highlights the points that a professional trader sees in ordinary indicators. VisualVol visually displays different volatility indicators on a single scale and a common align. Highlights the excess of volume indicators in color. At the same time, Tick and Real Volume, Actual range, ATR, candle size and return (open-close difference) can be displayed. Thanks to VisualVol, you will see the market periods and the right time for different trading operations. This version is intended f
FREE
TradeVision Pro
Ian Nganga Comba
TradeVisonPro Forex Analyzer Pro Tableau de bord d’analyse et de suivi des comptes de trading MT5 TradeVisonPro Forex Analyzer Pro est une solution d’analyse du trading et de suivi des comptes conçue pour les utilisateurs de MetaTrader 5. Le produit organise les données de trading MT5 dans un tableau de bord web structuré, permettant aux traders de consulter les informations du compte, de surveiller les positions ouvertes, d’analyser l’historique des transactions, de suivre les stratégies, de te
FREE
PZ Penta O MT5
PZ TRADING SLU
3.8 (5)
The Penta-O is a 6-point retracement harmonacci pattern which usually precedes big market movements. Penta-O patterns can expand and repaint quite a bit. To make things easier this indicator implements a twist: it waits for a donchian breakout in the right direction before signaling the trade. The end result is an otherwise repainting indicator with a very reliable trading signal. The donchian breakout period is entered as an input. [ Installation Guide | Update Guide | Troubleshooting | FAQ | A
FREE
Spike Catch Pro
Amani Fungo
4.14 (7)
Spike Catch Pro 22:03 release updates Advanced engine for searching trade entries in all Boom and Crash pairs (300,500 and 1000) Programmed strategies improvements Mx_Spikes (to combine Mxd,Mxc and Mxe), Tx_Spikes,   RegularSpikes,   Litho_System,   Dx_System,   Md_System,   MaCross,   Omx_Entry(OP),  Atx1_Spikes(OP),   Oxc_Retracement (AT),M_PullBack(AT) we have added an arrow on strategy identification, this will help also in the visual manual backtesting of the included strategies and see ho
FREE
Daily VWAP
Riccardo Moreo
4.8 (5)
This is the Volume Avarage Weighted Price (VWAP) it's a indicator that shows where is the avarage of the current volumes and the levels at which the price is considered premium, above the second upper band, or discount, under the second lower band, it's also very usefull to use the VWAP level as a target for operations since it's a very liquid level so the price it's attracted to it. feel free to leave a feedback either positive or negative based on your expereince with this indicator, enjoy the
FREE
Friend of the Trend: Your Trend Tracker Master the market with Friend of the Trend , the indicator that simplifies trend analysis and helps you identify the best moments to buy, sell, or wait. With an intuitive and visually striking design, Friend of the Trend analyzes price movements and delivers signals through a colorful histogram: Green Bars : Signal an uptrend, indicating buying opportunities. Red Bars : Alert to a downtrend, suggesting potential selling points. Orange Bars : Represent cons
FREE
How it works –   Base-departure detection — algorithmically finds consolidation bases (overlapping range with compressed volatility) followed by displacement departures. Patterns: Drop-Base-Rally, Rally-Base-Drop, Rally-Base-Rally, Drop-Base-Drop — detected structurally, not by candle names. –   Strength score (0–100) — from departure velocity, time-at-base, freshness (each revisit decays the score), higher-timeframe confluence and origin volume. –   Lifecycle — Fresh, Tested (decaying), Broken
FREE
GOM Trade Manager
Wannapach Chinnaprapa
GOM Trade Manager helps you execute trades the way you want it. Works on all instruments Forex, Commodities, & Crypto. It helps you with lot calculations, spread addition and balance calculations so you can just focus on actual trading. For full automatic planned management, stackable triggers and spread widening protection >> check out GOM Trade Manager Pro . ------------------------------------------NOTABLE FEATURES------------------------------------------ You set everything based on bid
FREE
Pump Liquidity Refueling
Konstantin Meshcheriakov
PUMP V3_0 Liquidity Refueling — Refueling Your BalanceWhat is "Liquidity Refueling"? Think of the Forex market as a highway and liquidity as the fuel.  When institutional players "pour" massive volume into the market, the price makes a sharp surge — an impulse or a "pump."  The PUMP V3_0 EA acts as a smart fueling station: it identifies moments of maximum market energy and "pumps" that momentum directly into your trading account.   Performance Metrics (Strategy Tester Data):Net Profit "Pumped"
FREE
Are you tired of drawing trendlines every time you're analyzing charts? Or perhaps you would like more consistency in your technical analysis. Then this is for you. This indicator will draw trend lines automatically when dropped on a chart. How it works Works similar to standard deviation channel found on mt4 and mt5. It has 2 parameters: 1. Starting Bar 2. Number of bars for calculation The   starting bar   is the bar which drawing of the trend lines will begin, while the   number of bars for c
FREE
Les acheteurs de ce produit ont également acheté
Trend Sniper X
Sarvarbek Abduvoxobov
4.86 (43)
Trend Sniper X est un indicateur de suivi de tendance multi-unités de temps pour MetaTrader 5 qui aide les traders à identifier la direction de la tendance et les points d'inversion potentiels avec clarté et précision. pour MT4: https://www.mql5.com/en/market/product/193245 Informations sur le prix : Le prix actuel est un prix promotionnel et est susceptible de changer lors des prochaines mises à jour et nouvelles fonctionnalités. Offre bonus : Pour obtenir GRATUITEMENT l'Auto-Trade Assistant E
Smart Trend Trading System — MetaTrader 5 Après votre achat, envoyez-moi un message sur MQL5 pour recevoir GRATUITEMENT Smart Universal Expert Advisor, ainsi que le cours en ligne, le manuel PDF et l’accès au groupe privé. STTS réunit la direction de la tendance, les signaux d’entrée et de sortie, les zones de retournement et les niveaux de prix importants directement sur votre graphique. Suivez le système manuellement ou connectez un EA compatible distinct pour une exécution automatique selon l
Un nouveau Roi en ville - Indicateur + Gestion des ordres (TP1 + TP2 + TP3) + Envoi optionnel de signaux Telegram INCLUS (GRATUIT) (SYSTÈME COMPLET DE TRADING et DE SIGNAUX) Notre meilleur EA pour l’Or : Gold Slayer Cet indicateur inclut une stratégie avancée, un système de trading avec gestion des ordres personnalisable ainsi qu’un système de retour à la moyenne combinant des extensions d’enveloppes, soutenu par plusieurs filtres intelligents de confirmation comme le RSI afin de détecter des en
Zoryk Gold
Reda El Koutbane
4.78 (18)
ZORYK — Système avancé de signaux XAUUSD pour MetaTrader 5 Vous connaissez certainement cette sensation. Vous passez du temps à analyser l’or. Vous attendez le bon point d’entrée. Vous ouvrez enfin la position, puis le prix commence immédiatement à évoluer contre vous. Vous fermez trop tôt, déplacez le Stop Loss ou hésitez pendant quelques secondes. Ensuite, le marché atteint exactement l’objectif que vous aviez initialement prévu, mais sans vous dans la position. Le problème n’était pas toujour
Gardez votre avantage de trading dans votre ligne de mire ! M5 Sniper est un nouvel indicateur de MeanFX. Il combine des signaux de trading précis avec des niveaux de TP/SL adaptatifs — créant ainsi les meilleures opportunités de trading statistiques possibles ! Le prix augmente tous les 5 achats, le prochain prix est de 69$ Envoyez-moi un message après l’achat pour recevoir des conseils/un guide et un EA bonus Qu’est-ce qui le distingue ? Performance statistique éprouvée sur Gold XAUUSD ( fonct
SuperScalp Pro
Van Minh Nguyen
4.54 (37)
SuperScalp Pro - Professional Multi-Layer Confluence Scalping System SuperScalp Pro est un indicateur de scalping avancé qui améliore le Supertrend classique grâce à plusieurs filtres intelligents de confirmation. Il vous aide à identifier des opportunités de trading Buy/Sell présentant une probabilité de réussite plus élevée, tout en réduisant considérablement les faux signaux. Des flèches Buy et Sell bien visibles apparaissent directement sur le graphique, avec des niveaux de Stop Loss et de T
En 2019, j'ai montré au monde entier ce dont cet indicateur est capable. J'ai tradé ses signaux manuellement, sur un compte réel, en toute transparence — le compte était suivi sur Myfxbook, et je relatais cette expérience en détail sur Facebook. Résultat : en quatre mois, 10 000 dollars sont devenus 941 411. Le risque était délibérément extrême — le drawdown allait jusqu'à 54 %, car dans notre métier, le profit et le risque vont toujours de pair. La capture d'écran de Myfxbook est la première im
ULTRA est un indicateur technique « tout-en-un » : il analyse le marché de manière autonome, génère des signaux de trading, affiche les niveaux permettant de définir des ordres stop-loss et suggère le moment opportun pour clôturer les positions afin de sécuriser les bénéfices ou de minimiser les pertes. En d'autres termes, peu importe que vous ne sachiez pas analyser le marché, déterminer les niveaux (où placer votre stop-loss) ou que vous ayez du mal à gérer votre capital. ULTRA s'occupera de t
SMC Intraday Formula
VividMind Digital Solutions
5 (26)
Commençons par être honnêtes. Aucun indicateur ne vous rendra rentable à lui seul. Si quelqu’un vous dit le contraire, il vous vend un rêve. Tout indicateur qui affiche des flèches parfaites d’achat/vente peut être rendu impeccable — il suffit de zoomer sur la bonne partie de l’historique et de capturer uniquement les trades gagnants. Nous ne faisons pas cela.  SMC Intraday Formula est un outil. Il lit la structure du marché pour vous, identifie les zones de prix à la probabilité la plus élevée
GoldenX Entry MT5
VividMind Digital Solutions
5 (17)
GoldenX Entry est un indicateur MT5 doté d’un algorithme adaptatif Smart Entry Trend, d’un système de scoring des signaux, d’un détecteur de régime de marché et d’un filtre de volatilité. Chaque signal inclut un niveau d’entrée calculé, trois niveaux de Take-Profit (TP1, TP2, TP3) ainsi qu’un niveau de Stop-Loss. Il est construit sur plusieurs couches analytiques conçues pour s’adapter à différentes conditions de marché, combinant un système analytique multicouche avec un optimiseur intégré et u
M1 Sniper MT5
Oleg Rodin
5 (7)
M1 SNIPER   est un système d'indicateurs de trading facile à utiliser. Il s'agit d'un indicateur à flèche conçu pour l'unité de temps M1. Cet indicateur peut être utilisé seul pour le scalping sur l'unité de temps M1 ou intégré à votre système de trading existant. Bien que conçu spécifiquement pour le trading sur l'unité de temps M1, ce système peut également être utilisé avec d'autres unités de temps. Initialement, j'avais conçu cette méthode pour le trading du XAUUSD et du BTCUSD. Cependant, j
Gann Made Easy   est un système de trading Forex professionnel et facile à utiliser qui est basé sur les meilleurs principes de trading en utilisant la théorie de mr. WD Gann. L'indicateur fournit des signaux d'ACHAT et de VENTE précis, y compris les niveaux Stop Loss et Take Profit. Vous pouvez échanger même en déplacement en utilisant les notifications PUSH. VEUILLEZ ME CONTACTER APRÈS L'ACHAT POUR RECEVOIR GRATUITEMENT DES INSTRUCTIONS DE TRADING ET D'EXCELLENTS INDICATEURS SUPPLÉMENTAIRES! V
Auto Optimized SpeedAngle est un système de vectorisation du momentum de niveau institutionnel qui élimine l'ajustement de courbe ( curve-fitting ) grâce à une optimisation continue par avancement ( Walk-Forward Optimization , WFO). Plutôt que de s'appuyer sur des entrées statiques qui se dégradent lorsque les régimes de marché changent, l'indicateur recalibre dynamiquement ses paramètres en utilisant une validation hors échantillon ( Out-of-Sample , OOS), garantissant ainsi que les signaux affi
Gold Entry Sniper
Tahir Mehmood
5 (21)
Gold Entry Sniper – Tableau de Bord ATR Multi-Unités de Temps pour Scalping et Swing Trading sur l'Or Gold Entry Sniper est un indicateur avancé pour MetaTrader 5 qui fournit des signaux d'achat/vente précis sur XAUUSD et autres actifs, basé sur la logique de Trailing Stop ATR et l' analyse multi-unités de temps . Caractéristiques et Avantages Clés Analyse Multi-Unités de Temps – Affiche les tendances en M1, M5, M15 sur un seul tableau. Trailing Stop Basé sur l'ATR – Ajuste automatiquement selon
Boba Analysis Suite
Trade Ready Solutions LLC
5 (2)
Boba Analysis Suite Boba Analysis Suite est un indicateur d’analyse pour MetaTrader 5. Il réunit la structure du marché, les zones de prix pertinentes et le contexte général du marché dans une même vue graphique. Développé à partir de l’expérience pratique d’un trader et formateur en trading, il accompagne une démarche d’analyse structurée : évaluer la direction du marché, identifier les niveaux importants et analyser plusieurs unités de temps conjointement. Une analyse en contexte La significat
Indicateur de force et de momentum multi-devises MT5 Dynamic Forex28 Navigator est l'évolution de nos indicateurs populaires de longue date et réunit la puissance de trois outils en un : Advanced Currency Strength28 Indicator (700 avis) Advanced Currency IMPULSE with ALERT (530 avis) CS28 Combo Signals (bonus actuel) Les deux indicateurs précédents totalisent plus de 1 200 avis sur le MQL5 Market et font partie des outils incontournables de la communauté MT4 depuis 2016. Dynamic Forex28 Navigato
Prochaine mise à jour — Version 2.52 bientôt disponible ! [NOUVEAU] Préparez-vous à découvrir 4 nouvelles fonctionnalités majeures conçues pour améliorer votre analyse du marché et votre flux de travail de trading Nous faisons passer l’analyse du marché au niveau supérieur avec 4 nouvelles fonctionnalités conçues pour répondre à vos besoins en trading. Découvrez : 1. TRADE OVERVIEW DASHBOARD 2. CONFLUENCE AT ZONE 3. STRONG & WEAK HIGH/LOW 4. OTE 1. TRADE OVERVIEW DASHBOARD Un tableau de bord qu
Gold Trend Coach MT5
Cristhian Alexander Gaibor Cuasquer
5 (3)
Gold Trend Coach est un indicateur de tendance pour l'or (XAUUSD) sur MetaTrader 5 avec des signaux d'achat et de vente, un stop loss et trois objectifs de take profit, confirmés à la clôture de la bougie, un tableau de bord coach multi-unités de temps et des alertes sur votre téléphone et sur Telegram. Conçu pour le scalping en M5 et l'intraday en M15 pendant les sessions de Londres et de New York. Gold Trend Coach : signaux de tendance sur l'or XAUUSD avec entrée, stop et trois objectifs. Prix
Atomic Analyst MT5
Issam Kassas
4.5 (64)
Atomic Analyst — MetaTrader 5 Après votre achat, envoyez-moi un message sur MQL5 pour recevoir GRATUITEMENT Smart Universal Expert Advisor, ainsi que le cours en ligne, le manuel PDF et l’accès au groupe privé. Atomic Analyst réunit l’action des prix, la direction de la tendance, les signaux d’entrée et de sortie, le Stop Loss et plusieurs niveaux de Take Profit directement sur votre graphique. REPÉREZ LE SIGNAL. COMPRENEZ LA CONFIGURATION. Atomic Analyst présente son analyse sous forme d’inform
FiboSniper Pro
Van Minh Nguyen
5 (4)
FiboSniper Pro – Multi-Filter Fibonacci System with Auto SL/TP and Control Panel FiboSniper Pro est un indicateur technique qui combine des Fibonacci Envelopes dynamiques avec plusieurs filtres de confirmation afin de générer des signaux Buy et Sell sélectionnés. Les niveaux de Fibonacci sont calculés à partir de Moving Average et ATR, puis filtrés par ADX, EMA, RSI, ATR, Volume, Time et la structure des bougies. L’indicateur affiche directement sur le graphique les niveaux automatiques de Stop
Zain Gold Scalping
Ahmed Gamal Abdel Nasser Mohamed
A complete price-action analysis tool built around dual independent entry logic, each confirmed against a volatility band, combined with a configurable set of nine optional confirmation filters that let you shape exactly how conservative or aggressive the tool's signals behave. Core Strategy Two independent entry setups, each triggering only when price moves outside a dynamic volatility band — giving two distinct ways to spot potential reversal points, which can be used together or separately.
Tokyo mt5 Indicator
Vasiliy Strukov
5 (13)
Le Tokyo Indicator offre une vue d'ensemble visuelle et claire de l'orientation de la tendance, des signaux de trading potentiels et des conditions du marché. Sa ligne de tendance en escalier, codée par couleur, distingue les phases haussières (en bleu) des phases baissières (en magenta). Des flèches directionnelles associées mettent en évidence les opportunités d'achat et de vente potentielles lors des changements de tendance. Un tableau de bord intégré regroupe le signal actuel, l'orientation
Power Candles MT5
Daniel Stein
4.58 (12)
Power Candles V3 - Indicateur de force à optimisation automatique Power Candles V3 transforme la force des devises et des instruments en un plan de trading exploitable sur chaque graphique auquel il est associé. Au lieu de se contenter de colorer les bougies, il effectue une optimisation automatique en temps réel en arrière-plan et vous fournit les meilleurs niveaux de Stop Loss, Take Profit et seuils de signal pour le symbole que vous avez sous les yeux. Un simple clic suffit pour l'adopter en
Quantum TrendPulse
Bogdan Ion Puscasu
5 (26)
Présentation de   Quantum TrendPulse   , l'outil de trading ultime qui combine la puissance de   SuperTrend   ,   RSI   et   Stochastic   dans un seul indicateur complet pour maximiser votre potentiel de trading. Conçu pour les traders qui recherchent précision et efficacité, cet indicateur vous aide à identifier les tendances du marché, les changements de dynamique et les points d'entrée et de sortie optimaux en toute confiance. Caractéristiques principales : Intégration SuperTrend :   suivez f
Adaptive Price Action Engine Achetez un indicateur, obtenez l'EA gratuitement Analyse auto-optimisée des tendances et des figures de chandeliers Multi-Timeframe Les marchés évoluent constamment, et tous les modèles de Price Action n’ont pas la même valeur dans toutes les conditions de marché. Adaptive Price Action Engine a été conçu pour s’adapter aux changements du marché en combinant structure de tendance, analyse Multi-Timeframe, figures de chandeliers et optimisation statistique au sein d’un
Trend Catcher ind mt5
Ramil Minniakhmetov
5 (18)
INDICATEUR DE DÉTECTEUR DE TENDANCE L'indicateur de détecteur de tendance analyse les mouvements de prix du marché grâce à une combinaison d'indicateurs d'analyse de tendance adaptatifs, propriétaires et personnalisés. Il identifie la véritable direction du marché en filtrant les fluctuations à court terme et en se concentrant sur la force de la dynamique sous-jacente, l'expansion de la volatilité et la structure des prix. Il utilise également une combinaison d'indicateurs personnalisés de lis
Superhero
Ihor Otkydach
5 (3)
L'indicateur SUPERHERO est un système de trading multidevises conçu selon un principe « tout compris ». Cet indicateur analyse le marché de manière autonome et fournit des signaux indiquant quand ouvrir et clôturer des positions. Il utilise des ordres Stop Loss et Take Profit. Le rapport R:R est de 1:1. Ce système peut envoyer des notifications push sur votre smartphone, ce qui vous permet de passer des ordres « où que vous soyez », sans avoir à rester devant un ordinateur. C'est la solution idé
Neuro Poseidon MT5
Daria Rezueva
4.75 (52)
Neuro Poseidon is a new indicator by Daria Rezueva. It combines precise trading signals with adaptive TP/SL levels - creating best possible trades as a result! Message me and get  Neuro Poseidon Assistant  as a gift to automize your trading process! What makes it stand out? 1. Proven profitability on all assets and timeframes 2. Only confirmed BUY and SELL signals present on the chart 3. Adaptive TP & SL levels generated by the software for each trade 4. Easy to understand - suitable for al
Azimuth Pro
Ottaviano De Cicco
5 (7)
Azimuth Pro V2: Synthetic Fractal Structure and Confirmed Entries for MT5 Overview Azimuth Pro is a multi-level swing structure indicator by Merkava Labs . Four nested swing layers, swing-anchored VWAP, ABC pattern detection, three-timeframe structural filtering, and closed-bar confirmed entries — one chart, one workflow from micro-swings to macro-cycles. This is not a blind signal product. It is a structure-first workflow for traders who care about location, context, and timing. Halloween P
Break and Retest Hunter is a powerful MetaTrader 5 indicator designed to automatically identify support and resistance levels, breakout structures, and potential retest opportunities in real time. Bonus Indicator: After purchasing Break and Retest Hunter , contact me to receive Trade Indicator Assistant EA completely free as a bonus utility. $65 for the next 10 copies . Next price is $120.  Combining adaptive market analysis, clear BUY/SELL signals, Fibonacci-based profit targets, and a premiu
Plus de l'auteur
CVD Range Divergencee
Jackson Mukurani Wanguthi
5 (1)
CVD Range Divergence   is a powerful volume-based technical indicator designed for MetaTrader 5 (MQL5). It calculates the Cumulative Volume Delta (CVD) by analyzing the difference between buying and selling pressure per candle, utilizing either Tick Volume or Real Volume. Multi-Period Swing Scanning : Automatically scans a user-defined range of swing periods (e.g., 9 to 13) to detect regular and hidden divergences between price peaks/troughs and CVD peaks/troughs. Weighted Delta Support : Includ
FREE
ATR Trade Zone
Jackson Mukurani Wanguthi
Overview ATR Trade Zone is a technical indicator for MetaTrader 5. It projects entry, stop loss and take profit levels onto the chart using the Average True Range (ATR) of the current symbol and timeframe. The levels are drawn as filled zones and horizontal price lines starting from a bar selected by the user. The indicator is an analysis tool. It does not open trades and does not provide buy or sell signals. Displayed elements The indicator draws the following elements on the main chart wi
FREE
Smooth RSI Vector
Jackson Mukurani Wanguthi
Overview Smooth RSI Vector is a technical indicator for MetaTrader 5. It calculates a normalized momentum oscillator by processing price data and displaying the result as a color-coded line in a separate window, accompanied by a text dashboard on the main chart. The indicator is an analysis tool. It does not open trades and does not provide buy or sell signals. Displayed elements The indicator provides the following elements: A sub-window oscillator line that transitions between four specific c
FREE
ACE Signals
Jackson Mukurani Wanguthi
ACE Signals Adaptive Confluence Engine — Precision Entry Signals Through Multi-Layer Validation Tired of repainting arrow indicators that fire late, whipsaw in chop, and leave you holding the bag? Most signal indicators rely on a single condition — a moving average cross, an RSI spike, or a price pattern. In volatile markets, that is not enough. ACE Signals was engineered from the ground up to eliminate false entries by requiring three independent layers of market intelligence to align before a
FREE
UniversalLevelAlert
Jackson Mukurani Wanguthi
4 (1)
UniversalLevelAlert is a free, lightweight MT5 chart indicator that combines price-level alerts with multi-timeframe candle-close alerts — all in one tool. What it does: Price Alerts: Set up to 5 horizontal alert lines directly on the chart. Drag them visually to adjust levels. Get notified when price comes within a trigger distance. Candle-Close Alerts: Monitor up to 5 timeframes simultaneously. Get alerted the moment a candle closes on any chosen timeframe, with bullish/bearish classification
FREE
Market Pulse Dashboard
Jackson Mukurani Wanguthi
A clean, information-dense dashboard that sits on your chart and answers the five questions every trader should ask before pulling the trigger: 1) What am I looking at? — Symbol, timeframe, live spread in points and pips. 2) When am I trading? — Active forex session with overlap detection, candle countdown timer, broker server time (auto-detected UTC offset, DST-proof), and your local time. 3) How much should this move? — 5 configurable ATR multiplier rows for quick SL/TP sizing, plus Daily,
FREE
VWAP Anchor Tool
Jackson Mukurani Wanguthi
Anchored VWAP is a lightweight, interactive volume-weighted average price indicator designed for traders who need precision without clutter. Unlike standard VWAP that resets every session, this tool lets you drop up to five custom anchors directly on any candle. Each anchor calculates VWAP from that exact point forward, complete with standard deviation bands to highlight where price may find support or resistance relative to volume. Key Features: • Up to 5 simultaneous anchors — compare multi
FREE
Adaptive Alpha EMA
Jackson Mukurani Wanguthi
Adaptive Alpha EMA is a next-generation trend indicator that revolutionizes the classic EMA crossover by introducing real-time volatility responsiveness. Unlike traditional EMAs that rely on static periods, Adaptive Alpha EMA measures volatility speed through ATR (Average True Range) and automatically scales the alpha (smoothing factor) of both fast and slow EMAs. The result is an indicator that tightens during low-volatility consolidation and expands during explosive trend moves — delivering e
FREE
Overview Asian Session Anchor Profile is a technical indicator for MetaTrader 5. It calculates reference levels from the Asian trading session and displays them on the chart. The levels remain visible during the following sessions and are updated as new data arrives. The indicator is an analysis tool. It does not open trades and does not provide buy or sell signals. Displayed elements The indicator draws the following elements on the chart: 1. Asian session range, shown as a rectangle betw
FREE
Cyclic Trend
Jackson Mukurani Wanguthi
Cyclic Trend is a MetaTrader 5 indicator that presents a confirmed market bias and an adaptive price zone. It processes price data through a proprietary cycle-detection framework and outputs two visual elements: a trend label (BULLISH, BEARISH, or NEUTRAL) and a dynamic channel that appears on the relevant side of price (lower band during bullish phases, upper band during bearish phases). Visual Output A text label in a user‑selectable corner, with customisable font, size, colour, and offset. A
FREE
Time Period Labels
Jackson Mukurani Wanguthi
4 (1)
TimePeriodLabels – See where new periods start on any chart A clean indicator that draws vertical lines and labels when a new year, month, week or day begins. No more squinting at dates or placing manual lines every time you open a chart. Each period type has its own colour and style so you instantly know what changed. What it does Detects when the day, week, month or year flips on the current timeframe. Draws a vertical line at the first bar of the new period. Adds a text label (for day, month
FREE
SmartFlow Consensus
Jackson Mukurani Wanguthi
SmartFlow Consensus is a chart overlay indicator designed for traders who need a clean, structural view of price action without clutter. It filters market noise through an internal consensus engine and renders the result directly onto the chart as intuitive color-coded candles, price zones, and trend structure lines. Built for traders who make decisions from structure rather than guesswork, it combines fractal-based zone detection, multi-layer consensus filtering, and market structure tracking
SmartFlow Kalman Consensus
Jackson Mukurani Wanguthi
SmartFlow Kalman Consensus SmartFlow Kalman Consensus is an advanced market structure and trend analysis tool designed to deliver a clean, noise-free view of price behavior. Built for traders who focus on structure, flow, and precision, it simplifies complex market movement into clear, actionable insight. What It Does Filters out market noise to reveal true directional bias Identifies key reaction zones where price is likely to respond Tracks real-time trend shifts with high clarity Aligns stru
Institutional Zones Pro
Jackson Mukurani Wanguthi
Manually drawing support and resistance levels takes time, and no two traders mark the same spots. Institutional Zones Pro solves this by automatically calculating and displaying key levels as zones on your chart. Instead of thin lines, it draws areas where price has historically reacted. Active zones remain visible and extend forward. When price moves through a zone, it updates to show the level is no longer active. This keeps your chart clean and tells you at a glance which areas still matter
Risk Management Suite
Jackson Mukurani Wanguthi
You set your risk to 2%. The trade goes against you. You move the stop. It goes further. You move it again. By the time you close, you have lost four times what you planned, and the next three trades are spent trying to dig out of a hole you dug yourself. The Risk Management Suite is the layer that prevents that sequence from starting. It is a position sizing and trade management expert advisor for MetaTrader 5. You attach it to a chart, set how much of your account you are willing to lose on a
Smartflow
Jackson Mukurani Wanguthi
Overview Smartflow is a technical indicator for MetaTrader 5 that displays directional trade signals, trend state and supply and demand levels in one chart window. It calculates a direction state from a volatility based trailing stop model using the Average True Range (ATR), and it prints buy and sell markers where that state changes on a closed bar. The indicator does not open trades and does not manage positions. All outputs are visual, and the decision to enter or exit a trade remains with
Quantam levels
Jackson Mukurani Wanguthi
Overview Quantum Levels is a technical indicator for MetaTrader 5. It calculates market structure zones, liquidity nodes, and a multi-layer price consensus, and displays these elements directly on the chart.   Displayed elements The indicator provides the following elements: 1. Market structure zones based on swing highs and lows, indicating active and broken structural areas. 2. Liquidity node areas and shift lines derived from structural breaks. 3. Color-coded consensus candles representing p
Filtrer:
Aucun avis
Répondre à l'avis