MovingAverage Cloud

  • Indicateurs
  • Felix Bitum
    Felix Bitum
    4.2 (10)
    A Programmer proficient in C++, JS, Python, SQL, Java and mql4/5 and pinescript.
    The market is like a rich minefield. Your tools are important in your quest to extract what you want. And I can do the following for you.
    1. Craft new tools
    2. Upgrade your tools
    3. Modify
  • Version: 1.1

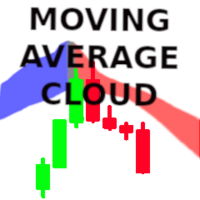
MovingAverage Cloud


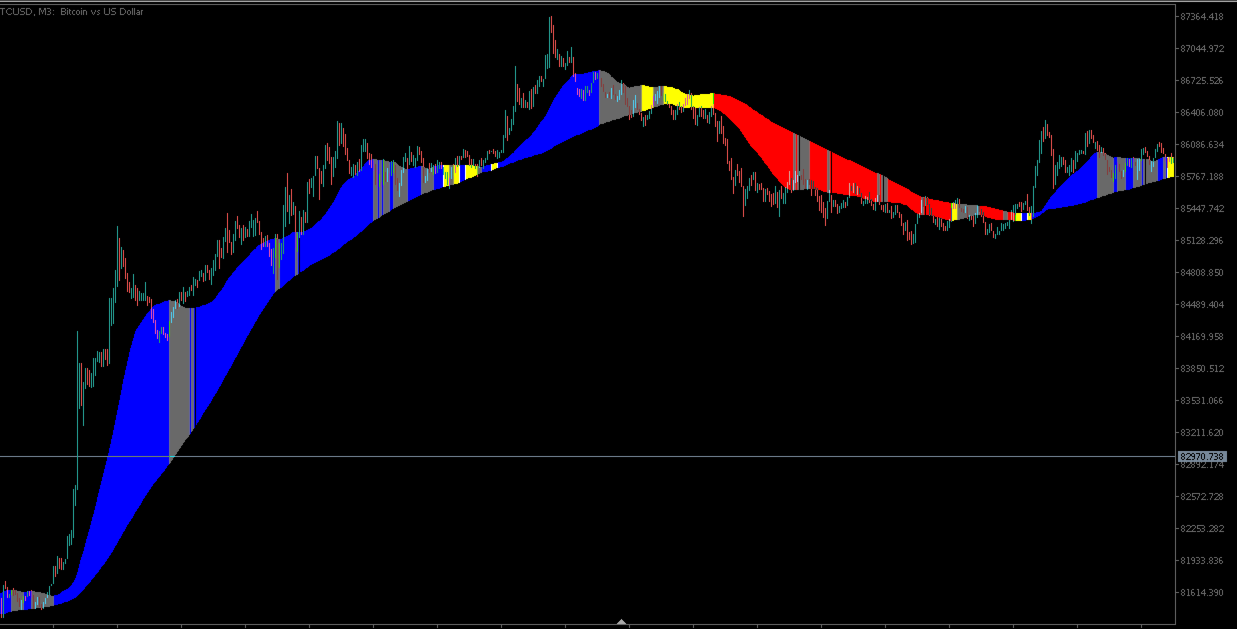
Imagine this, you want  to know when all moving averages between 20 to 100 are all moving in one direction.

This indicator does that.

You enter in the first period of the smallest moving average, and the last period of the highest moving average.

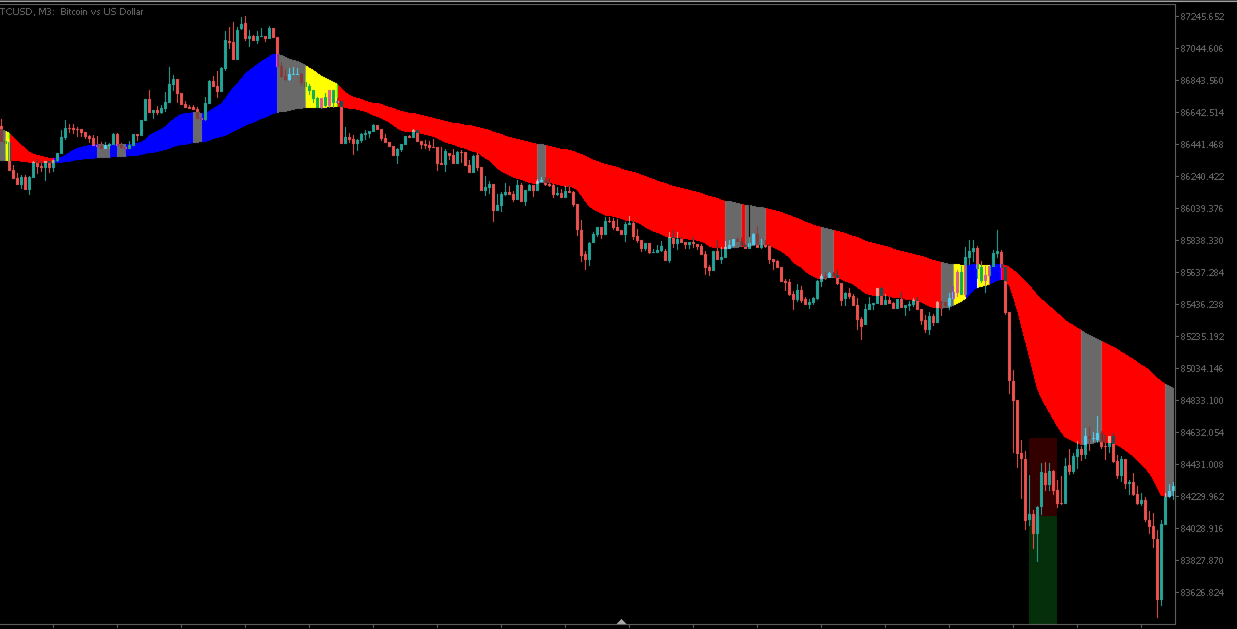
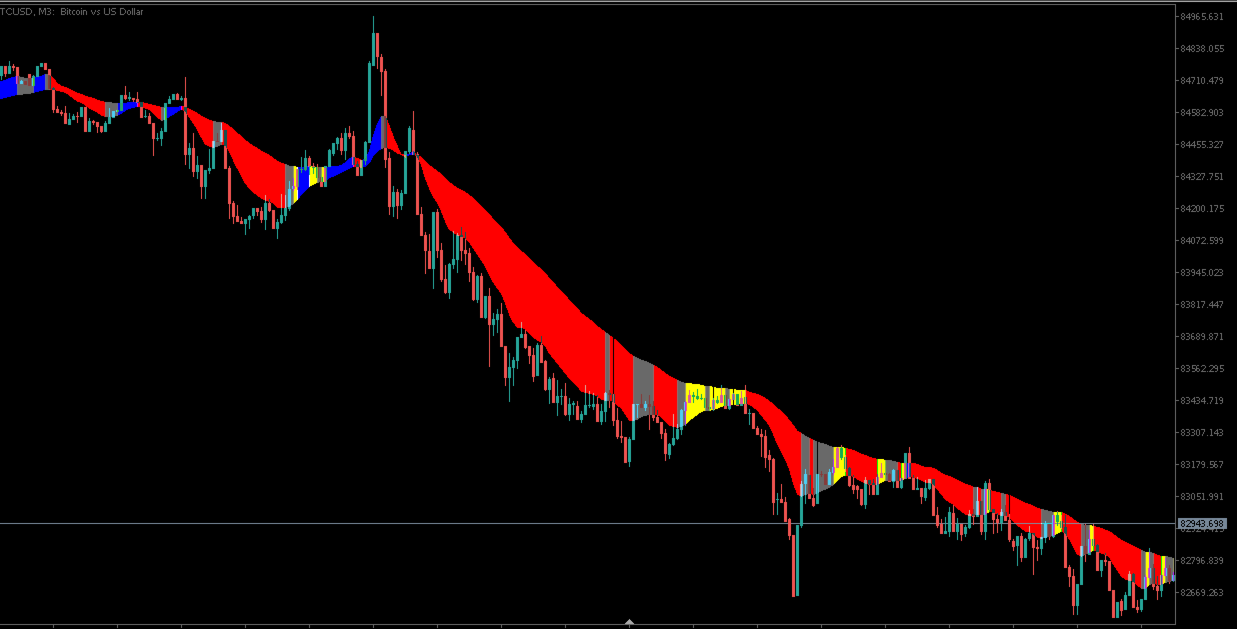
If all the moving averages are moving in the same direction, the indicator will plot the colour for that direction, e.g blue, more than half of the moving averages in that range change colour to the opposite direction, a yellow/orange colour will be plotted, but if less than half of all the moving averages change colour, the band changes colour to gray.


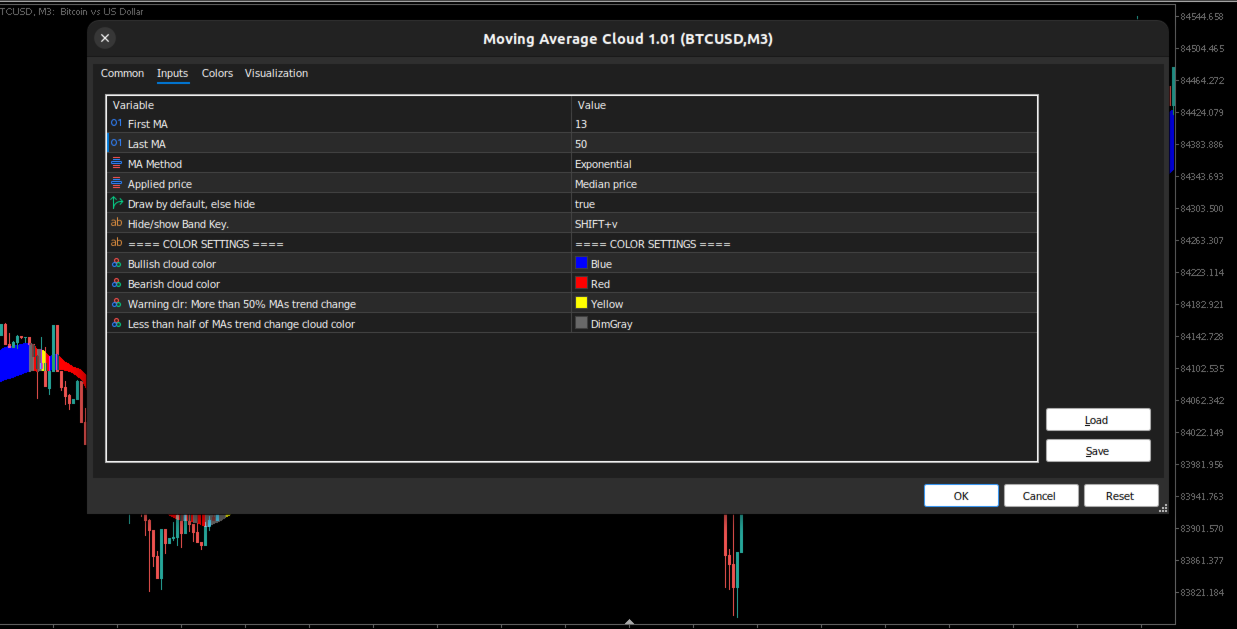
Table to exlpain the input settings menu


First MA Enter the value of the first or the smallest moving average period here
Last MA Enter the value of the last or the highest moving average period here
MA Method The way the moving average should be calculated
Applied price The price to be used in the calculation of the moving average e.g close, open, high, etc
Draw by default, else hide  Choose whether the moving average cloud should be plotted by default or not
Hide/show Band Key.  Set a keyboard short-cut to hide/show the moving average cloud e.g 'SHIFT+r' or just a letter 'R'
 ==== COLOR SETTINGS ====  
Bullish cloud color Set the colour of the when all the moving averages in that range are rising
Bearish cloud color Set the colour to be used when all the moving averages in that range are falling
Warning clr: More than 50% MAs trend change Set the colour to be displayed when more that half of the moving averages in that range have changed direction. 
Less than half of MAs trend change cloud color  Set the colour to be used when less than half of all the moving averages in the range are moving in an opposite direction


If you would like a custom indicator or EA based on this indicator, please, place an order here.
Plus de l'auteur
Simple Fair Value Gap Unlock the power of fair value gaps with this simple and precise, easy to use indicator designed to identify and visualize market inefficiencies Simple Fair Value Gap is an mt5 indicator which paints  the center of a fair value gap candle with a different color. A Fair Value Gap (FVG) is a three candle formation in which the middle candle does not get completely overlapped by the left and right candle. i.e The difference between the high and low of either left or right cand
FREE
Simple Fair Value Gap MT4 Unlock the power of fair value gaps with this simple and precise, easy to use indicator designed to identify and visualize market inefficiencies. Simple Fair Value Gap is an mt4 indicator which paints  the center of a fair value gap candle with a different color. A Fair Value Gap (FVG) is a three candle formation in which the middle candle does not get completely overlapped by the left and right candle. i.e The difference between the high and low of either left or right
FREE
HTF Candles MT4
Felix Bitum
5 (1)
HTF Candles MT4   est un indicateur pour MT4 qui trace le contour des bougies de période supérieure (HTF) directement sur les bougies de période inférieure, y compris toute période HTF de MT5 choisie.  L'indicateur vous offre la possibilité d'afficher ou non la bougie HTF actuelle en temps réel, sans décalage ni repainting. Fonctionnalités Bougies des Périodes MT5   : Trace les bougies de n'importe quelle période MT5 (ex : m3, m5, m12, m15, m20...) sur la période inférieure. Option Heiken Ashi  
VISUAL STRATEGY BACKTESTER This is a tool, which allows you to manually backtest your strategy on historical prices, and later shows you the results. If you have a strategy and want to do a quick backtest based on historical prices, without coding, this tool enables you to do so. How it works 1. You have a strategy you want to test. 2. You launch the visual strategy backtester 3. Click add 'New Box' or type the keyboard shortcut for adding a new position box 4. Adjust its stoploss and take pro
HTF Candles  ( Les bougies HTF ) sont un indicateur qui trace le contour des bougies de timeframe supérieur sur une bougie de timeframe inférieur. L'indicateur vous offre la possibilité d'afficher ou non la bougie HTF actuelle en temps réel, sans décalage ni repainting. Caractéristiques Aucun objet dessiné sur le graphique :   L'indicateur ne trace ni lignes ni rectangles sur le graphique, il se contente de dessiner les bougies HTF. Cela maintient votre graphique simple et épuré. Sélection MTF
VISUAL STRATEGY BACKTESTER This is a tool, which allows you to manually backtest your strategy on historical prices, and later shows you the results. If you have a strategy and want to do a quick backtest based on historical prices, without coding, this tool enables you to do so. How it works 1. You have a strategy you want to test. 2. You launch the visual strategy backtester 3. Click add 'New Box' or type the keyboard shortcut for adding a new position box 4. Adjust its stoploss and take pro
Filtrer:
Aucun avis
Répondre à l'avis