Detrend Oscillator
- Indicateurs
- Version: 1.23
- Mise à jour: 18 juillet 2024
- Activations: 7

Description
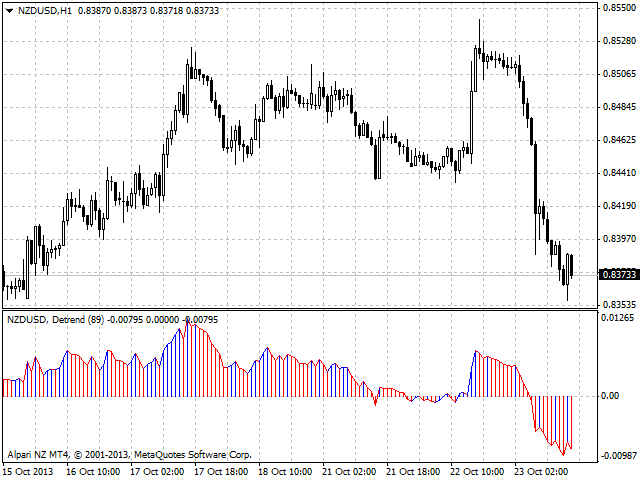
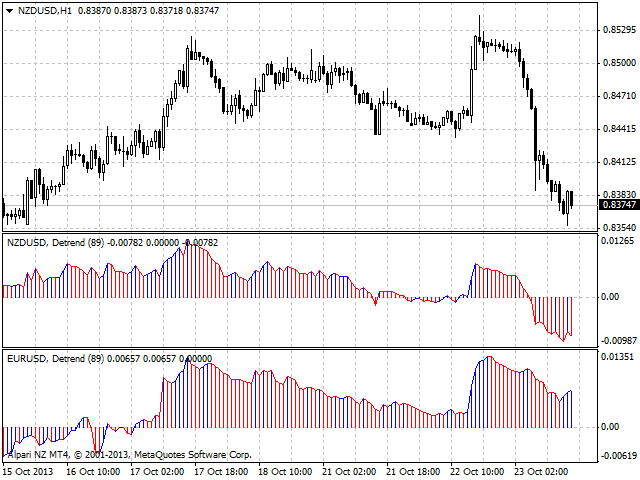
A colored multicurrency/multi-symbol Detrend Oscillator.
In fact, the oscillator shows how far the current price has gone from a certain equilibrium price expressed in the form of a moving average. If the oscillator is greater than zero, it reflects the value of the price increase. If less - the value of the price fall.
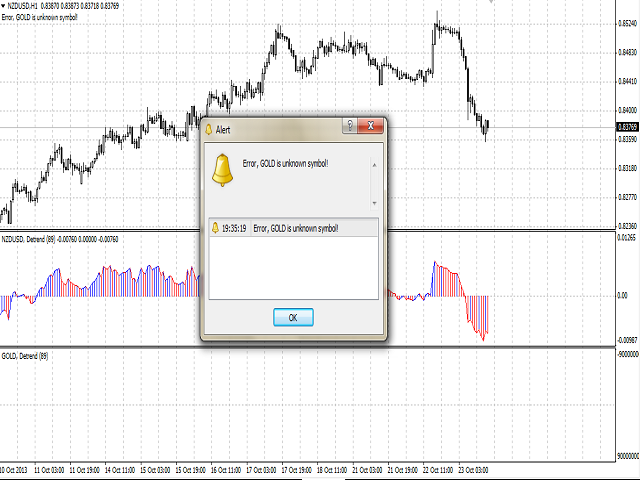
The oscillator may be used with any broker, irrespective of the name of the financial instrument since it is necessary to manually enter the name as an input parameter. If you enter a non-existent or incorrect name of a financial instrument, you will receive an error message that this financial instrument is unknown (does not exist).
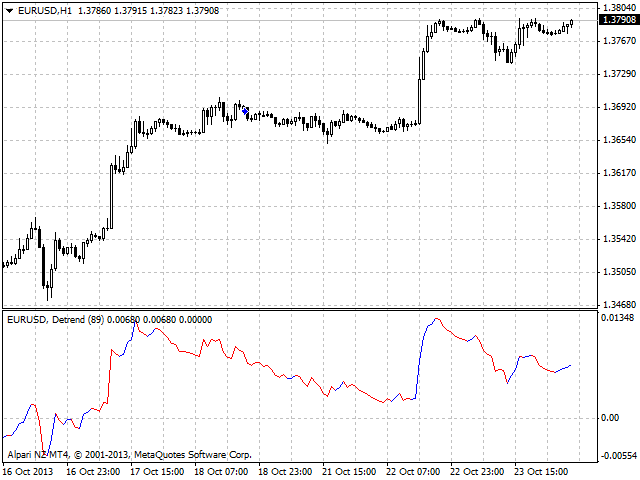
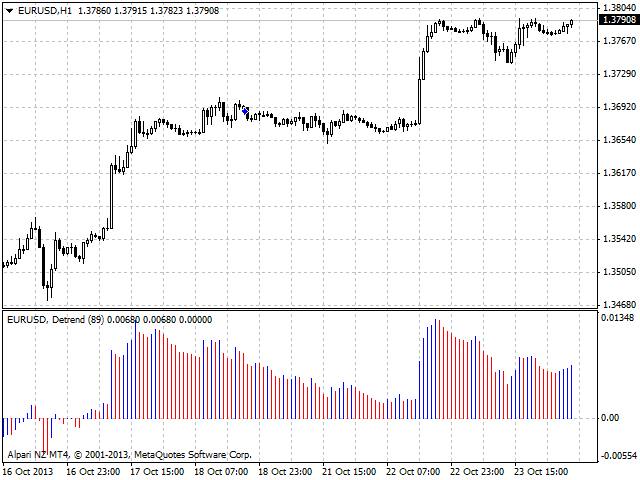
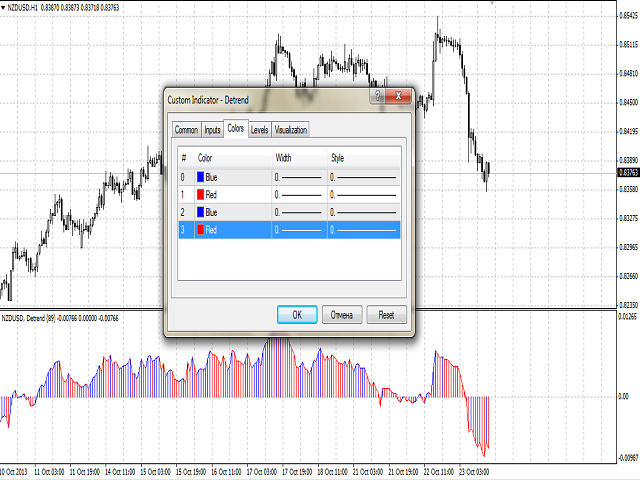
You can select the way of the graphic display of the oscillator values, as well as color the growing and falling lines of the histogram.
Purpose
The indicator can be used for manual or automated trading in an Expert Advisor. Values of indicator buffer of the double type can be used for automated trading:
- The main line of the indicator - buffer 4.
- The bullish line of the indicator - buffer 0, must not be equal to 0.
- The bearish line of the indicator - buffer 1, must not be equal to zero.
- The bullish line of the indicator histogram- buffer 2, must not be equal to 0.
- The bearish line of the indicator histogram - buffer 3, must not be equal to zero.
Inputs
- Currency_Name - the name of the financial instrument.
- Draw_Method - Oscillator drawing method:
- a line and a histogram (default).
- a line.
- a histogram.
- Ind_Period - indicator calculation period.
- MA_Method - the MA averaging method.
- Applied_Price - used price.
- Shift - the sift o the basic indicator relative to the price chart.
Recommendations
It is recommended to pay attention to the identity or difference in the colors of the line and the histogram simultaneously.