Trend Range Pro
- Indicateurs
- Version: 1.18

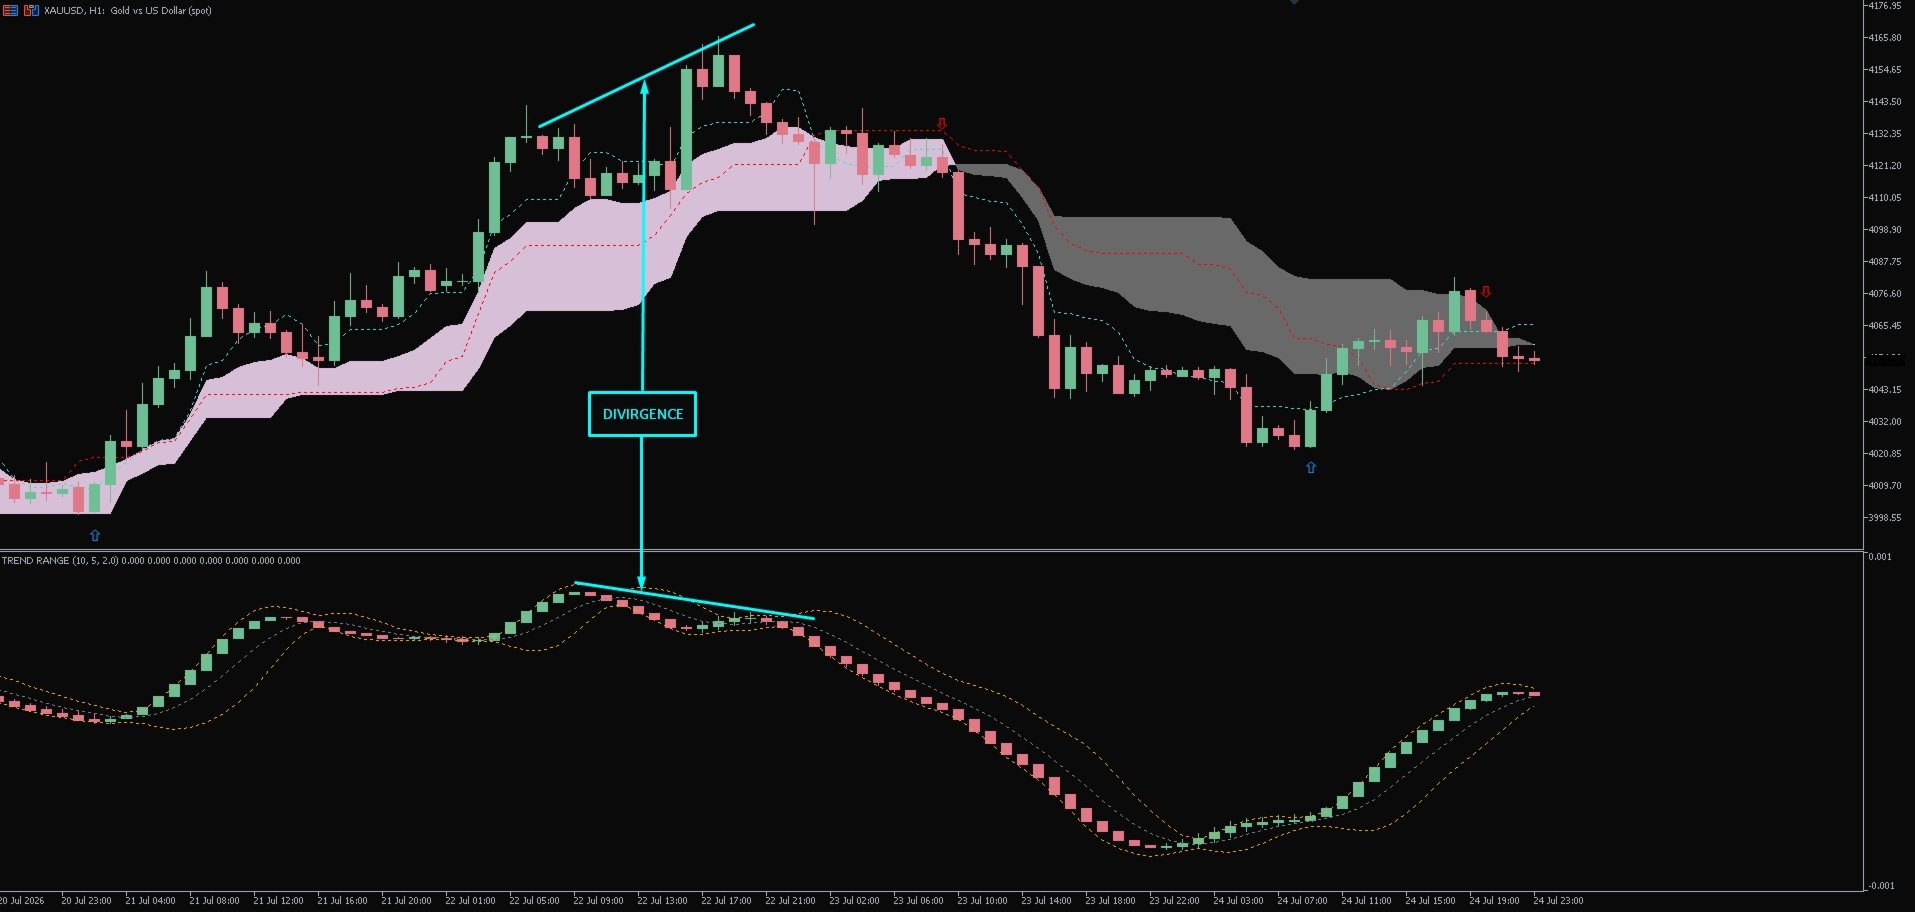
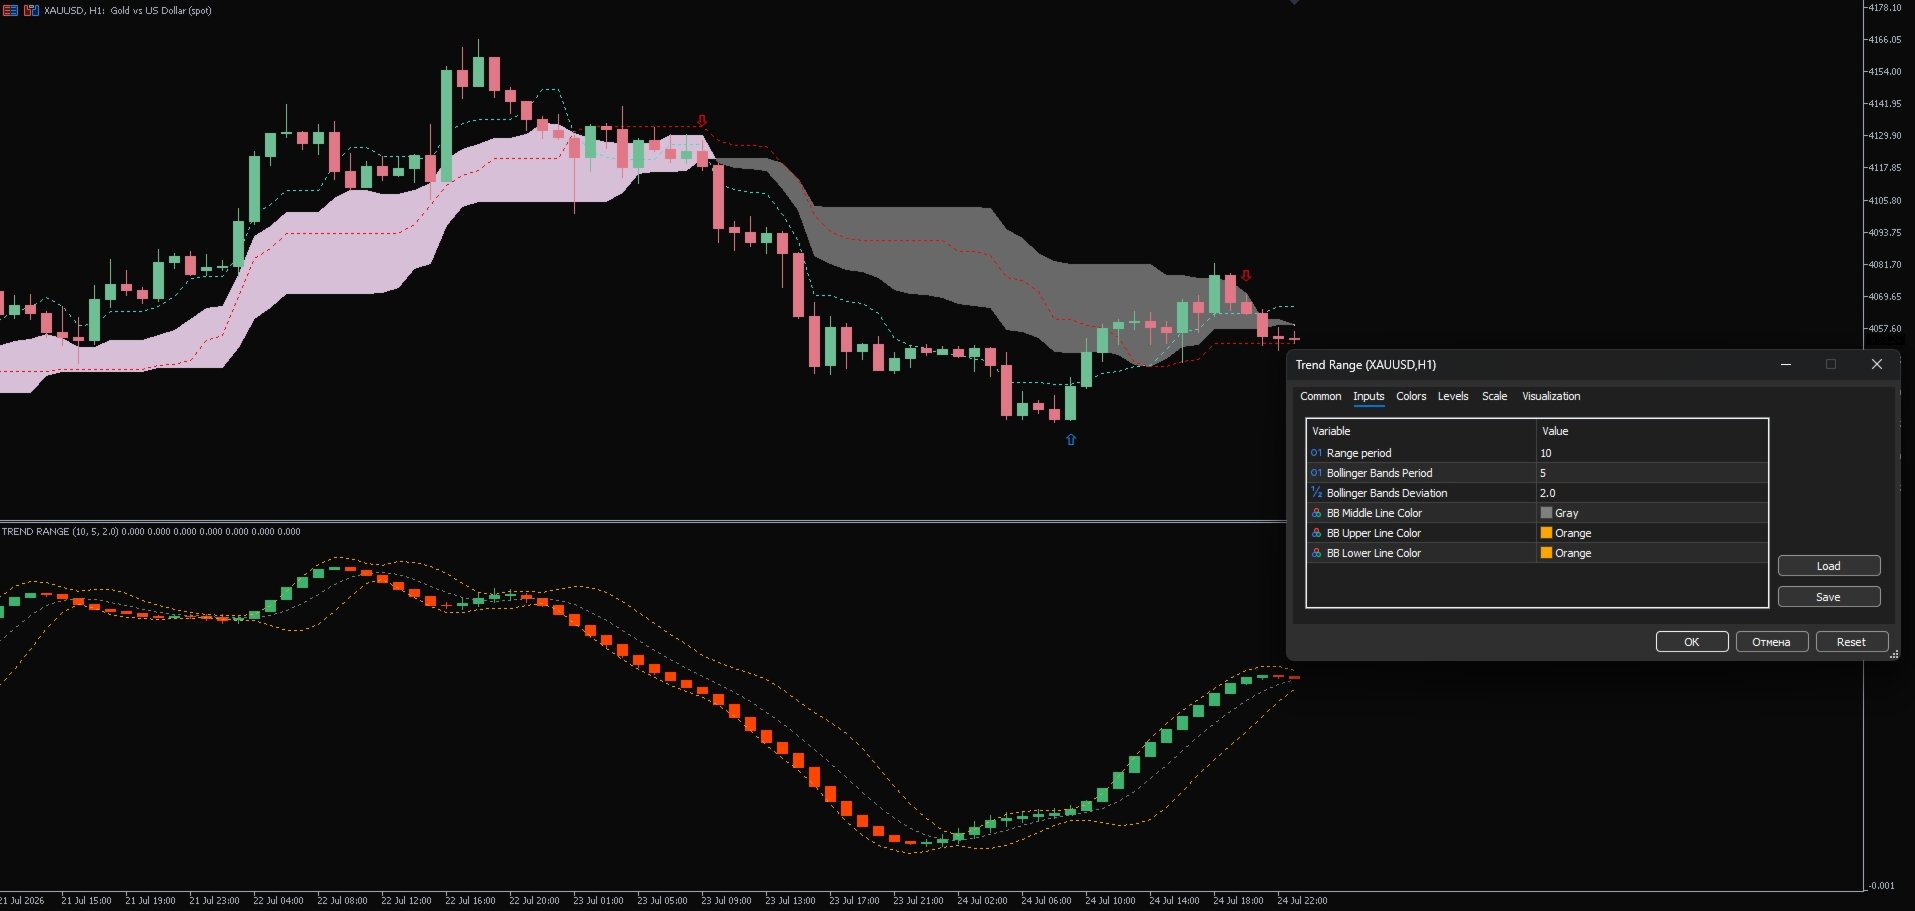
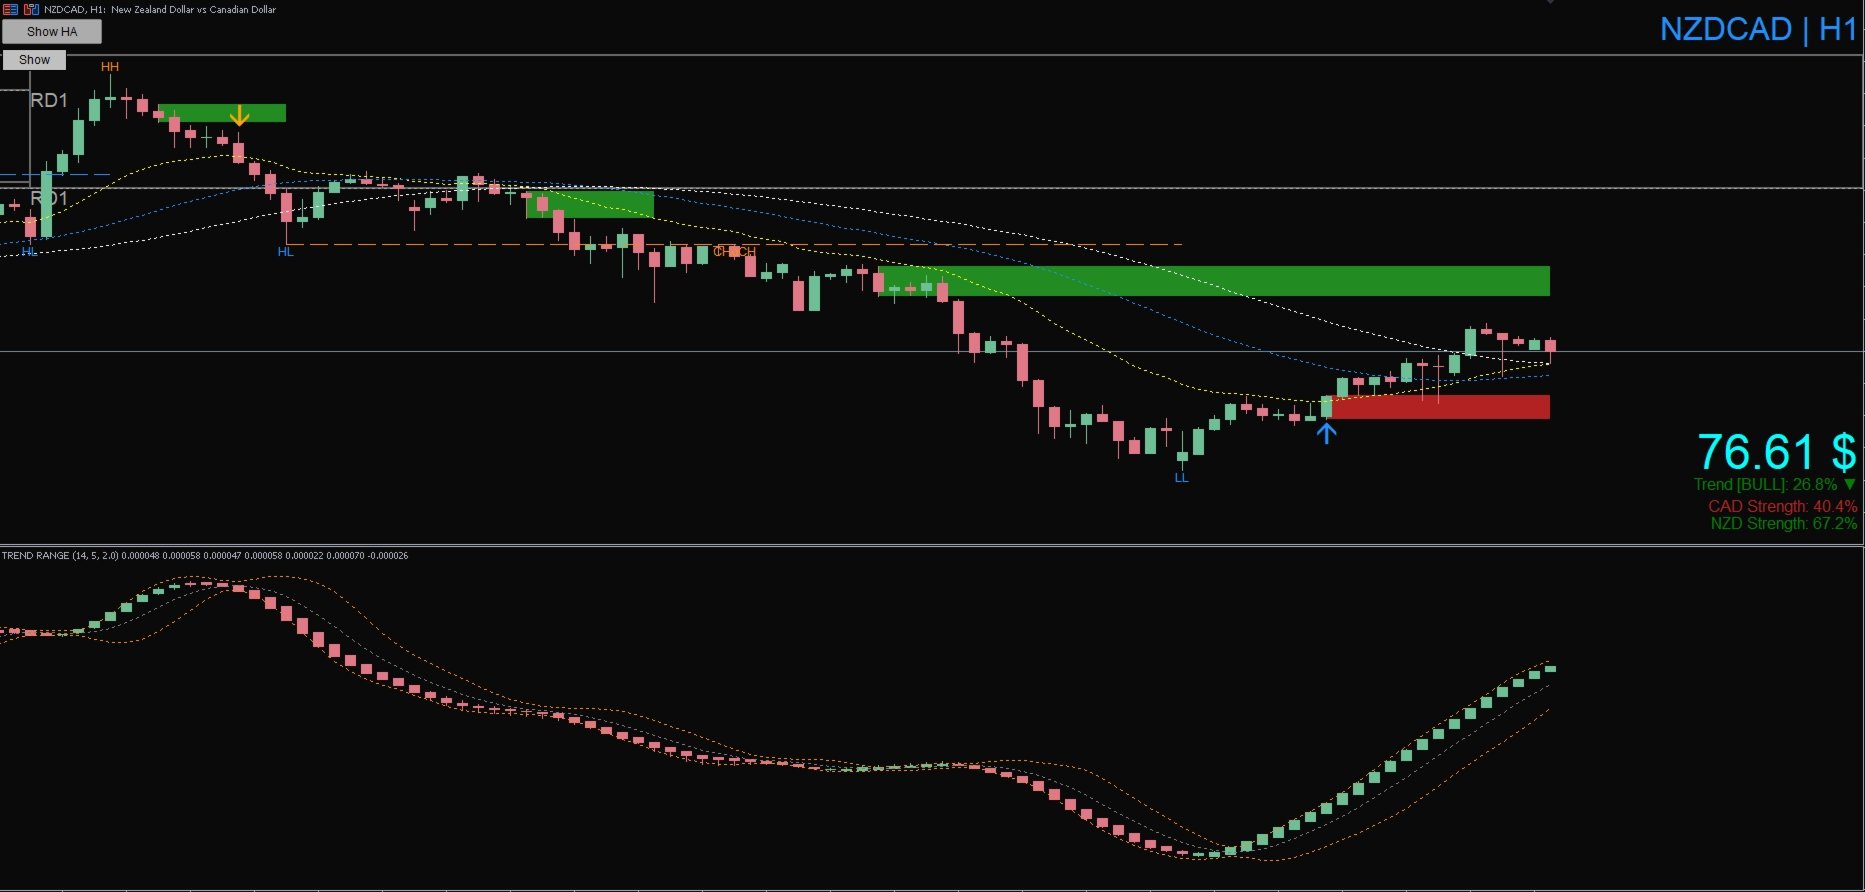
TREND RANGE is a modified oscillator indicator that includes the Bollinger Bands in its calculation. It shows the market condition and the strength of the trend in the form of Heikin Ashi candles. Changes in the color of the candles indicate changes in the direction of the price movement. If you see full-bodied candles without shadows or large candles with small shadows, it is a sign of strong movement. If you see a decrease in the size of the oscillator candle body and an increase in the size of the shadows, it is a sign of slowing down and a possible reversal. The Bollinger Bands provide you with a hint. If they are narrowed and do not expand, the market is flat. A change in color and a full-bodied candle crossing the middle line of the Bollinger band are signals to enter the market. A change in candle color is a signal to exit the market. Like any other oscillator, trend range has divergence. Identify divergence correctly. !!! Divergence does not work in 100% of cases, as with any other oscillator, but the percentage of divergence working is very high!!! Use TREND RANGE in conjunction with any other indicator, for example Stochastic or CCI. It is recommended to use the indicator with the default settings or as shown in the screenshot.
RECOMMENDED TO USE WITH OUR SMART ENTRY PRO TRADING SYSTEM