AstraPulse Range Pressure
- Indicateurs
- Version: 1.0
- Activations: 5

AstraPulse Range Pressure — MQL5 Market Product Description
Short Description
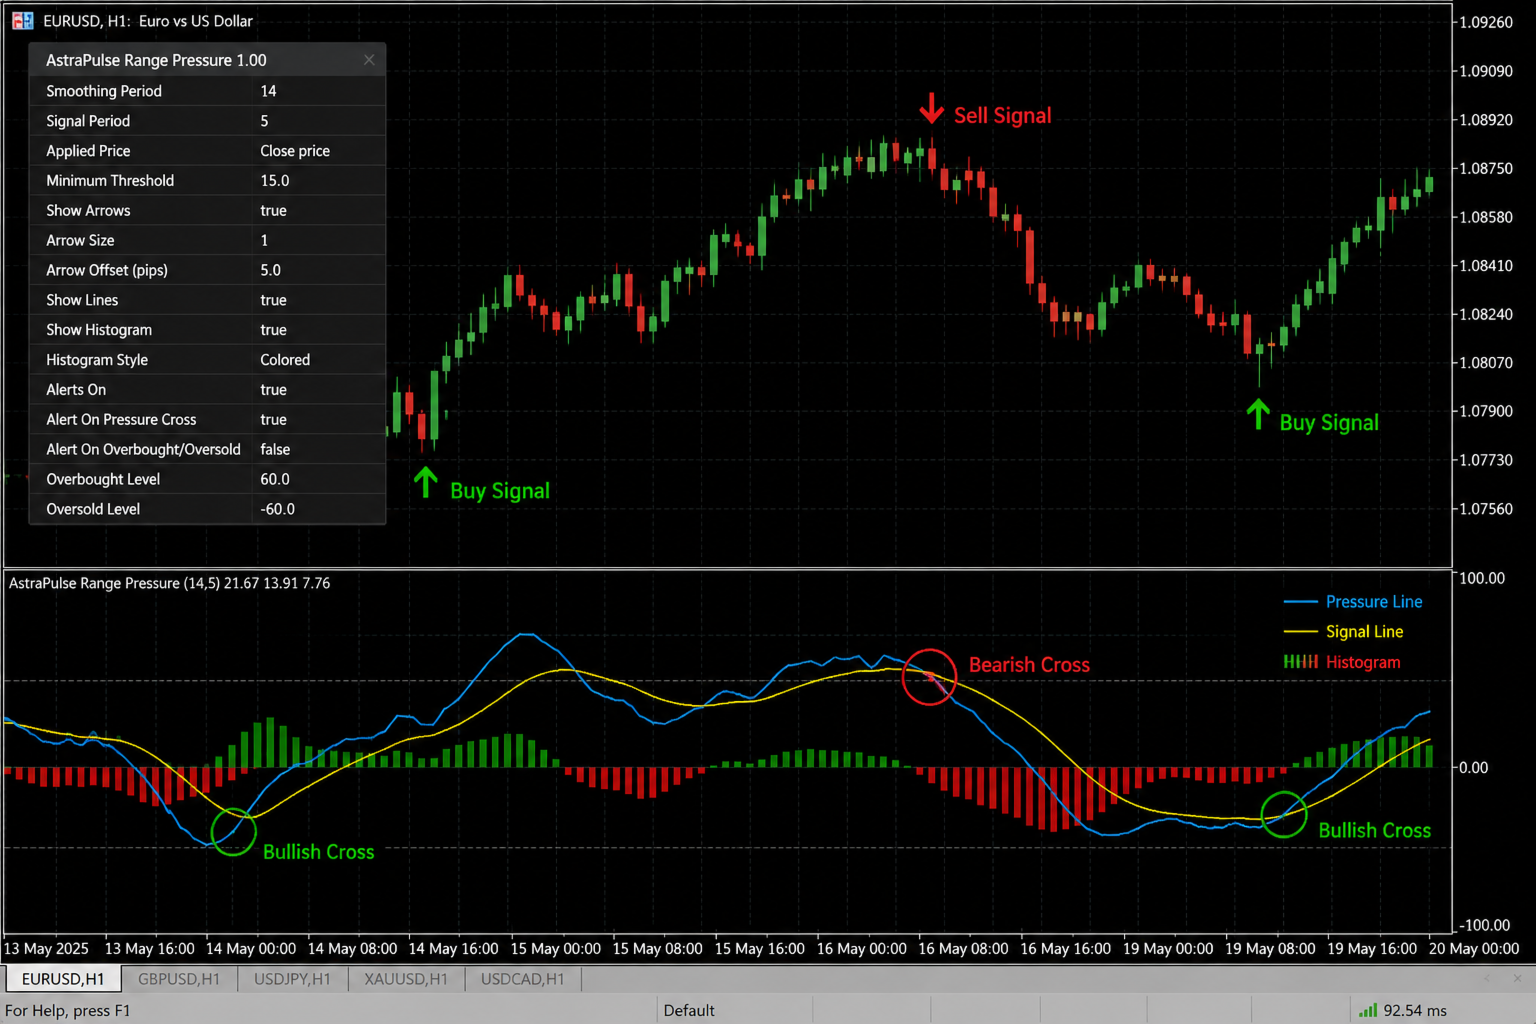
AstraPulse Range Pressure is a MetaTrader 5 custom indicator that measures candle body pressure relative to full candle range, smooths the result, and displays momentum crosses using a signal line, histogram, and optional arrows.
Main Description
AstraPulse Range Pressure is a professional custom indicator for MetaTrader 5. It is designed for manual traders who want a clean oscillator that focuses on candle pressure rather than classic RSI, ATR bands, or price channels.
The indicator calculates a candle pressure value by comparing the candle body direction to the complete candle range. A strong bullish candle that closes above its open receives positive pressure. A strong bearish candle that closes below its open receives negative pressure. This raw pressure value is then smoothed with an EMA-style calculation. A second EMA-style signal line is applied to the smoothed pressure line.
The result is an oscillator that helps visualize whether recent candles show bullish or bearish range pressure. It is not a prediction engine. It is a clean technical analysis tool that helps the user review momentum shifts based on actual closed candle structure.
This product does not trade automatically. It does not open orders, close orders, manage positions, use martingale, use grid logic, call DLL files, access files, or use WebRequest. It is intended for visual analysis and manual decision-making only.
Core Logic
Raw Pressure = 100 × (Close - Open) / (High - Low)
The raw value is limited to the oscillator range from -100 to +100.
Positive values suggest bullish candle pressure.
Negative values suggest bearish candle pressure.
Values near zero suggest weak directional pressure.
The indicator then applies smoothing to reduce noise:
- Range Pressure Line = smoothed raw candle pressure.
- Signal Line = smoothed pressure line.
A bullish pressure cross can appear when the Range Pressure line crosses above the Signal Line and the pressure value is above the minimum signal threshold.
A bearish pressure cross can appear when the Range Pressure line crosses below the Signal Line and the pressure value is below the negative minimum signal threshold.
Key Features
- Candle pressure oscillator.
- Measures candle body pressure relative to total range.
- EMA-style smoothing.
- Signal line for momentum crosses.
- Bullish and bearish histogram.
- Optional buy and sell arrows.
- Optional popup alerts.
- Closed-bar signal mode by default.
- No future data.
- No repainting of closed-bar signals.
- No automatic trading.
- No DLL.
- No WebRequest.
- No file access.
- Lightweight and suitable for multiple symbols and timeframes.
Input Parameters
Pressure Smooth Period
Default: 8
Controls the smoothing period of the raw candle pressure line.
Signal Period
Default: 13
Controls the smoothing period of the signal line.
Minimum Signal Pressure
Default: 10.0
Controls the minimum positive or negative pressure needed before an arrow signal can appear. Higher values produce fewer but stronger signals. Lower values produce more frequent signals.
Show Histogram
Default: true
Shows or hides the bullish and bearish pressure histogram.
Show Arrows
Default: true
Shows or hides pressure cross arrows.
Use Current Bar For Signals
Default: false
If false, arrows are based on closed candles only. This is the recommended setting for stable chart reading. If true, signals can appear on the current forming candle and may change before the candle closes.
Enable Popup Alerts
Default: false
Enables or disables popup alerts.
Alert On Current Bar
Default: false
Controls whether popup alerts can trigger on the current forming candle or only on a closed candle.
How To Use
1. Attach AstraPulse Range Pressure to a MetaTrader 5 chart.
2. Start with the default settings.
3. Watch the blue Range Pressure line and orange Signal Line.
4. Bullish pressure is stronger when the pressure line is above the signal line and above zero.
5. Bearish pressure is stronger when the pressure line is below the signal line and below zero.
6. Green arrows highlight bullish pressure crosses.
7. Red arrows highlight bearish pressure crosses.
8. Confirm all signals with your own trend, support/resistance, market structure, and risk management rules.
Signal Interpretation
Buy Pressure Cross
A buy pressure arrow can appear when the pressure line crosses above the signal line and the current pressure value is greater than or equal to the selected Minimum Signal Pressure.
Sell Pressure Cross
A sell pressure arrow can appear when the pressure line crosses below the signal line and the current pressure value is less than or equal to the negative Minimum Signal Pressure.
Histogram
The green histogram appears when bullish pressure is positive and above the signal line. The red histogram appears when bearish pressure is negative and below the signal line.
No-Repaint Explanation
By default, Use Current Bar For Signals is false. This means arrow signals are generated only on closed bars. Once a bar is closed, the indicator does not use future candles to change that signal. The calculation uses only open, high, low, and close values available up to the bar being calculated.
Important Notes
AstraPulse Range Pressure is not a complete trading system and does not guarantee profitable trades. It is a technical analysis tool. Market conditions can change quickly and any indicator can produce false signals. Always use proper risk management and test the indicator on a demo account before using it in live trading.
Risk Disclaimer
Trading financial markets involves risk. This indicator does not provide financial advice and does not guarantee future results. Use it only as part of a complete trading plan.
Suggested Tags
Range Pressure, Candle Pressure, Momentum, Oscillator, Signal Line, Histogram, MT5, MetaTrader 5, Custom Indicator, Manual Trading, Technical Analysis