 MetaTrader 5
 Experts
 Indicateurs
 Bibliothèque
 Utilitaires
 Widgets
 Règles
Regardez les tutoriels vidéo de Market sur YouTube
Comment acheter un robot de trading ou un indicateur
Exécutez votre EA sur
hébergement virtuel
hébergement virtuel
Test un indicateur/robot de trading avant d'acheter
Vous voulez gagner de l'argent sur Market ?
Comment présenter un produit pour qu'il se vende bien
Indicateurs techniques gratuits pour MetaTrader 5 - 48
 Les signaux provenant des indicateurs techniques jouent un rôle crucial dans l'ouverture et la clôture des transactions sur les marchés boursiers et les marchés forex. L'essence des indicateurs est une transformation mathématique du prix d'un symbole financier visant à prévoir les changements de prix futurs. Testez les indicateurs techniques pour mieux prédire le comportement du marché et en tirer profit.

GoldEdge Signal Indicator
Description
Professional signal indicator for XAUUSD (Gold) based on a validated trend-pullback strategy. Draws BUY/SELL arrows on the chart with calculated SL/TP levels, a real-time dashboard, and popup alerts.
Validated edge: PF 1.44 / Sharpe 3.87 / Max DD 3.95% (12-month backtest, real ticks).
What It Does
- BUY/SELL arrows drawn directly on the chart at signal bars
- Entry, SL, and TP horizontal lines for the last signal (visual trade setup)
- Live dashboard sho
FREE

======================================================== BUY/SELL VOLUME MOMENTUM DASHBOARD - MQL5/MT5 MARKET DESCRIPTION (formatting: **bold** = Bold button; lines with • = bullet list; UPPERCASE = heading) ========================================================
OVERVIEW ------------------------------------------------------- **Buy/Sell Volume Momentum Dashboard** reads buying vs selling volume momentum and presents it as a clear on-chart dashboard, so you can see which side is driving the m
FREE
The indicator looks for the "Fifth dimension" trade signals and marks them on the chart. A detailed description of the chart patterns that generate the trade signals can be found in Chapter 8 "The Balance Line Trades" in the book Williams' "New Trading Dimensions". Signal levels with indication of the position entry or stop loss placement price are indicated directly on the chart. This feature creates additional convenience for the trader when placing pending orders. A solid horizontal line is d
FREE

Check out the detailed blogpost with screenshots: https://www.mql5.com/en/blogs/post/771285
Features All trades in one subwindow — Every open BUY and SELL order gets its own mini candlestick chart, no matter what symbol it belongs to. Smart price scaling — EURUSD and BTCUSD look the same size. The indicator uses ATR normalization so every trade is equally readable. Live candle updates — The latest candle reflects the real-time Bid price, not just the last close. Entry, SL & TP lines — See exact
FREE
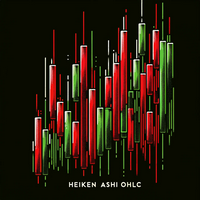
Are you tired of trading without a clear direction ? Do market fluctuations and noise leave you feeling overwhelmed ?
Here is the solution you've been searching for! Imagine an indicator that simplifies trading, cuts through market noise, and provides crystal-clear signals. The Heiken Ashi OHLC Indicator does just that!
What does the Heiken Ashi OHLC Indicator do? It transforms traditional candlestick charts into a trader's dream. Instead of dealing with erratic price movements, you'll witn
FREE

Daily Price Ruler Pro - Visual Grid for Daily Open Levels
An essential visual tool that creates a dynamic, customizable "Price Ruler" anchored to the Daily Open price. Perfect for day traders to track pip/point distances from the start of the day at a glance. Full Description: Daily Price Ruler Pro is a lightweight, highly customizable indicator designed for precise price action and distance tracking. It automatically plots a vertical "Ruler Body" ahead of the current price action, with hor
FREE
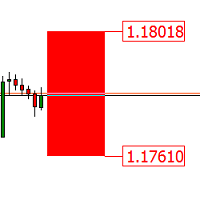
StopLevel The meter controls the STOPLEVEL level. When the level changes, it signals with an alert. STOPLEVEL - the minimum offset in points from the current closing price for placing Stop orders, or the minimum allowable stop loss / take profit level in points. A zero value of STOPLEVEL means either the absence of a restriction on the minimum distance for stop loss / take profit, or the fact that the trading server uses external mechanisms for dynamic level control that cannot be transmitte
FREE

L'indicateur montre une tendance et des objectifs pour la situation actuelle chaque jour. L'indicateur réduit également le nombre d'offres de perte, pour compter la bonne définition des conditions du marché. Designe pour l'analyse et le commerce dans la journée.
Comment utiliser:
La ligne bleue montre le prix d'ouverture de la journée, qui est fixée sur une formule spéciale de 4 lignes qui fixe les cibles pour la journée. Vous pouvez regarder et ouvrir des accords vers la tendance.
La ligne g
FREE

Global Exchange Sessions Global Exchange Sessions is an MQL5 indicator that marks the regular trading hours of the world’s main stock exchanges directly on your chart. Each session is shown as a colored rectangle. The rectangle starts at the official market open and ends at the official market close. Its upper and lower edges follow the session high and low as new prices arrive. This makes it easy to see when major equity markets are active, where each session formed its range, and how price rea
FREE
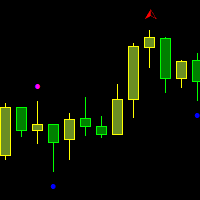
Fractals Broken/Unbroken This indicator detects classic Bill Williams fractals and separates them into two categories: broken and unbroken fractals. The tool helps traders quickly identify which fractal levels have already been broken by price action and which levels remain intact as potential support or resistance zones. The indicator works directly on the chart and displays different fractal types using separate colors for easier visual analysis. How It Works The indicator uses the standard 5-
FREE

Key Features of v1: Smart Compact Layout: Specifically optimized for Crypto (BTC) and Gold (XAU). Prices and Volumes are separated into independent columns. No more overlapping text, keeping your chart clean and professional. ️ Micro-Volume Visibility: A forced rendering algorithm ensures that even the smallest pending orders are visible as micro-bars, so you never miss liquidity details. ️ Smart Status Detection: LIVE DATA: When the broker provides real Level 2 data, the panel glow
FREE
In the world of finance, correlation is a statistical measure of how two securities move in relation to each other. Correlations are used in advanced portfolio management. This indicator measures how different securities move in relation to a reference one, thus making portfolio management easier. [ Installation Guide | Update Guide | Troubleshooting | FAQ | All Products | Get Help ] Avoid concurrent trades in highly correlated instruments Find trading opportunities among highly correlated
FREE

Account Recorder est un indicateur de statistiques de compte et d'analyse de performance conçu spécifiquement pour les traders utilisant MT5. Il récupère automatiquement l'historique des transactions, les positions en cours et les détails du compte, pour les présenter sous la forme d'un tableau de bord statistique intuitif.
Parmi ses fonctionnalités clés, on trouve : des indicateurs de performance (quotidiens, hebdomadaires, mensuels, trimestriels, annuels) ; un classement par symbole, « Magic
FREE

Certainly! Let me introduce you to a powerful tool for MetaTrader 5 (MT5) that can automatically identify and draw support and resistance (S&R) levels on your trading charts. This tool is called the “Support and Resistance Levels Guru” . Support Resistance Levels Guru The Support & Resistance Indicator automatically displays essential S&R levels on your chart. These levels are crucial for technical analysis and are used by many traders. Resistance levels (zones) are shown in R ed , while suppo
FREE

Vertical Time-Lines Auto V1.0F – Market Session Visualizer Overview Vertical Time-Lines Auto is a professional MT5 indicator that automatically draws vertical lines at key market boundaries. No more manual line drawing or guessing when new trading periods begin – just look at your chart and see. What it does Draws three types of vertical lines on your chart Lines are placed behind candles by default for clean visibility Tooltips show exact date and boundary information when hoveri
FREE
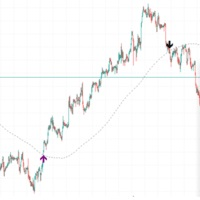
If the price is cutting above the slow length moving average, a breakout may occur. If the price is cutting below, a pullback may occur in the market. This was known for a long time, but there aren't many indicators which signal on the event. Candlestick pattern validation is also used in this indicator so that signals will not be drawn on doji candles or small "uncertainty" candles. The length of the moving average period can be defined by the user (default is 200). The number of price movement
FREE
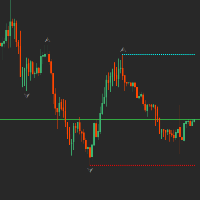
The fractal indicator shows the latest support and resistance levels. If the price breaks through the level and is fixed, the indicator draws a rhombus of yellow or crimson color signaling a possible continuation of the movement towards the breakdown.
Indicator Settings:
- BarCount: sets the minimum number of bars required to build a fractal.
It is better to use the indicator in conjunction with other indicators.
FREE
- Chart Time Indicator is very simple and easy, but it can be very important to control the time before opening any manual trade. This indicator shows the time on the chart between 3 different options. Input Parameters: - Show Time : Select all the time options that you want to see. Local Time (Personal Computer Time), Server time (Broker Time) or GMT Time. Recommendations: - Use only one Chart Time Indicator for each Chart.
FREE

Session Visualizer v1.0 This indicator displays the main trading sessions (Asian, London, and New York) directly on the chart. It helps traders understand market activity by visually highlighting session times based on broker time. The indicator automatically detects active sessions and updates in real time. It uses color overlays to differentiate between sessions while maintaining chart visibility. Features include real-time session visualization, adjustable transparency, and support for all s
FREE
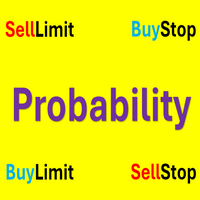
Powerful Price Discovery
Features
1. Displays Key Price Levels and Probability.
2. Key Price Levels: Calculated as (Buy + Sell) × (Limit + Stop) = 4 Lines, shown when Probability > 55%.
3. Time Frame Dependency: Each Time-frame has different OHLC prices, affecting Probability calculations.
4. Breakout Condition: If the price breaks the historical Highest or Lowest, Probability may reach 99%.
5. Parameter: PatrolPoints = 8 : The indicator recalculates only when the price moves over PatrolPoint
FREE

EasyADX - Color Trend Histogram & Alerts for MT5 Visual color-coded ADX Trend Histogram with automatic pop-up and push notifications. Instantly spot strong trends and filter out noisy sideways markets. Key Features: 3-Color Visual Histogram: Green for Strong Uptrends, Red for Strong Downtrends, Gray for Flat/Ranging markets. Custom ADX Threshold: Easily adjust the trend filter level (default at 25). Real-Time Alerts: Get Pop-up alerts and Push Notifications on your phone right at the start of a
FREE
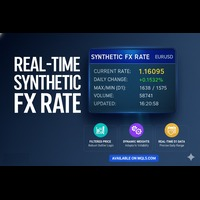
Taux de Change Synthétique en Temps Réel (Real-Time Synthetic FX Rate) Real-Time Synthetic FX Rate est un indicateur conçu pour calculer une estimation synthétique et robuste du taux de change pour toute paire de devises disponible chez votre courtier (y compris les paires majeures, mineures et exotiques). Son objectif est d'offrir une référence dynamique qui reflète la formation du prix minute par minute , fournissant un guide d'orientation avant la publication des taux officiels ou des validat
FREE

S_R_MT5_V1 Professional Support and Resistance indicator for MetaTrader 5 designed for traders looking for fast, clean and visual key market zones. S_R_MT5_V1 automatically detects important support and resistance levels displaying dynamic zones directly on the chart with a modern and optimized visualization for intraday trading and scalping. Perfect for: Scalping Intraday trading Reversal trading Breakouts Institutional zone confirmation Main Features: Automatic support and resistance detectio
FREE

General Description Candle Countdown is a visual indicator for MetaTrader 5 that displays the time remaining until the current candle closes in real-time. The indicator presents information panels attached to Bid and Ask lines, showing countdown timers, current candle type, and other useful information. Key Features 1. Candle Time Display Countdown Timer : Time until candle close in MM:SS format Elapsed Time : Time since candle opening Percentage Completion : Real-time percentage of candle c
FREE

Chaque trader connaît le rituel : ouvrir les paramètres de l'indicateur, changer un chiffre, cliquer sur OK, scruter le graphique, se dire que ce n'est pas ça, rouvrir les paramètres. Le DeMarker est ce discret indicateur de surachat/survente auquel la plupart des traders ne touchent jamais : il reste éternellement sur les 0.30/0.70 par défaut, parce que tester autre chose coûte un aller-retour dans la boîte de dialogue. DeMarker Live Tuner met fin à cela. C'est un DeMarker que vous réglez direc
FREE
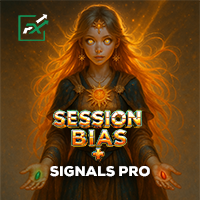
Session Bias & Trade Signals in one tool. Detects Asia, London & NY session trends, shows bias strength, alerts bias flips, and plots Entry/SL/TP levels with R:R. Simple dashboard for quick decisions. Simple but powerful trading assistant. This indicator automatically detects the market bias during the Asia, London, and New York sessions .
It helps traders stay on the right side of the trend, avoid neutral zones, and catch bias flips with alerts. Bias Detection – Shows session bias as Bullish
FREE

A Range Detector Indicator is a technical analysis tool designed to automatically identify when the market is not trending and is instead moving inside a sideways consolidation structure (range) . In professional trading systems, it is less about drawing boxes and more about classifying market state : trend vs range. To understand it properly, you need to see it as a market regime detector , not just a support/resistance tool. 1. What a “range” actually means (core concept) A market is consid
FREE

Donchian Toshio — Canal des plus hauts et des plus bas pour MetaTrader 5 Donchian Toshio affiche un canal calculé à partir des plus hauts et des plus bas enregistrés pendant la période sélectionnée. L’indicateur présente trois lignes : Ligne supérieure : le plus haut de la période ; Ligne inférieure : le plus bas de la période ; Ligne centrale : la moyenne entre les limites supérieure et inférieure. Le canal peut être utilisé pour faciliter l’analyse des tendances, des consolidations, de la vola
FREE

A1rum V38 Zone Compass is a clean visual indicator designed to help traders read market structure using V38 zone levels.
The indicator shows V38 zone high, mid and low levels directly on the chart, with candle coloring to help identify whether price is trading above, below or inside the active zone.
A compact dashboard displays market bias, price area, market mode, trend bias, trend strength and current zone status. Optional popup, email and push alerts are also available for zone state and
FREE
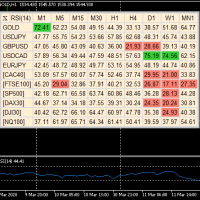
A useful dashboard that shows the RSI values for multiple symbols and Time-frames. It can be easily hidden/displayed with a simple click on the X top left of the dashboard. You can input upper and lower RSI values and the colours can be set to show when above/below these values. The default values are 70 and 30. You can choose whether the dashboard is displayed on the right or left of the chart. If you want to have 2 dashboards on the same chart you must input a different name for each. The sca
FREE

SuperTrend Double Smoothed Overview SuperTrend Double Smoothed is a trend-following indicator for MetaTrader 5 designed to display market direction and dynamic trend levels using a smoothed SuperTrend methodology. The indicator combines a body-based SuperTrend calculation with ATR-based filtering to help reduce sensitivity to short-term market fluctuations. Features • Trend direction visualization • Dynamic trend line display • ATR-based filtering • Trend strength information • Closed-bar calcu
FREE

Price tells a story, but volume tells the truth. Volume Truth is a visual analysis tool that reads the relationship between price and volume to reveal what institutions are doing behind the move — accumulating, distributing, or stepping aside. It does not just plot volume bars; it interprets them. [b]The four price/volume states[/b] Price up + volume up = institutional accumulation (bullish conviction) Price up + volume down = weak rally, no conviction, prone to reverse Price down + volume up =
FREE
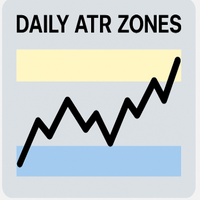
Daily ATR Zones – Precision Intraday Range Mapping Daily ATR Zones is a clear tool that plots intraday high/low targets using the Average True Range (ATR) of the previous days. These zones help traders anticipate potential price extremes , identify liquidity pockets , and define reversal or breakout levels — all based on objective volatility data. Key Features: Flat Zone Logic — Based on Open ± ATR , not bands around price
Custom Zone Thickness — Adjustable via ATR ratio ( ZoneHeightRatio )
FREE

Want to AUTOMATE this strategy? We have released the fully automated Expert Advisor based on this logic. Check out Range Vector Fibo Logic EA here: https://www.mql5.com/en/market/product/158065
UPGRADE AVAILABLE: Tired of manual trading? I just released the Automated MTF Version with Mobile Alerts and Auto-Targets. Get the Pro Version here: https://www.mql5.com/en/market/product/159350 Range Vector Fibo Logic (Indicator) One Candle Strategy Stop waking up at 3 AM to draw lines manually. Range
FREE
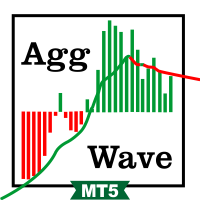
This indicator sums up the difference between the sells aggression and the buys aggression that occurred in each Candle, graphically plotting the waves of accumulation of the aggression volumes. Through these waves an exponential average is calculated that indicates the direction of the business flow.
Note: This indicator DOES NOT WORK for Brokers and/or Markets WITHOUT the type of aggression (BUY or SELL). Be sure to try our Professional version with configurable features and alerts: Agre
FREE
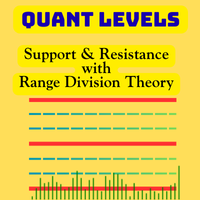
Quant Levels Indicator is a premium component of the Quantitative Trading Analysis Toolkit , designed to transform subjective trading into data-driven decision making. This advanced tool provides institutional-grade support and resistance analysis directly on your MT5 charts. " Please support our work by leaving a review ". As a thank-you gift , we’ll share a special template that helps you display signal trade history directly on your chart. Free indicator to visualize any MT5/MT4 signals i
FREE

Add Logo Watermark – Showcase Your Signals with Clarity This indicator allows you to display a clean and customizable watermark on your chart, helping your audience easily identify what symbol you're currently trading. Display the current symbol as a watermark
Add current symbol text and customize its color
Choose to show only the logo, only the symbol, or both
Add your own custom watermark by placing custom.bmp in the MQL5 > Files directory Perfect for signal providers, educators, and
FREE

Stochastic Signal Pro MTF – L'Indicateur Ultime pour des Signaux Précis et Multi-Timeframes ! Pourquoi Choisir Stochastic Signal Pro MTF ? Stochastic Signal Pro MTF est un indicateur professionnel et innovant conçu pour les traders qui recherchent des signaux fiables basés sur l'indicateur Stochastique, validés sur plusieurs timeframes . Que vous soyez un scalper, day trader ou swing trader , cet outil vous offre une analyse complète et visuelle pour prendre des décisions éclairées.
FREE

Bullish 3-Candle FVG Sell Indicator is a Smart Money Concepts (SMC) trading indicator designed to identify Bearish Sell Zones created after a Bullish Fair Value Gap (FVG) . The indicator automatically detects a valid Bullish FVG formed by three consecutive bullish candles , highlights the imbalance zone, and allows traders to use it as a potential SELL entry area when price retraces into the FVG. This indicator is intended for SELL trades only and is ideal for traders who follow ICT, SMC, instit
FREE
If you like this product, please give it a 5 star rating as a token of appreciation.
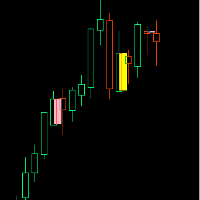
Inside Bar: A candle that is completely contained within the high-low range of the previous candle
Outside Bar: A candle that completely engulfs the high-low range of the previous candle (also called an "Engulfing Bar")
Inside Bars Consolidation Signals : Indicates market indecision/compression Breakout Setup : Often precedes significant price moves Continuation Patterns : Can signal pause in trend before con
FREE
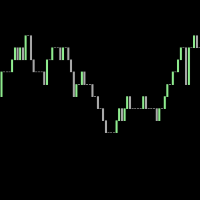
This is a tick indicator which compares the current bid price with the previous bid directly before it, and draws candles based on a comparison of the current ticks. It does not use historical ticks. Everything happens in real time, data moves from right to left, and the newest data arrives at the right. A trend line can be added which points in the direction of the price shifts.
FREE
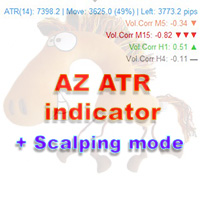
AZ ATR indicator (with volume correlation bonus)
Standard ATR indicator, you can enable ignoring abnormally large candles. It is possible to change the location of the displayed text in 4 corners of the chart. You can change the calculation period (days ago). Bonus - the indicator has a correlation with volumes. Can be enabled to display a possible priority at the current moment in the market.
What do the values mean: Positive correlation (0.3 - 1.0): 0.3-0.7 - moderate connection
FREE
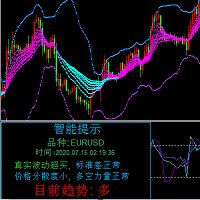
这是一个组合指标分析趋势、支撑阻力、买卖点。运用了均线MA、布林带、KDJ、CCI、RSI。 主图上下线是布林带上下线,采用的是20周期和2.3标准差可以用来支撑阻力。 中间的是分析趋势的均线,趋势分析是用均线多周期: 为涨趋势,反之为下跌趋势。在同一种颜色,基本说明趋势没有发生变化。 子图是由 KDJ、CCI、RSI三个指标组成,大于70超买,小于30超卖, 智能提示是运用了算法,主要计算布林带, KDJ、CCI、RSI指标
有三个或四个指标超出市场常态就会发出提示行情可能反转。 子图指标运用了很多数据,刚刚开始加载会有点慢,耐心等待就可以 这个指标是主图指标,还要再下我发布的RCD分析,这样就刚刚好组成一套分析 电脑分辨率的文本大小请设置100%,不然字体会不一样
FREE
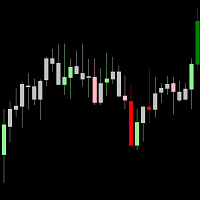
Candle com coloração de Volume Price Analysis (VPA) segundo as definições da Anna Coulling, é possível configurar períodos de climax e rising, fator de extreme e fator de rising.
Pode-se usar volume real ou volume de ticks. O VPA considera a variação de preço por volume do período, indicando se um movimento está recebendo ignição, está em seu climax ou se já não existe mais interesse.
FREE
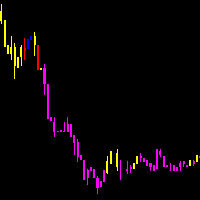
As médias coiote automatizam a leitura de analise de médias rápidas e lentas no saldo do volume e preço. Quando as médias estão em modo compra, a coloração do candle fica azul.
Quando as médias estão em modo venda, a coloração do candle fica magenta. Quando a coloração fica verde ou vermelho, temos a tomada das médias no volume mas não no preço, quando isso ocorre é um sinal de atenção.
A concepção do indicador é ser utilizado para operações em saída de consolidações na direção da tendencia do
FREE

the AK CAP toolbox free to use;
it includes the same indicators we use for our daily trading and we think the simpler the better. Lightweight indicator for use on all timeframes. that includes VWAP with vwap value indicator on top right. 3 EMA: FAST, MEDIUM, SLOW the candle timer to show how much time left in a candle.
colors and positions are fully customizable.
enjoy
FREE

This is a simple Orderblock alert indicator. it alerts you once it spots a bullish or bearish OB. what you choose to do with the alert, is left to you. Feel free to test on demo before use. (I'll be working on a combo i.e this and an EA working side by side, anticipate) Bullish OB has a light blue color and bearish has a light red color (rectangle box drawn on chart). Please trade wisely and don't forget to leave a positive review. thanks More blues to you, and Happy Trading!
FREE

LZ Multi-Timeframe Candle Timer displays the remaining time before the current bar closes for multiple timeframes simultaneously on a single dashboard. Monitor up to 9 timeframes (M1, M5, M15, M30, H1, H4, D1, W1, MN1) without switching charts. The indicator uses server time, updates every second, and is optimized for smooth display with minimal CPU use.
Feature highlights
- Multi-timeframe display: select which timeframes to show (M1 through MN1) via boolean inputs. Display only the interval
FREE

MSX SuperTrend Visual Indicator Overview MSX SuperTrend Visual Indicator is a MetaTrader 5 indicator designed to display trend direction and market structure using a SuperTrend-based calculation with optional filtering components. The indicator combines trend visualization, volatility measurement and optional EMA-based filtering to provide a clear graphical representation of market conditions. Features • SuperTrend-based trend visualization • ATR-based volatility calculation • Optional Heikin A
FREE

BrioQuant Position Monitor keeps your floating result where your eyes already are: beside the newest candle at the current price. Show this symbol's positions or the whole account, in cash and as a percentage of balance or equity, with optional entry lines and a per-position label for every open trade on the chart symbol. Features: - Floating readout rides the newest candle at current price height - no corner panel to glance away at - Scope: this symbol or the whole account; swap included or exc
FREE

Multi-timeframe trend and reversal indicator with closed-candle arrows, ATR trend bands, EMA, ADX and RSI confirmation, dashboard and alerts.
Overview
MultiTrend Sentinel is a MetaTrader 5 chart indicator for monitoring trend
direction and potential changes in direction. It combines an ATR-based trend
line with optional EMA and ADX filters, then checks two selectable confirmation
timeframes using EMA direction and optional RSI confirmation.
Signal arrows are confirmed on completed candles. Th
FREE

A simple indicator that displays current profit/loss in both USD and as a percentage of capital. It also shows the spread and a countdown timer for the current candle.
You can customize the display of profit/loss, spread, and the countdown timer by toggling them on or off.
Additionally, you can adjust their position—for example, placing them in the corners of the screen or right next to the BID/ASK prices.
I created this indicator for my own use and for my friends, so the display language is
FREE

Green Red Triple Overlap Candle by RWBTradeLab
Three candles of the same colour that go nowhere. A clean, non-repainting detector for MetaTrader 5 that finds the groups where one side keeps pushing and the other side keeps absorbing — and marks the exact band the group folded over. All from CLOSED candles only.
What This Indicator Does
The middle candle is the reference. Candle 1 and Candle 3 clamp its BODY from opposite ends, which is what stops the three of them from stepping away from eac
FREE

The indicator takes the last closed bar from three timeframes (daily, weekly, monthly) and draws Fibonacci levels based on the high and low prices of that bar. Depending on the opening and closing prices, the high and low are reversed. That is, if the candle is bullish, the low price is used as the starting price; otherwise, the high price is used. There's a second drawing option. Two opposing Fibonacci levels are drawn, each colored differently. Coincident levels and levels within the 0-100 ra
FREE
Live Trades and History Visualizer est un puissant indicateur MetaTrader 5 conçu pour aider les traders à suivre leurs positions ouvertes et fermées grâce à des repères visuels très clairs. Que vous surveilliez des transactions en direct ou analysiez des performances passées, cet outil fournit des affichages intuitifs et personnalisables des points d'entrée/de sortie, des profits/pertes et des statistiques de trading, directement sur votre graphique.
Caractéristiques principales :
Visualisez
FREE

Confluence Engine builds scored SMC confluence zones on your chart. Instead of showing one signal type, it clusters independent Smart Money signals — liquidity sweeps and institutional higher-timeframe levels — into price zones and tells you exactly how many factors coincide at each one.
This answers the question every SMC trader is really asking: how many independent signals agree on this level right now?
How it works:
Detects liquidity sweeps of prior swing highs/lows (wick pierce + body cl
FREE
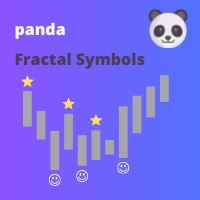
This indicator displays fractal symbols and bars Use this indicator to show different symbols for bearish and bullish fractals: Choose from 144 symbols (refer to table below) Colors, size and offset of fractals can be modified Fractal price bar or candle color can be changed Hide fractals and show fractal price bar only Frequency in fractal calculation can be changed
How to use 1. Select which symbols to use for bearish and bullish fractals; 2. Select which colors to use for bearish and bullis
FREE

Metis Hurst Regime — is the market trending, mean-reverting or just random? This indicator estimates the Hurst exponent of the recent price series — a statistical measure of memory. It tells you whether moves have tended to continue (trending), to reverse (mean-reverting) or to show no memory at all (random walk), and how much confidence that reading deserves. Knowing the current regime helps you choose the right kind of strategy: trend-following logic suffers in mean-reverting conditions and vi
FREE

Megatron Shark Indicator – MT5 Harmonic Pattern Detection Tool The Megatron Shark Indicator is a MetaTrader 5 tool for detecting and displaying Shark harmonic patterns directly on the chart. It automatically identifies bullish and bearish Shark formations, calculates entry, stop-loss, and take-profit levels, and provides real-time alerts. This allows traders to quickly integrate harmonic pattern analysis into their trading process without manual drawing. Advantages * Automatic Pattern Detection
FREE

WANT TO AUTOMATE THESE ZONES? Stop waiting for setups! The Smart SR Levels Sniper EA is now live. It reads these exact indicator zones, filters for high-probability "thin" zones , auto-calculates your risk , and targets the next SR levels for Take Profit . It can even scan all your open charts at once! Stop guessing where the market will turn. Let the volatility tell you. Smart SR Levels Sniper EA https://www.mql5.com/en/market/product/165191
LogicLadder SR Zones
------------------------
FREE
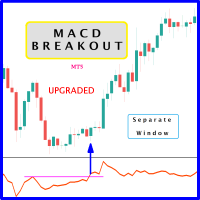
Il y a probablement une augmentation des prix lorsque MACD dépasse le niveau de résistance historique de l'oscillateur. Il est recommandé de vérifier la rupture du prix en comparant la rupture de l'oscillateur, car leurs effets sont similaires aux niveaux de support et de résistance de la rupture des prix ; les transactions à découvert auront probablement la même perception. Comme avantage, la cassure de l'oscillateur précède souvent la cassure du prix en tant qu'alerte précoce d'un événement à
FREE

RSI Condition:
The Relative Strength Index (RSI) for the current period is below a specified low threshold (RsiLow). This indicates oversold conditions. Candlestick Pattern:
It checks for a specific candlestick pattern across three consecutive candles: The current candle (1) closes higher than it opens (bullish) The previous candle (2) closes lower than it opens (bearish) The current candle's close is below the high of the previous candle Price Action:
The alert also checks that the current
FREE

Confluence Signal Engine (MT5 Indicator) A powerful multi-indicator confluence tool that analyzes market conditions using EMA trend, RSI, MACD, Stochastic, ADX, Bollinger Bands, Volume, and candlestick patterns to generate high-confidence trading signals. It filters trades using: Minimum indicator agreement (confluence) Market session quality Multi-timeframe confirmation Risk-to-reward validation (ATR-based SL/TP) The indicator provides: Real-time dashboard with signal strength (%) Early alerts
FREE

This indicator displays the remaining time of the current candle, providing a visual representation of the time left until the candle closes and a new one begins, helping traders to make more informed decisions and stay on top of market fluctuations with precise timing, enhancing their overall trading experience and strategy execution, and allowing them to optimize their trades and maximize their profits.
FREE
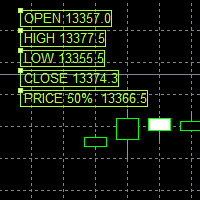
This Price indicator aid you to read prices of a bar without using native MT5 instuments like crosshair.
The indicator gives you the OPEN HIGH LOW CLOSE and 50% bar prices of the current or one of the previous bar.
Parameter setting are: TimeShift: Used for bar selection (0 stand for current 1 for previous 2 for 2 bars ago) Other parameter are using for esthetics. Each Label can be moved away from its initial position.
FEEL FREE TO REPORT BUG AND REVIEW THIS INDICATOR. THANKS
FREE

This is a multi frame stochastic indicator, you can attach any time frame of stoch indicator on one chart. It is very useful if you like to check multi time frame stoch data. If you are interested in EA,click below links to take a look: https://www.mql5.com/en/market/product/80170 https://www.mql5.com/en/market/product/81136
How to use: > Atach the first time frame you want on to the currency pair's chart > Atach the second time frame you want on to the currency pair's chart > Atach the third
FREE

RKbots EMA Crossover est un indicateur de suivi de tendance propre et professionnel, conçu pour MT5, optimisé pour les Indices Synthétiques Deriv et toutes les principales paires forex. Il trace une EMA Rapide et une EMA Lente directement sur le graphique et génère des signaux clairs d'achat () et de vente () à chaque croisement — sans repeindre, sans délai au-delà du calcul EMA lui-même. Fonctionnalités principales : Signaux visuels d'achat () et de vente () aux croisements EMA Périodes EMA
FREE
> Elevate Your Trading Strategy This free tool is just the beginning. At code4trading , we specialize in developing high-performance indicators and Expert Advisors designed for precision and professional-grade analysis. Looking for more advanced features? Discover our full suite of premium tools, including optimized signals, advanced oscillators, and institutional-grade trading utilities at our official MQL5 store. > Explore the full catalog here: https://www.mql5.com/en/users/pablogx9
FREE
The Hammer and Doji Scanner is a powerful technical analysis tool designed for MetaTrader platforms, such as MetaTrader 4 (MT4) and MetaTrader 5 (MT5), to detect and highlight key candlestick patterns, specifically the Hammer and Doji . These patterns are widely used by traders to identify potential trend reversals or periods of indecision in the market. Hammer: The Hammer is a bullish reversal candlestick pattern that appears after a downtrend. It is characterized by a small body near the top o
FREE
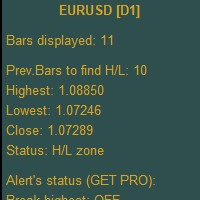
Higher Timeframe Chart Overlay will display higher timeframe candles, including the number of candles high/low you specify.
You no longer need to switch timeframes to check the candles. Everything can be shown in one chart. Get Full Version - https://www.mql5.com/en/market/product/115682 Please feel free Contact me if you have any questions regarding this tool.
FREE
Le MetaTrader Market offre un lieu pratique et sécurisé pour acheter des applications pour la plateforme MetaTrader. Téléchargez des versions démo gratuites de Expert Advisors et des indicateurs directement depuis votre terminal pour les tester dans le testeur de stratégie.
Testez les applications dans différents modes pour surveiller les performances et effectuez un paiement pour le produit que vous souhaitez en utilisant le système de paiement MQL5.community.

Vous manquez des opportunités de trading :
- Applications de trading gratuites
- Plus de 8 000 signaux à copier
- Actualités économiques pour explorer les marchés financiers
Inscription
Se connecter
Vous acceptez la politique du site Web et les conditions d'utilisation
Si vous n'avez pas de compte, veuillez vous inscrire