Owl Smart Levels MT5
- Indicadores
- Sergey Ermolov
- Versión: 2.15
- Actualizado: 29 enero 2024
- Activaciones: 10
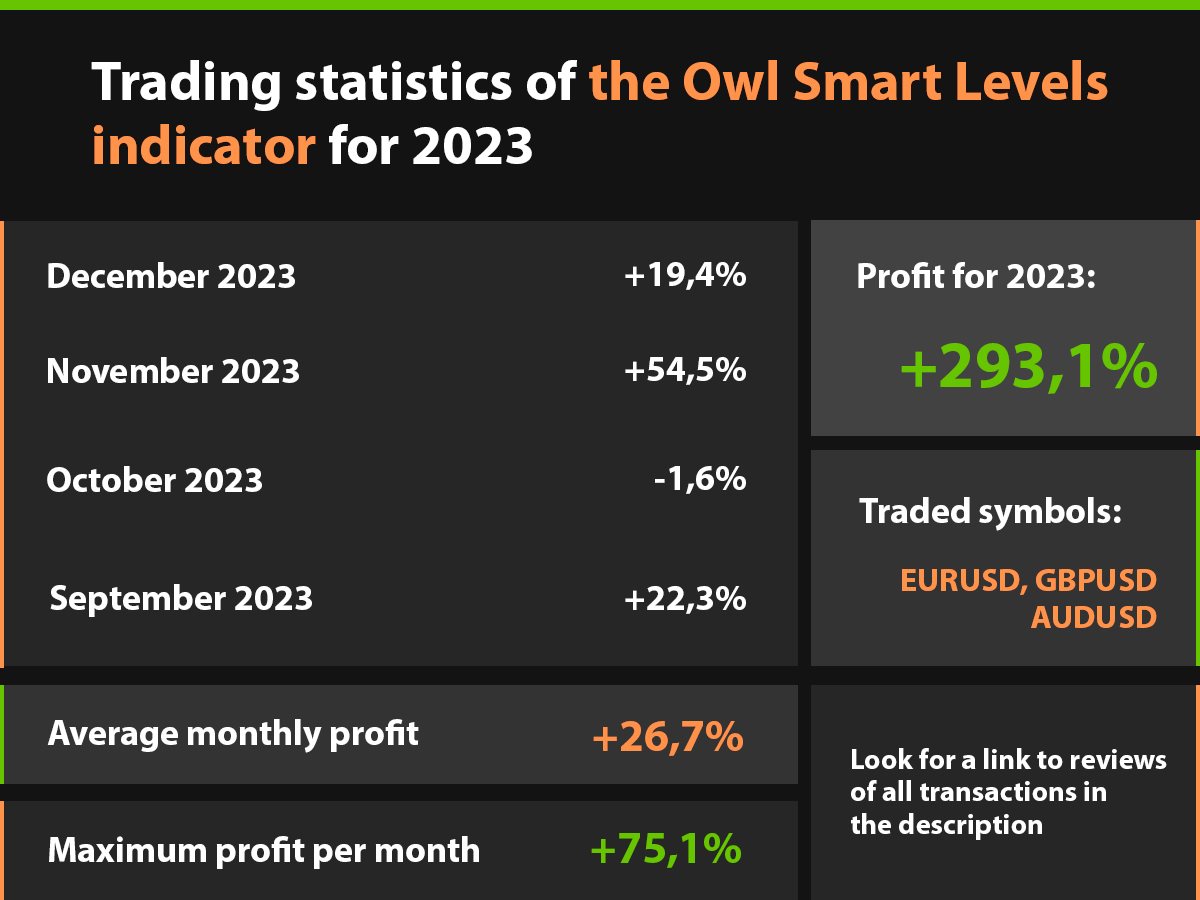
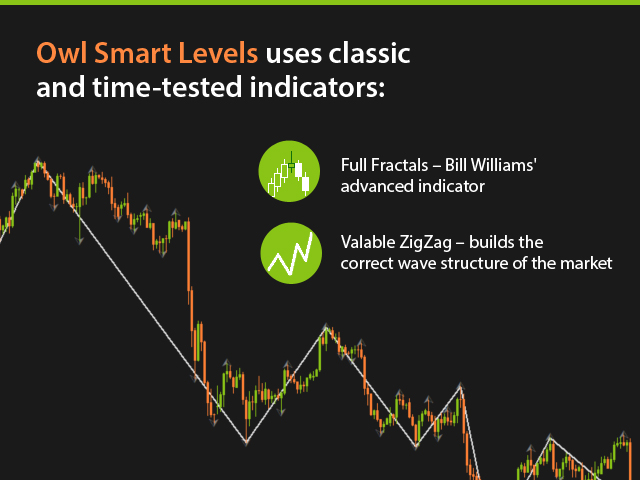
El Indicador Owl Smart Levels es un sistema comercial completo dentro de un indicador que incluye herramientas de análisis de mercado tan populares como los fractales avanzados de Bill Williams, Valable ZigZag que construye la estructura de onda correcta del mercado y los niveles de Fibonacci que marcan los niveles exactos de entrada. en el mercado y lugares para tomar ganancias.
- Descripción detallada de la estrategia
- Instrucciones para trabajar con el indicador
- Asesor de comercio Owl Helper
- Chat privado de usuarios
-> Envíame un correo electrónico después de la compra, te agregaré al chat privado y puedes descargar todos los Bonos allí
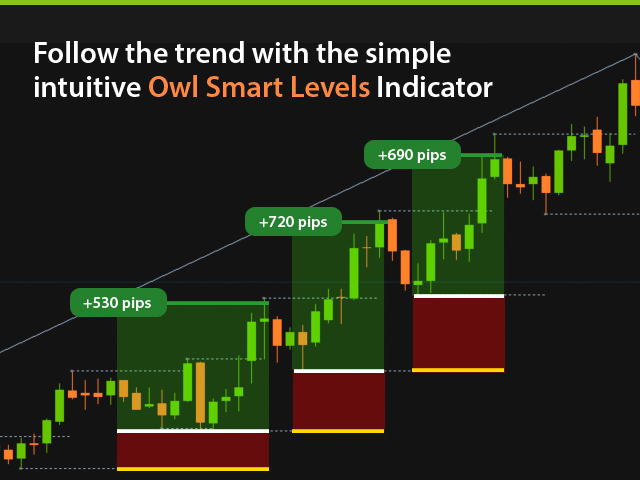
¡El poder está en la simplicidad!
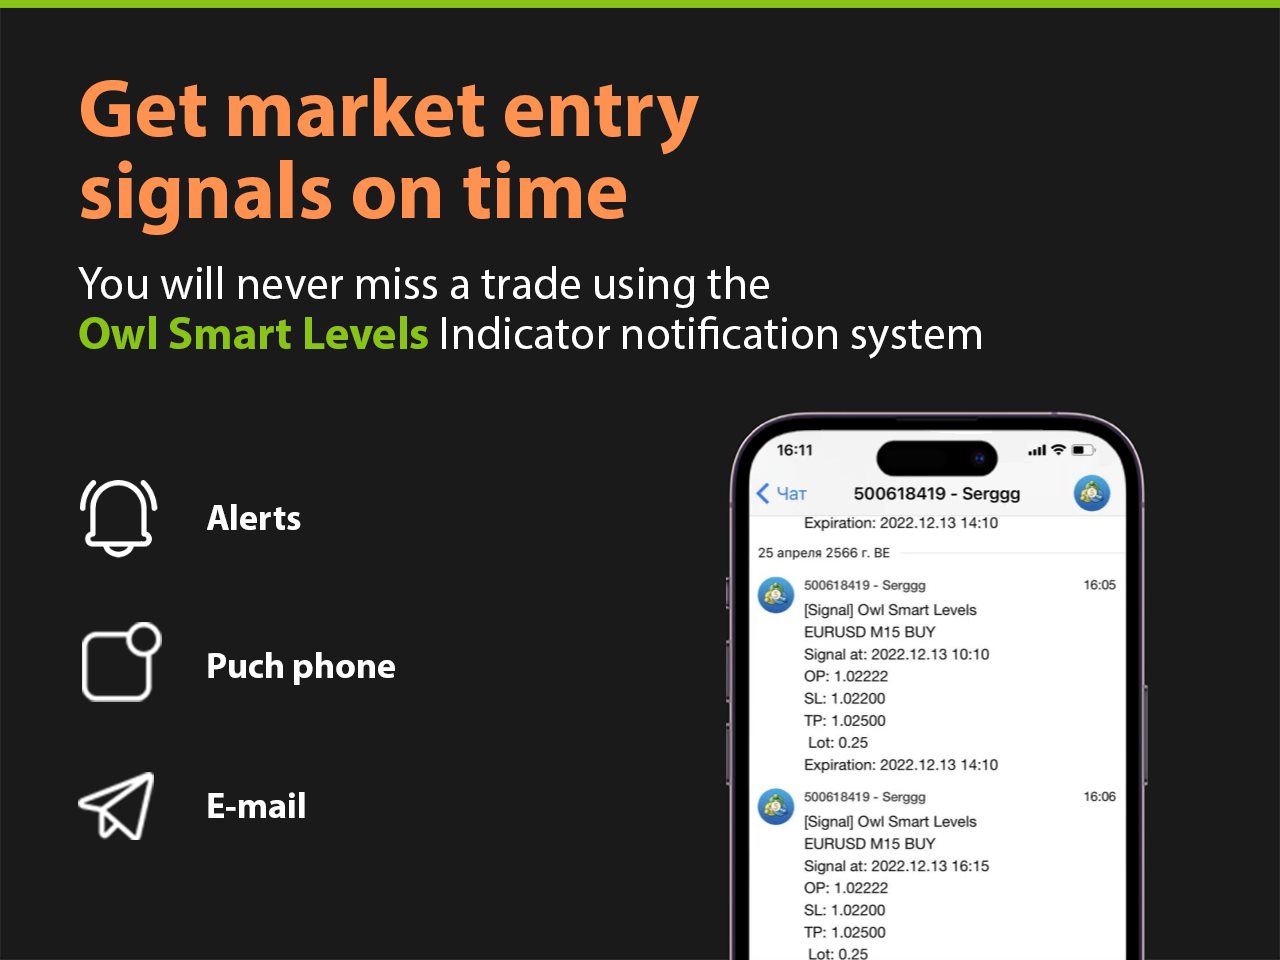
El sistema de negociación Owl Smart Levels es muy fácil de usar, por lo que es adecuado tanto para profesionales como para aquellos que recién comienzan a estudiar el mercado y elegir una estrategia comercial por sí mismos. No hay fórmulas secretas ni métodos de cálculo ocultos a la vista en la estrategia y el indicador, todos los indicadores de estrategia están disponibles públicamente. Owl Smart Levels le permite ver rápidamente la señal para ingresar a una operación, resalta los niveles para realizar un pedido y le envía una notificación sobre la señal que ha aparecido.
Las ventajas son obvias:
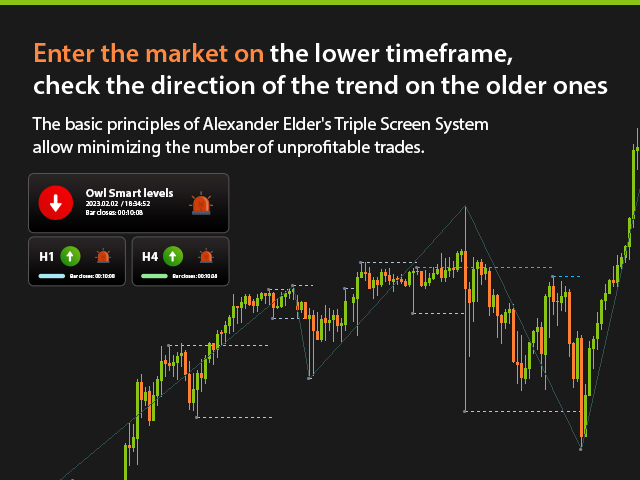
- Muestra claramente la dirección de la tendencia en el timeframe principal y superiores.
- Señala la aparición de una señal para el instrumento.
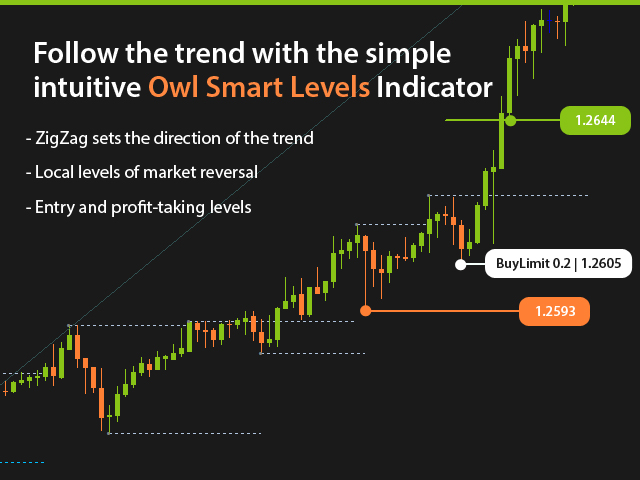
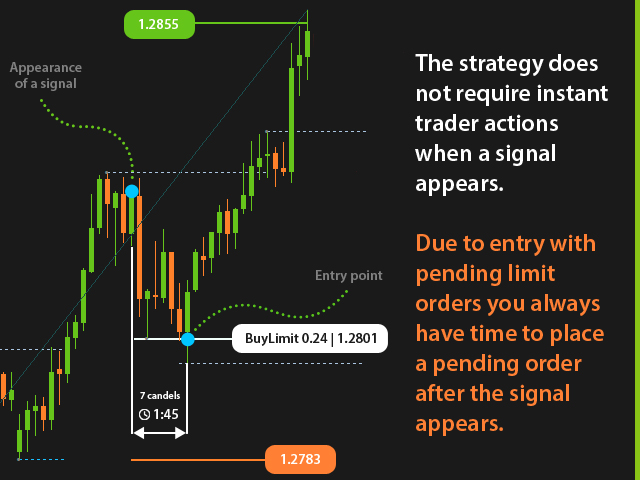
- Marca los niveles de apertura de órdenes, fijación de stop y fijación de beneficios.
¡Nada superfluo, solo los trazos necesarios!
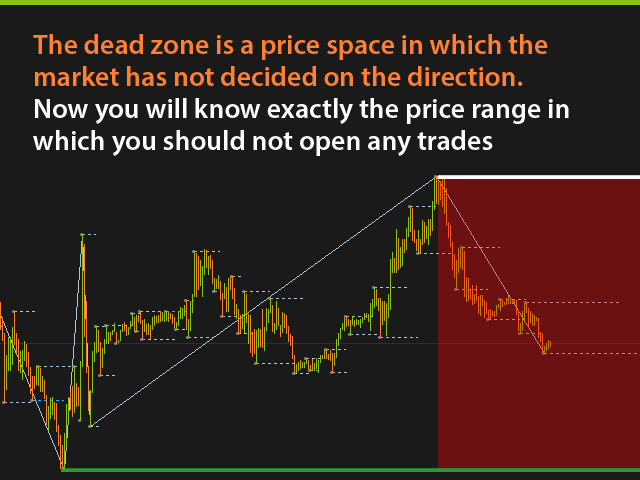
ZigZag muestra la dirección de la tendencia global y, por lo tanto, la dirección del comercio. Las líneas cortas de puntos de inversión del mercado dejan claro en qué niveles construir la cuadrícula de Fibonacci. Y los niveles mismos en los que debe abrir una posición y establecer StopLoss y TakeProfit. ¡Eso es todo lo que necesitamos ver en el gráfico!
Mira las revisiones comerciales semanales haciendo clic en el enlace >>
Solo hay 4 configuraciones más importantes que debe conocer:
- Candles on the left – determina el número de barras a la izquierda para construir un fractal.
- Candles on the right – determina el número de barras a la derecha para construir un fractal.
- Open price level – asigna el nivel de Fibonacci para determinar el punto de entrada al mercado.
- TakeProfit level – asigna el nivel de Fibonacci para establecer TakeProfit.
La mayoría de los indicadores solo muestran el historial de lo que ya sucedió en el mercado, y Owl Smart Levels recomienda seguir la tendencia global y sugiere entrar en correcciones locales.
Soy Sergei Ermolov, ¡sígueme para recibir actualizaciones!


To the point, common sense, easy to use indicator. Awesome!