Owl Smart Levels MT5
- インディケータ
- Sergey Ermolov
- バージョン: 2.15
- アップデート済み: 29 1月 2024
- アクティベーション: 10
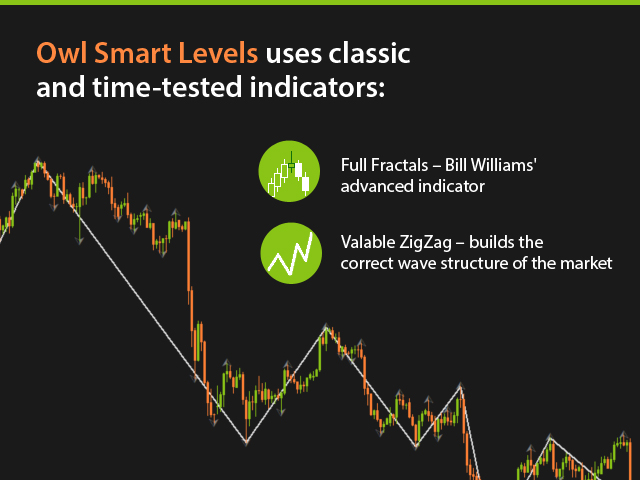
Owl Smart Levels Indicator は、Bill Williams の高度なフラクタル、市場の正しい波構造を構築する Valable ZigZag、エントリの正確なレベルをマークする Fibonacci レベルなどの一般的な市場分析ツールを含む 1 つのインジケーター内の完全な取引システムです。 利益を得るために市場と場所に。
- 戦略の詳細な説明
- インジケータを操作するための指示
- 顧問-取引助手
- プライベートユーザーチャット
->購入後に私に書いて、私はプライベートチャットにあなたを追加し、あなたはそこにすべてのボーナスをダウンロードすることができます
力はシンプルさにあります!
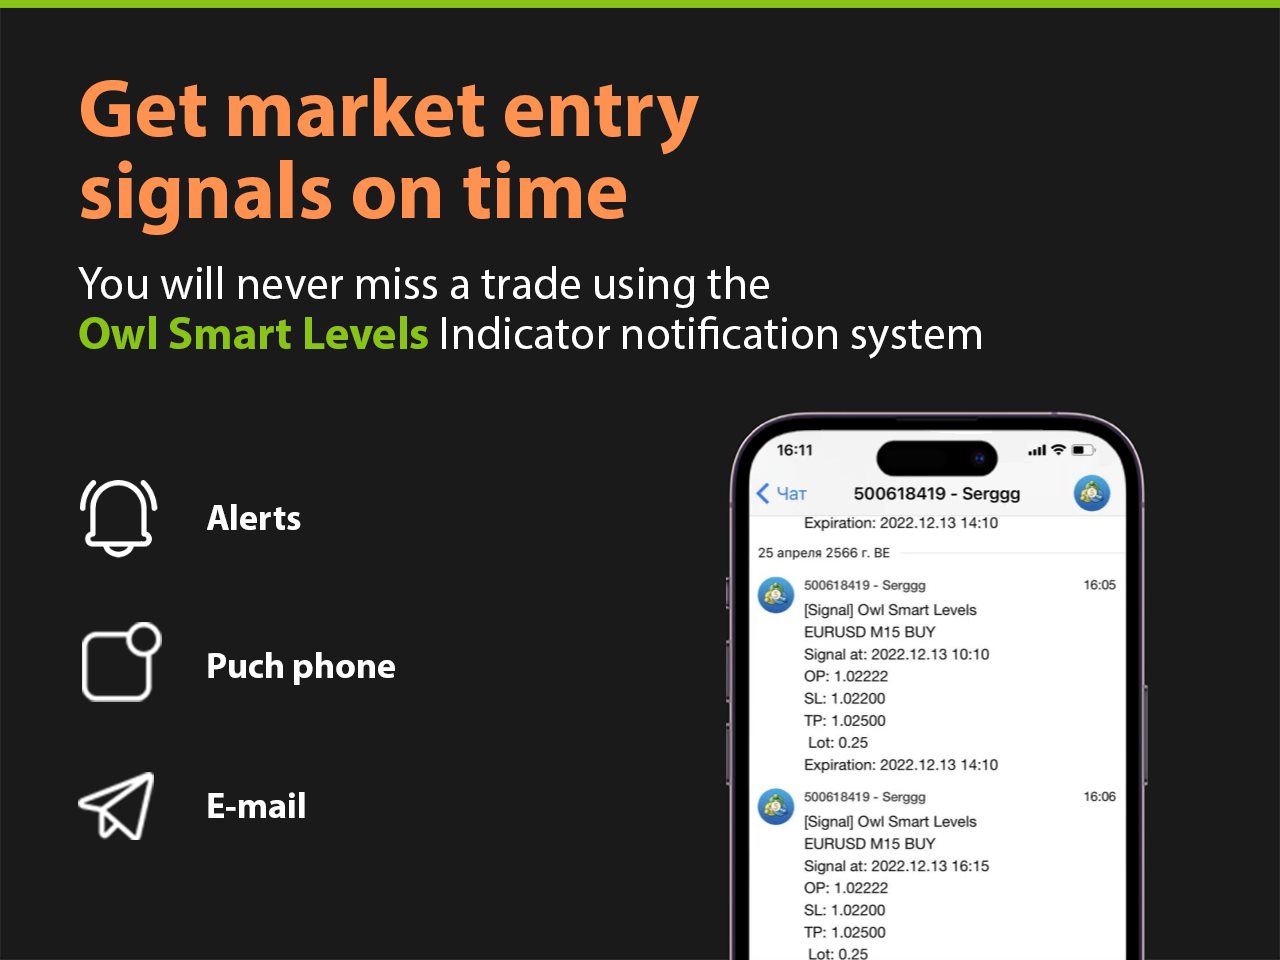
Owl Smart Levels 取引システムは非常に使いやすいので、専門家にも、市場を勉強し始めて自分で取引戦略を選択し始めたばかりの人にも適しています。 戦略と指標に秘密の数式や計算方法が隠されているわけではなく、すべての戦略指標は公開されています。 Owl Smart Levels を使用すると、取引を開始するためのシグナルをすばやく確認し、注文を出すためのレベルを強調表示し、出現したシグナルに関する通知を送信できます。
利点は明らかです。
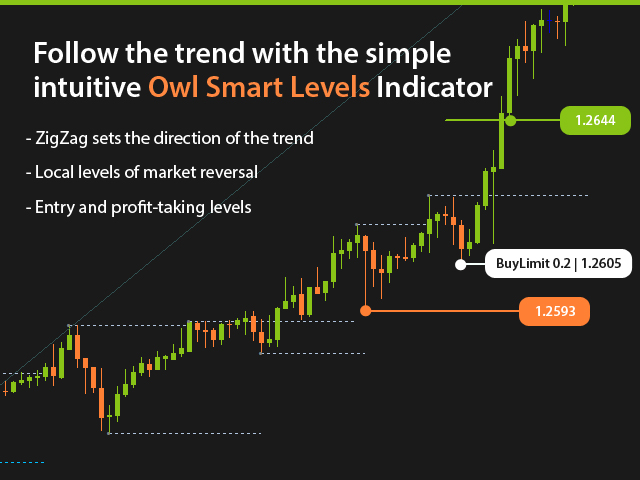
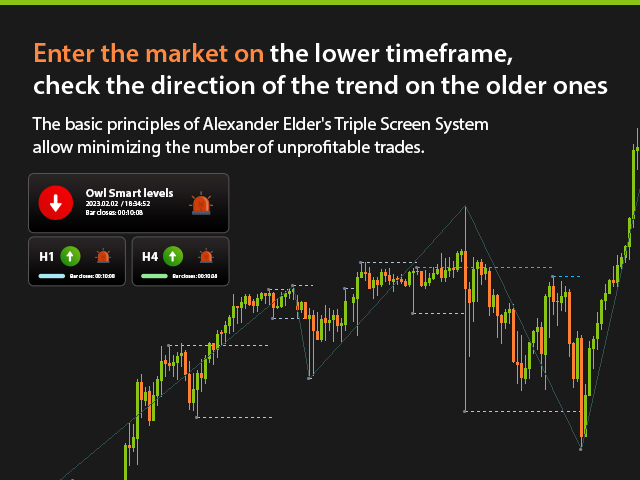
- メインと上位の時間軸でトレンドの方向を明確に表示します。
- 楽器の信号の出現を知らせます。
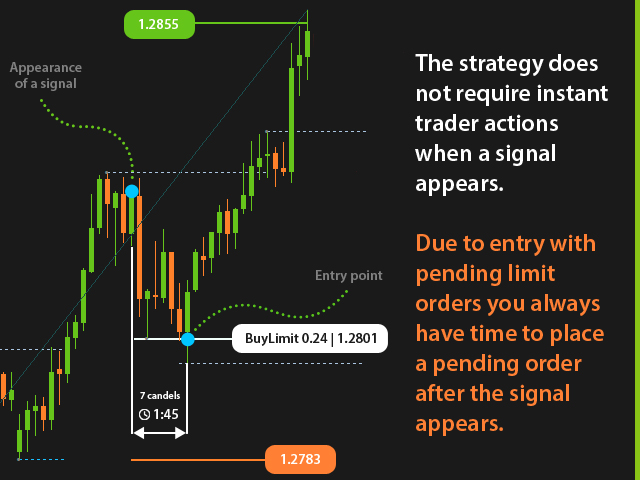
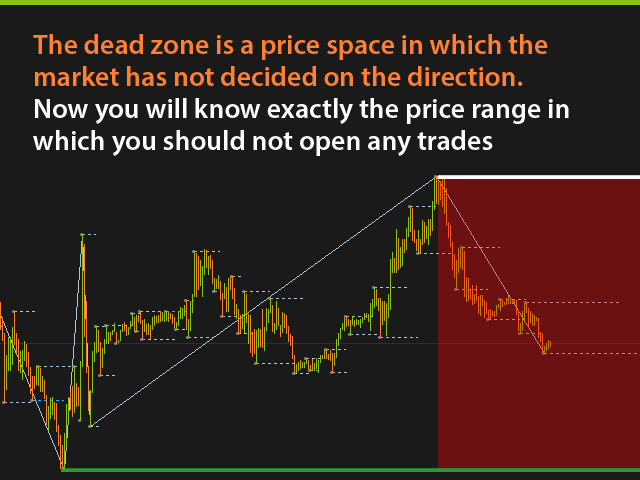
- 注文開始、ストップ設定、利益確定のレベルをマークします。
余分なものはなく、必要な構造だけです!
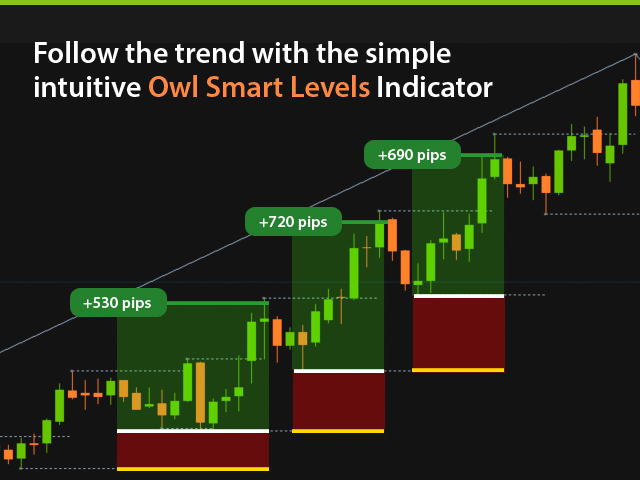
ZigZag は世界的なトレンドの方向、つまり貿易の方向を示します。 市場の反転ポイントの短い線は、フィボナッチ グリッドを構築するレベルを明確にします。 そして、ポジションを開いて StopLoss と TakeProfit を設定する必要があるレベル自体。チャートで確認する必要があるのはこれだけです!
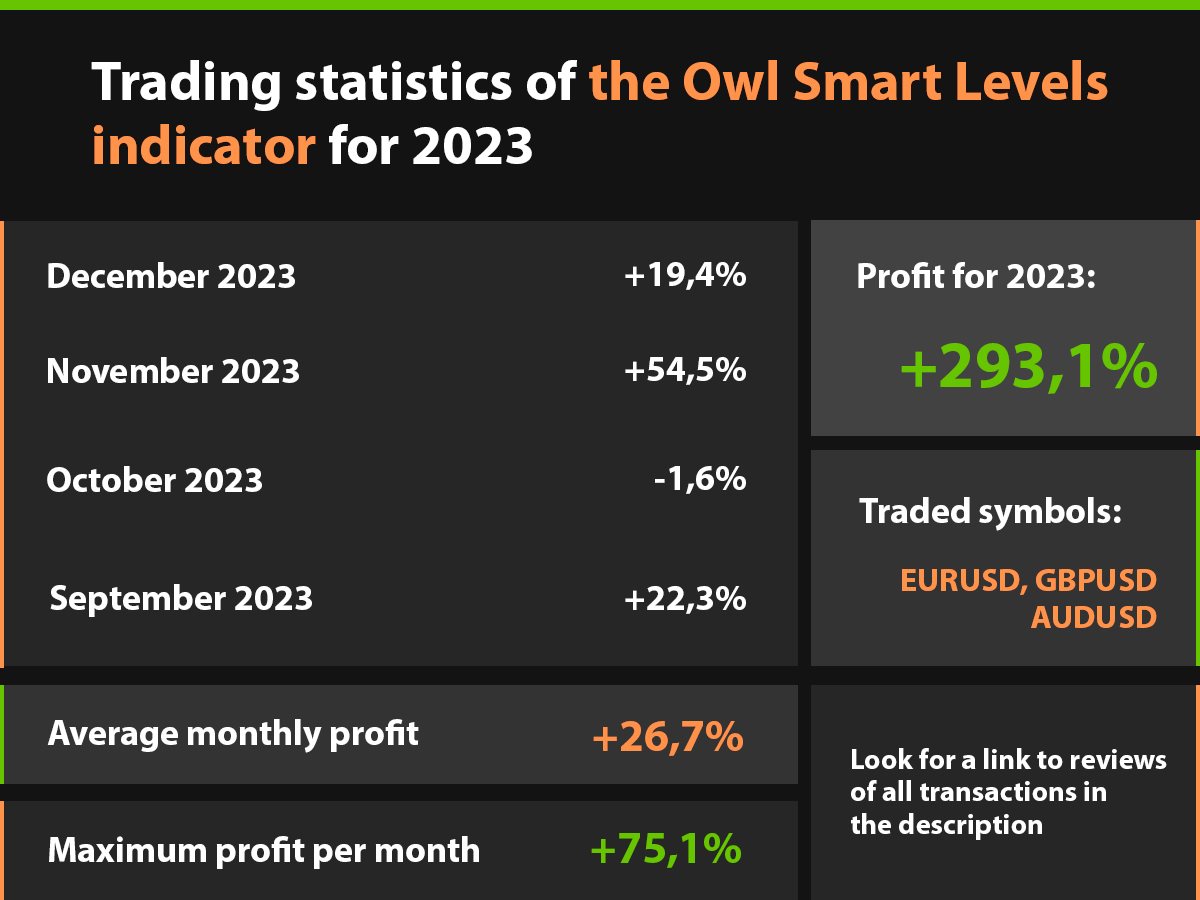
リンクをクリックすると、週間トレードレビューをご覧いただけます >> レビュー >>
知っておく必要がある最も重要な設定は 4 つだけです。
- Candles on the left – フラクタルを構築するために左側のバーの数を決定します。
- Candles on the right – フラクタルを構築する右側のバーの数を決定します。
- Open price level – フィボナッチ レベルを割り当てて、市場へのエントリ ポイントを決定します。
- TakeProfit level – TakeProfit を設定するためのフィボナッチ レベルを割り当てます。
ほとんどの指標は、市場ですでに起こったことの履歴のみを示しており、Owl Smart Levels は世界的なトレンドに従うことを推奨し、ローカルな調整を開始することを推奨しています。
私は Sergei Ermolov です。フォローして最新情報を入手してください。


i belive this guy hi i want to get the owl bonus