• Panoramica
  • Recensioni (8)
  • Commenti (8)
  • Novità

Owl Smart Levels MT5

5

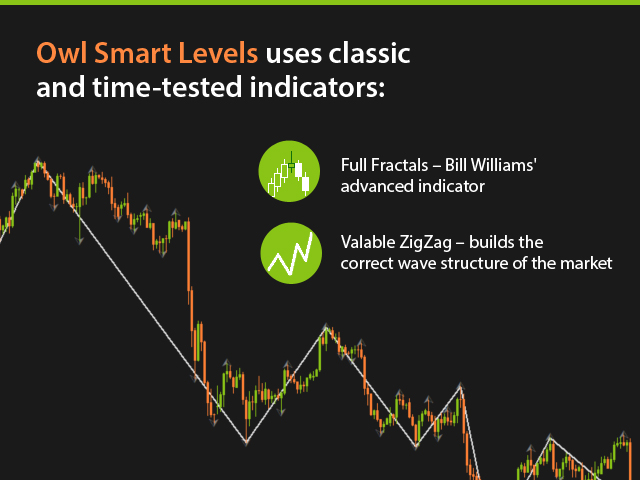
L'indicatore Owl Smart Levels è un sistema di trading completo all'interno dell'unico indicatore che include strumenti di analisi di mercato popolari come i frattali avanzati di Bill Williams, Valable ZigZag che costruisce la corretta struttura a onde del mercato, e i livelli di Fibonacci che segnano i livelli esatti di entrata nel mercato e luoghi per prendere profitti.

Per una descrizione dettagliata del sistema di trading, guardate l'articolo Owl Trend Strategy - Smart Levels.

Il potere è nella semplicità!

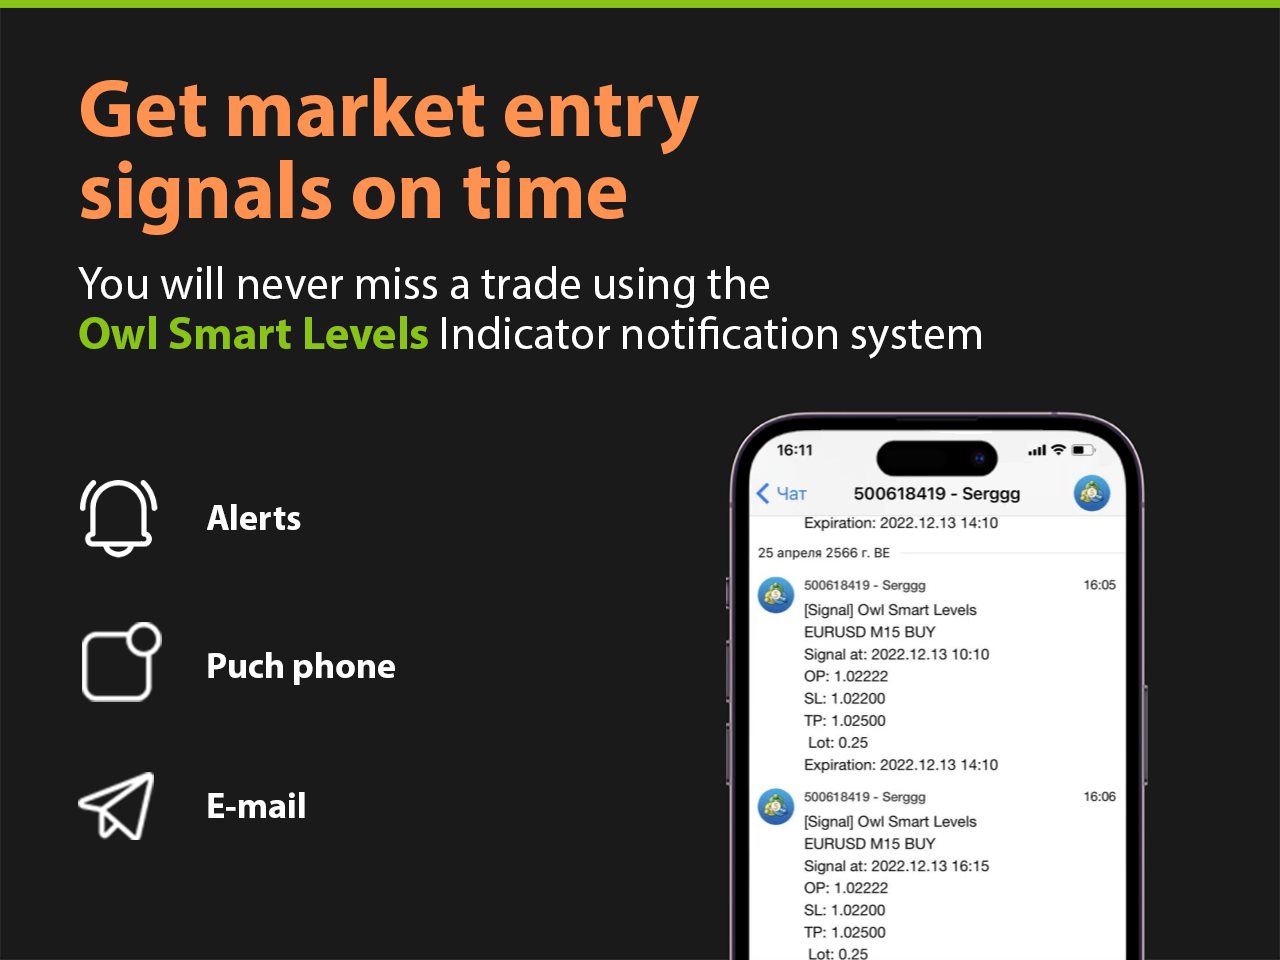
Il sistema di trading Owl Smart Levels è molto facile da usare, quindi è adatto sia ai professionisti che a coloro che stanno appena iniziando a studiare il mercato e scelgono una strategia di trading per se stessi. Non ci sono formule segrete e metodi di calcolo nascosti alla vista nella strategia e nell'indicatore, tutti gli indicatori di strategia sono disponibili pubblicamente. Owl Smart Levels ti consente di vedere rapidamente il segnale per entrare in un trade, evidenzia i livelli per effettuare un ordine e ti invia una notifica sul segnale che è apparso.

I vantaggi sono evidenti:

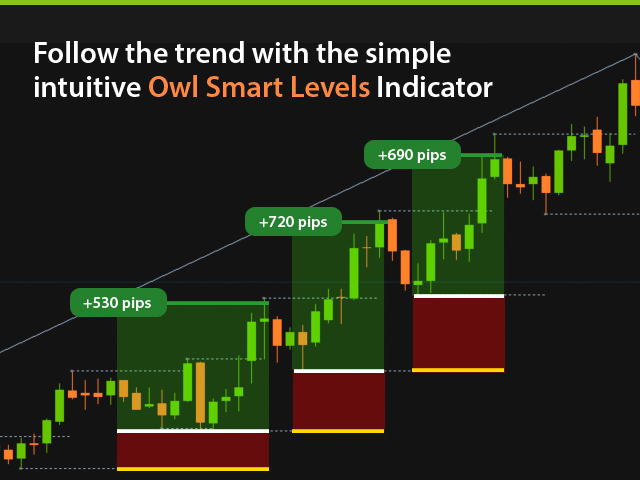
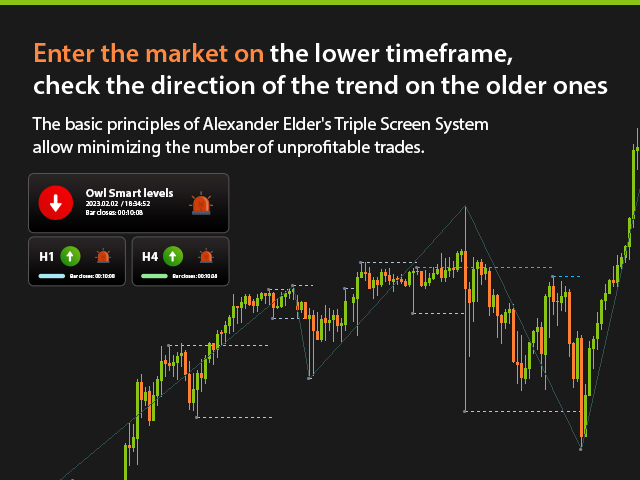
  • Mostra chiaramente la direzione del trend sul timeframe principale e superiori.
  • Segnala la comparsa di un segnale per lo strumento.
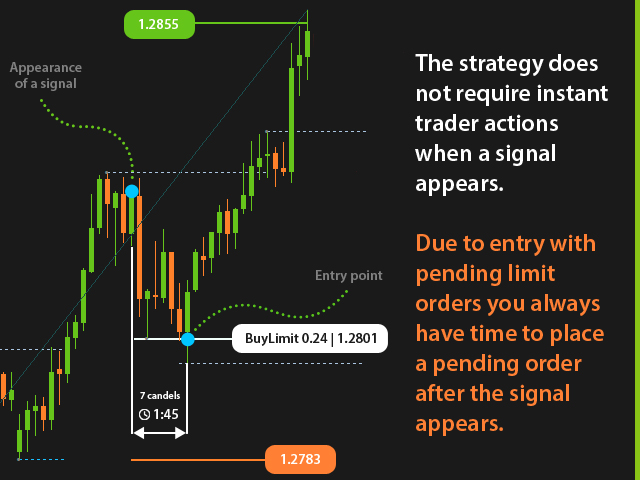
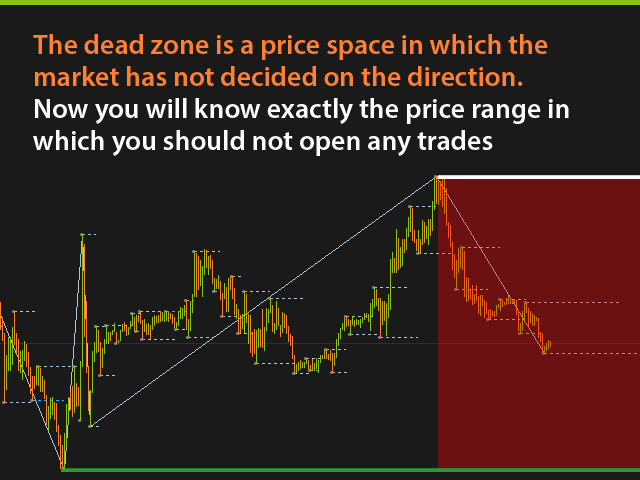
  • Segna i livelli di apertura dell'ordine, impostazione dello stop e fissazione del profitto.

Offerta speciale

  • Acquista l'indicatore Owl Smart Levels
  • Scrivi una recensione
  • Aggiungimi come amico

Ricevi gratis:

  • Consulente esperto ausiliario Owl Helper
  • Consulente esperto MiloBot PRO per 3 mesi GRATIS

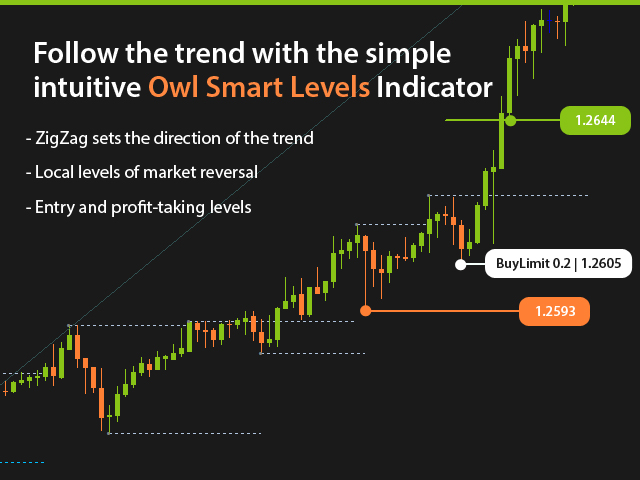
Niente di superfluo, solo i tracciati necessari!

ZigZag mostra la direzione della tendenza globale e, quindi, la direzione del commercio. Brevi linee di punti di inversione del mercato chiariscono a quali livelli costruire la griglia di Fibonacci. E i livelli stessi ai quali dovresti aprire una posizione e impostare StopLoss e TakeProfit. Questo è tutto ciò che dobbiamo vedere sul grafico!

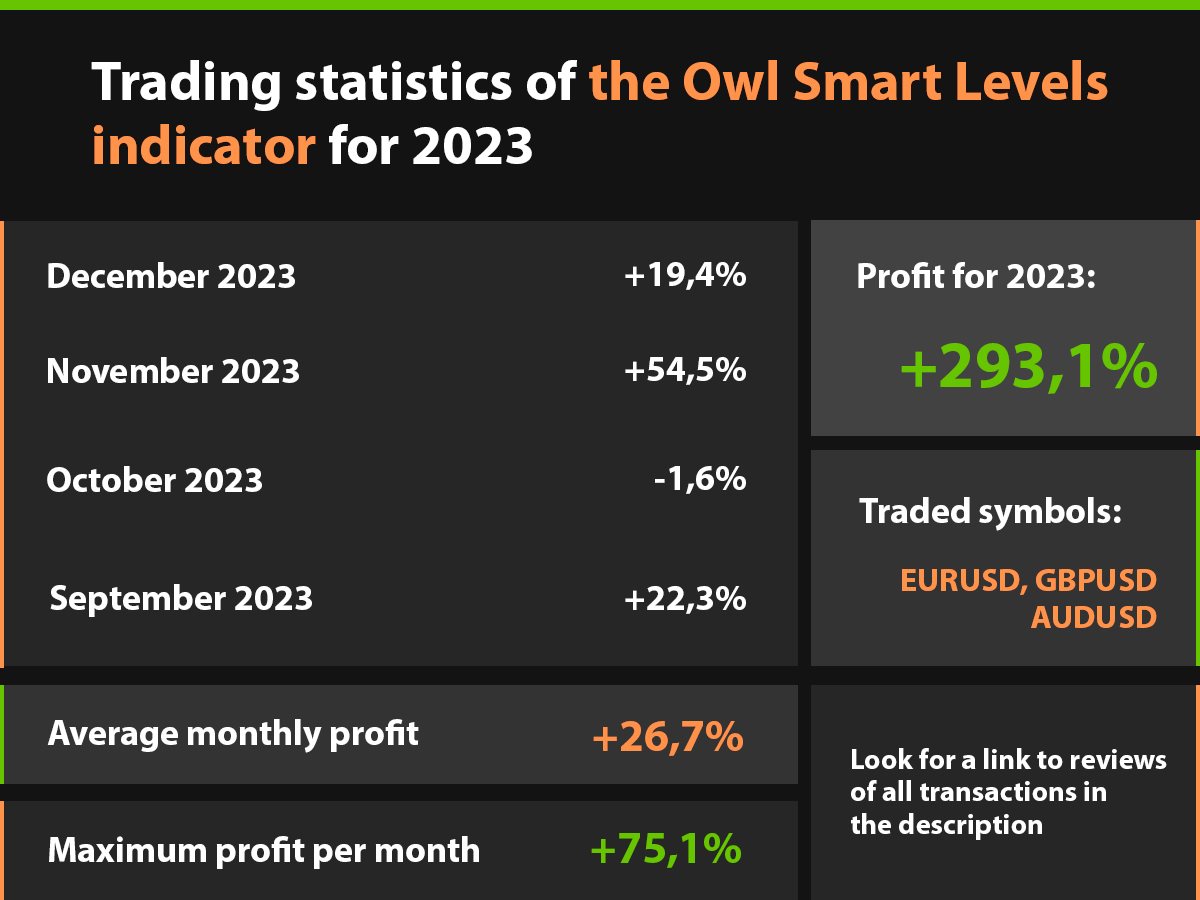
Guardate le revisioni dei trade settimanali cliccando sul link >>

Ci sono solo 4 impostazioni più importanti che devi conoscere:

  1. Candles on the left – determina il numero di barre a sinistra per costruire un frattale.
  2. Candles on the right  determina il numero di barre a destra per costruire un frattale.
  3. Open price level  assegna il livello di Fibonacci per determinare il punto di ingresso nel mercato.
  4. TakeProfit level  assegna il livello di Fibonacci per l'impostazione di TakeProfit.

La maggior parte degli indicatori mostra solo la storia di ciò che è già accaduto nel mercato, e Owl Smart Levels consiglia di seguire la tendenza globale e suggerisce di inserire correzioni locali.

Sono Sergei Ermolov, seguimi per gli aggiornamenti!


Recensioni 8
Thiranai Somjing
22
Thiranai Somjing 2023.05.25 13:07 
 

A nice and simple strategy to follow.

schulz2021
20
schulz2021 2023.05.24 11:09 
 

Excellent indicator. For me it is very easy to understand which trading rules are used. There is enough time to convert the signal into a trade. All markets and different trading activities are supported by different parameters.

manuelm3
43
manuelm3 2023.05.22 19:34 
 

Very good attention, it is a very interesting strategy, it is not a simple indicator, in principle highly recommended.

Prodotti consigliati
Elliott Wave Trend was designed for the scientific wave counting. This tool focuses to get rid of the vagueness of the classic Elliott Wave Counting using the guideline from the template and pattern approach. In doing so, firstly Elliott Wave Trend offers the template for your wave counting. Secondly, it offers Wave Structural Score to assist to identify accurate wave formation. It offers both impulse wave Structural Score and corrective wave Structure Score. Structural Score is the rating to sh
200 USD
WAPV Weis Wave Chart Forex
Eduardo Da Costa Custodio Santos
Il Weis Wave Chart Forex per MT5 è un indicatore di prezzo e volume. La lettura del prezzo e del volume è stata ampiamente diffusa tramite Richard Demille Wyckoff sulla base delle tre leggi da lui create: offerta e domanda, causa ed effetto e sforzo contro risultato. Già nel 1900 R.Wyckoff utilizzava la carta delle onde nelle sue analisi. Molti anni dopo, intorno al 1990, David Weis ha automatizzato il diagramma delle onde di R. Wyckoff e oggi vi portiamo l'evoluzione del diagramma delle onde di
100 USD
Follow The Line PRO MT5
Oliver Gideon Amofa Appiah
Follow The Line PRO   FOLLOW THE LINE (PRO VERSION) This powerful indicator is the full and complete version of my free indicator called "Follow The Line". IT IS BASED ON the popular maxim that: "THE TREND IS YOUR FRIEND" It gives alarms and alerts of all kinds. IT DOES NOT REPAINT and can be used for all currency pairs and timeframes. AVOID FALSE SIGNALS: BUY ONLY when price closes above the green line and the green line is above the blue channel. SELL ONLY when price closes below the pink
50 USD
Normalized Volume 99% of indicators are based on price analysis. This indicator is based on volume. Volume is overlooked piece of information in most trading systems. And this is a big mistake since volume gives important information about market participants. Normalized Volume is an indicator that can be used to confirm reversal points. The indicator code volume with colors indicating high, normal and low volume. You could enhance dramatically your trading system using volume analysis
97 USD
Gartley Projections D
Oleksandr Medviediev
3 (2)
The indicator identifies the harmonic patterns (XABCD) according to developments of H.M.Gartley ( "Profits in the Stock Market" , 1935г). It projects D-point as a point in the perspective projection (specify ProjectionD_Mode = true in the settings). Does not redraw. When a bar of the working timeframe closes, if the identified pattern point has not moved during Patterns_Fractal_Bars bars, an arrow appears on the chart (in the direction of the expected price movement). From this moment on, the ar
200 USD
The Fibonacci series.  This number sequence is formed as each subsequent number is a sum of the previous two. it turns out that it refers to its neighbors in the ratio 0.618 and 1.618 The most commonly used method for measuring and forecasting the length of the price movement is along the last wave, which ended in the opposite direction The Fibonacci Waves indicator could be used by traders to determine areas where they will wish to take profits in the next leg of an Up or Down trend.
40 USD
This indicator will detect harmonic patterns that are drawn on the chart by manual and automatic methods. You can see user manual from this link: https://www.mql5.com/en/blogs/post/719257 There is a free MT4 version to try this product. You can use it to detect Gartley and Nenstar patterns: https://www.mql5.com/en/market/product/30181 You can buy the full MT5 version from: https://www.mql5.com/en/market/product/70105 Notes Indicator has control panel and it will save every (chart & timeframe)
125 USD
Introduction to X3 Chart Pattern Scanner X3 Cherart Pattern Scanner is the non-repainting and non-lagging indicator detecting X3 chart patterns including Harmonic pattern, Elliott Wave pattern, X3 patterns, and Japanese Candlestick patterns. Historical patterns match with signal patterns. Hence, you can readily develop the solid trading strategy in your chart. More importantly, this superb pattern scanner can detect the optimal pattern of its kind. In addition, you can switch on and off individu
250 USD
What was IFM created for Our goal in creating IFM was to provide the tool to manage your Fibonacci Retrecements and other Fibo tools in MetaTrader 5. This indicator allows you to edit all of the settings without getting into it by right click on the tool. That is faster and easiest way to manage objects on your chart. Inputs Font size - change font size of texts on the IFM panel. This is necessary, because some of users change font size in Windows settings Description of the Fibo levels (varia
40 USD
Introduction to Chart Pattern MT Chart Pattern MT is a chart pattern scanner to detect the triangle pattern, falling wedge pattern, rising wedge pattern, channel pattern and so on. Chart Pattern MT uses highly sophisticated chart pattern detection algorithm. However, we have designed it in the easy to use with intuitive user interface. Chart Pattern MT will show all the patterns in your chart in the most efficient format for your trading. You do not have to do tedious manual pattern detection an
180 USD
BeST_Keltner Channels Strategies MT5   is an  MT5  Indicator based on the original Keltner Channels Indicator and it can display in the Chart all the known Variations of Keltner Channels and also the corresponding 10 totally Strategies. Every such generally consists of a Central Moving Average Line and two Boundary Bands at a distance above and below it and can be traded mainly in a Trending Mode but also in a Ranging ReEntry Mode.  BeST_Keltner Channels Strategies Indicator Draws definite Bu
35 USD
L'indicatore mostra modelli armonici sul grafico basati su Dynamic ZigZag (   https://www.mql5.com/en/market/product/5356   ) ed è quasi un analogo completo di una delle versioni del noto korHarmonics. L'indicatore riconosce i seguenti modelli e le loro varietà: ABCD, Gartley (Butterfly, Crab, Bat), 3Drives, 5-0, Batman, SHS, One2One, Camel, Triangles, WXY, Fibo e Vibrations. Per impostazione predefinita, nelle impostazioni è abilitata solo la visualizzazione dei modelli ABCD e Gartley. La linea
50 USD
Keltner Channel indicator for MT5
Renaud Herve Francois Candel
Keltner Channel Indicator Keltner Channel is an oscillator like Bollinger Bands. Keltner Channel is a very good tool to time entries for your strategy. Keltner Channel displays a channel where price is supposed to stay unless we are in overbought or oversold situations. Various strategies use Keltner Channel indicator successfully to spot overbought / oversold situations and look for reversals. Keltner Channel indicator uses ATR to determine overbought and oversold situations. Inputs of the
97 USD
This is arguably the most complete harmonic price formation auto-recognition indicator you can find for the MetaTrader Platform. It detects 19 different patterns, takes fibonacci projections as seriously as you do, displays the Potential Reversal Zone (PRZ) and finds suitable stop-loss and take-profit levels. [ Installation Guide | Update Guide | Troubleshooting | FAQ | All Products ] It detects 19 different harmonic price formations It plots primary, derived and complementary Fibonacci p
249 USD
Mean Volume indicator for MT5
Renaud Herve Francois Candel
Mean Volume Most indicators are based on price analysis. This indicator is based on volume. Volume is overlooked piece of information in most trading systems. And this is a big mistake since volume gives important information about market participants. Mean Volume is an indicator that can be used to spot when volume is above average. It usually means that institutional traders are active. Peak in volume can be used to confirm an entry since increased volume can sustain the move in one
97 USD
Introduction Harmonic Patterns are best used to predict potential turning point. Traditionally, Harmonic Pattern was identified manually connecting peaks and troughs points in the chart. Manual harmonic pattern detection is painfully tedious and not suitable for everyone. You are often exposed under subjective pattern identification with manual pattern detection. To avoid these limitations, Harmonic Pattern Plus was designed to automate your harmonic pattern detection process. The functionality
98 USD
An Ultimate Tool  for quick and efficient market analysis. Unique combination of solid indicators defining market direction for trend tracking and filtration designed for you to stay on the   right   side of the market. Market Rider Oscillators  gives you access to one of the most used from professional trades indicators on worldwide, which were not build in for MT4 and MT5 terminals . These are unique non-repainting oscillators designed to be used on all time frames for all instruments class
50 USD
How the day starts
Sergio Antoni Escudero Tirado
This indicator draws the high intraday price and the low intraday price of the first n minutes of the day. The chart shows the days with vertical lines and two horizontal lines to indicate the max and the min close price of the n first minutes of the day. The max/min lines start and end with the day calculated. With this indicator you can see how starts the day compared with the previous days. It is valid for any market inasmuch as the start time is calculated with the data received. Paramete
30 USD
DUCHOAN99 would like to send you the  indicator   ATR (Keltner) Channels Multi TF Real Value for MT5 . Please download the demo to see if the indicator helps you or not before deciding to buy this indicator. 1.   KEY TAKEAWAYS Keltner Channels are volatility-based bands that are placed on either side of an asset's price and can aid in determining the direction of a trend. The exponential moving average (EMA) of a Keltner Channel is typically 20 periods, although this can be adjusted if desired
30 USD
This dashboard shows the latest available  Harmonic Patterns  for selected symbols. Free Indicator :   Basic Harmonic Pattern MT4 Version Columns Symbol Trend   (Bullish/ Bearish) Pattern   Type (Gartley/ Butterfly/ Bat/ Crab) Entry  (Entry Price) SL   (Stop Loss Price) TP1   (1st Take Profit Price) TP2  (2nd Take Profit Price) TP3  (3rd Take Profit Price) Current   (Current Price) Age   (Age of pattern in Bars) Alert Settings   (Set an alert if a new pattern is found) You can sort the dashboa
99 USD
Il livello Premium è un indicatore unico con una precisione superiore all'80% delle previsioni corrette! Questo indicatore è stato testato dai migliori Specialisti di Trading per più di due mesi! L'indicatore dell'autore che non troverai da nessun'altra parte! Dagli screenshot puoi vedere di persona la precisione di questo strumento! 1 è ottimo per il trading di opzioni binarie con un tempo di scadenza di 1 candela. 2 funziona su tutte le coppie di valute, azioni, materie prime, cript
1 100 USD
Price Breakout pattern Scanner is the automatic scanner for traders and investors. It can detect following patterns automatically from your chart. Head and Shoulder - Common tradable pattern. Reverse Head and Shoulder - This pattern is the reverse formation of the Head and Shoulder. Double Top - When the price hits resistance level twice and decline toward the support level, the trader can anticipate sudden bearish breakout through the support level. Double Bottom - The double bottom pattern is
100 USD
TSO Bollinger Bandit Strategy is an indicator based on the Bollinger Bandit Trading Strategy as presented in the book Building Winning Trading Systems with TradeStation by G. Pruitt and J. R. Hill. SCANNER is included . Now with Scanner you can find trading opportunities and setups easily and faster.   Features A complete entry and exit strategy for trending markets. Get email / push notifications when an entry signal occurs. The indicator is not repainting. Can easily be used in an EA. (see F
69 USD
Elliott Wave Helper
Siarhei Vashchylka
4.8 (5)
Elliott Wave Helper - A panel for marking Elliott wave  and technical analysis. Wave Analysis: Allows you to build a wave analysis in a few clicks with the definition of the type and order of waves. - Choice of color, style and font of waves is available. - Marking of impulses, triangles, zigzags, flats, simple and complex combinations is available. Special wave font is supported. To activate it, you need to do the following: Download the font following the link: https://traderevolution.ru/upl
99 USD
FibTracer
Syed Oarasul Islam
FibTracer is an interactive Fibonacci tool that is aim to improve and facilitate your Fibonacci trading style. This Indicator can generate Fibonacci Retracement levels in two different ways. You can select whether to draw Fibonacci Retracement levels based on you favourite ZigZag settings or you can let the indicator to draw Fibonacci Retracement level based on given number of periods.  You can also set Mobile and Email notification for your favourite Retracement levels individually. With this i
60 USD
IndicateMe
Dani Cyril Bakkum
The IndicateMe indicator has been specially created to remove as much noise as possible from the signals it gives. The indicator has been combined with several other well-known indicators. Indicators  that have been used: "Moving average, stocastic indicator, relative strenght index, moving". All indicators that are used can be adjusted by yourself. The default settings are set to the values ​​I like to use. Easily set alerts to always stay informed of the indicator's signals. Important: thi
30 USD
"The Squeeze indicator attempts to identify periods of consolidation in a market. In general the market is either in a period of quiet consolidation or vertical price discovery. By identifying these calm periods, we have a better opportunity of getting into trades with the potential for larger moves. Once a market enters into a "squeeze," we watch the overall market momentum to help forecast the market direction and await a release of market energy." The Modified TTM Squeeze Indicator is a modi
149 USD
The indicator builds a dynamic regression channel with high accuracy without lagging. Channel deviation is calculated using a unique formula and displayed on the graph. Support:   https://www.mql5.com/en/channels/TrendHunter Can be used on any timeframe and any instrument. MT4-version: https://www.mql5.com/en/market/product/64252 Can be used as a ready-made trading system, as well as an addition to the existing one. Settings: Fast Period   - Fast smoothing period; Slow Period   - Slow s
35 USD
Incinerat8
Paulos Ngwenya
This algorithm uses real time data to generate signals with an accuracy rate of 80%. It shows entries and where you should place both the stoploss and the take profit for each trade. It determines trend! It can even help you to become a signal provider! And it can generate up to 8 signals a day! You get access to a free forex trading community  Operates on any broker compatible to synthetic indices and forex   if you need any assistance whatsapp +2774 35 35 744 or telegram link @pipsempire01
400 USD
Matreshka
Dimitr Trifonov
Matreshka self-testing and self-optimizing indicator: 1. Is an interpretation of the Elliott Wave Analysis Theory. 2. Based on the principle of the indicator type ZigZag, and the waves are based on the principle of interpretation of the theory of DeMark. 3. Filters waves in length and height. 4. Draws up to six levels of ZigZag at the same time, tracking waves of different orders. 5. Marks Pulsed and Recoil Waves. 6. Draws arrows to open positions 7. Draws three channels. 8. Notes support and re
245 USD
Gli utenti di questo prodotto hanno anche acquistato
Top indicator for MT5   providing accurate signals to enter a trade without repainting! It can be applied to any financial assets: forex, cryptocurrencies, metals, stocks, indices .  MT4 version is here It will provide pretty accurate trading signals and tell you when it's best to open a trade and close it. Watch  the video  (6:22) with an example of processing only one signal that paid off the indicator! Most traders improve their trading results during the first trading week with the help of
125 USD
TPA True Price Action indicator reveals the true price action of the market makers through 100% non-repainting signals strictly at the close of a candle! TPA shows entries and re-entries, every time the bulls are definitely stronger than the bears and vice versa. Not to confuse with red/green candles. The shift of power gets confirmed at the earliest stage and is ONE exit strategy of several. There are available now two free parts of the TPA User Guide for our customers. The first "The Basics"
168 USD
Blahtech Supply Demand MT5
Blahtech Limited
4.45 (11)
Supply Demand uses previous price action to identify potential imbalances between buyers and sellers. The key is to identify the better odds zones, not just the untouched ones. Blahtech Supply Demand indicator delivers functionality previously unavailable on any trading platform. This 4-in-1 indicator not only highlights the higher probability zones using a multi-criteria strength engine, but also combines it with multi-timeframe trend analysis, previously confirmed swings and engulfing detecto
99 USD
Market Profile defines a number of day types that can help the trader to determine market behaviour. A key feature is the Value Area, representing the range of price action where 70% of trading took place. Understanding the Value Area can give traders valuable insight into market direction and establish the higher odds trade. It is an excellent addition to any system you may be using. Blahtech Limited presents their Market Profile indicator for the MetaTrader community. Inspired by Jim Dalton’s
99 USD
XQ Indicator MT5
Marzena Maria Szmit
5 (1)
The signal conditions are a combination of three indicators, and XQ Forex Indicators only display  medium and long-term trends . The indicator's efficacy has been improved with the addition of a filter that blocks out false signals. The XQ Forex Indicator can be used on  FX pairs, CFDs, and Cryptocurrencies . There are two type of signals:  Buy or Sell and Big Long or Big Short It is possible to enable sending emails when a major trend-change signal is detected, as well as to display the alerts
179 USD
Advanced Supply Demand MT5
Bernhard Schweigert
4.36 (11)
La migliore soluzione per qualsiasi principiante o trader esperto! Questo indicatore è uno strumento di trading unico, di alta qualità e conveniente perché abbiamo incorporato una serie di funzionalità proprietarie e una nuova formula. Con questo aggiornamento, sarai in grado di mostrare fusi orari doppi. Non solo potrai mostrare una TF più alta, ma anche entrambe, la TF del grafico, PIÙ la TF più alta: SHOWING NESTED ZONES. Tutti i trader di domanda di offerta lo adoreranno. :) Informazioni imp
199 USD
MetaBands M5
Vahidreza Heidar Gholami
5 (2)
MetaBands uses powerful and unique algorithms to draw channels and detect trends so that it can provide traders with potential points for entering and exiting trades. It’s a channel indicator plus a powerful trend indicator. It includes different types of channels which can be merged to create new channels simply by using the input parameters. MetaBands uses all types of alerts to notify users about market events. Features Supports most of the channel algorithms Powerful trend detection algorith
129 USD
Introduction to EFW Analytics EFW Analytics was designed to accomplish the statement "We trade because there are regularities in the financial market". EFW Analytics is a set of tools designed to maximize your trading performance by capturing the repeating fractal geometry, known as the fifth regularity in the financial market. The functionality of EFW Analytics consists of three parts. Firstly, Equilibrium Fractal Wave Index is an exploratory tool to support your trading logic to choose which r
200 USD
Setups 9 Larry Williams
Luigi Nunes Labigalini
Buy and sell signals based on Larry Williams's exponential moving average strategies 9.1, 9.2, 9.3 and 9.4 for trend reversals and continuations. To understand the logic and how to trade the signals, please check: Setup 9.1:  https://www.mql5.com/pt/market/product/50986 Setup 9.2:  https://www.mql5.com/pt/market/product/52268 Setup 9.3:  https://www.mql5.com/pt/market/product/52269 Setup 9.4:  https://www.mql5.com/pt/market/product/52273 Notices:  - This indicator displays a lot of signals.
199 USD
Stargogs Spike Catcher
Lorenzo Edward Beukes
5 (6)
Stargogs Spike Catcher V3.11 This Indicator is Developed To milk the BOOM and CRASH indices . Send me Message if you need any help with the indicator.  CHECK OUT THE STARGOGS SPIKE CATCHER EA/ROBOT V3: CLICK HERE ALSO CHECK OUT SECOND TO NONEFX SPIKE CATCHER:   CLICK HERE STARGOGS SPIKE CATCHER V3.11 WHATS NEW! Brand New Strategy. This is the Indicator you need for 2023. The Indicator Gives you an Entry at a time when conditions are met and you should use TP & SL. New Trendline that changes col
100 USD
Introduction to Fractal Pattern Scanner Fractal Indicator refers to the technical indicator that makes use of the fractal geometry found in the financial market. Fractal Pattern Scanner is the advanced Fractal Indicator that brings the latest trading technology after the extensive research and development work in the fractal geometry in the financial market. The most important feature in Fractal Pattern Scanner is the ability to measure the turning point probability as well as the trend probabil
185 USD
Royal Scalping Indicator M5
Vahidreza Heidar Gholami
5 (8)
Royal Scalping Indicator is an advanced price adaptive indicator designed to generate high-quality trading signals. Built-in multi-timeframe and multi-currency capabilities make it even more powerful to have configurations based on different symbols and timeframes. This indicator is perfect for scalp trades as well as swing trades. Royal Scalping is not just an indicator, but a trading strategy itself. Features Price Adaptive Trend Detector Algorithm Multi-Timeframe and Multi-Currency Trend Low
149 USD
Royal Wave Pro M5
Vahidreza Heidar Gholami
5 (2)
Royal Wave is a Trend-Power oscillator which has been programmed to locate and signal low-risk entry and exit zones. Its core algorithm statistically analyzes the market and generates trading signals for overbought, oversold and low volatile areas. By using a well-designed alerting system, this indicator makes it easier to make proper decisions regarding where to enter and where to exit trades. Features Trend-Power Algorithm Low risk Entry Zones and Exit Zones Predictions for Overbought and Over
129 USD
PZ Trend Trading MT5
PZ TRADING SLU
3.67 (3)
Trend Trading is an indicator designed to profit as much as possible from trends taking place in the market, by timing pullbacks and breakouts. It finds trading opportunities by analyzing what the price is doing during established trends. [ Installation Guide | Update Guide | Troubleshooting | FAQ | All Products ] Trade financial markets with confidence and efficiency Profit from established trends without getting whipsawed Recognize profitable pullbacks, breakouts and early reversals The ind
175 USD
PZ Swing Trading MT5
PZ TRADING SLU
5 (4)
Swing Trading is the first indicator designed to detect swings in the direction of the trend and possible reversal swings. It uses the baseline swing trading approach, widely described in trading literature. The indicator studies several price and time vectors to track the aggregate trend direction and detects situations in which the market is oversold or overbought and ready to correct. [ Installation Guide | Update Guide | Troubleshooting | FAQ | All Products ] Profit for market swings with
175 USD
Point of Interest MT5
Scott Edward Merritt
What is a Point of Interest? Traders who follow Smart Money Concepts may call this a Liquidity Point, or areas pools of liquidity have been built up by retail traders for for Big Banks to target to create large price movements in the market. As we all know, retail traders that use outdated and unreliable methods of trading like using trendlines, support and resistance, RSI, MACD, and many others to place trades and put their stop losses at keys points in the market. The "Big Banks" know these me
99.99 USD
Short description : TAMA is, at its core, a novel method for correcting moving averages (MAs) during trends. | This usually also results in better smoothing and a significantly lower time delay (lag) of the MAs. | The indicator can additionally be used for price forecasts and band formation, also combined. | TAMA received an award from VTAD in 2022. | Honored with the VTAD Award 2022 (VTAD = Association of Technical Analysts Germany, German branch of IFTA).   Core Features : Classic MAs
99 USD
WAPV Full MT5
Eduardo Da Costa Custodio Santos
## Se non riesci a utilizzare la versione demo, ti preghiamo di contattarci tramite messaggio. ## Opera in modo professionale utilizzando WAPV Full ed essere in grado di tracciare dove sono i soldi dei grandi giocatori Immagina di avere tra le mani uno strumento che da solo fa la lettura dei principali attori del mercato, mostrando le migliori regioni di trading basato sull'analisi dei prezzi e dei volumi. WAPV Full è uno strumento completo, focalizzato al 100% sull'operatività di R. Wyckof
199 USD
ToolBox 360 is the swiss knife of all indicators. It is full packed with useful tools to help you with your trading. It can be used to find best entry and exit points and help you to decide if you should open a trade or not. It shows market trends, candlestick formations outside / inside bars and you can sett time based allerts. Main features: Time based Fibonacci lines Choose a start and end time and the indicator shows you Fibonacci lines within the selected time range including range high
399 USD
Tired of plotting support and resistance lines? This is a multi-timeframe indicator that detects and plots supports and resistance lines in the chart with the same precision as a human eye would. As price levels are tested over time and its importance increases, the lines become thicker and darker, making price leves easy to glance and evaluate. [ Installation Guide | Update Guide | Troubleshooting | FAQ | All Products ] Boost your technical analysis Customizable timeframe selection Read pri
125 USD
Introduction to Harmonic Pattern Scenario Planner The present state of Forex market can go through many different possible price paths to reach its future destination. Future is dynamic. Therefore, planning your trade with possible future scenario is an important step for your success. To meet such a powerful concept, we introduce the Harmonic Pattern Scenario Planner, the first predictive Harmonic Pattern Tool in the world among its kind. Main Features Predicting future patterns for scenari
100 USD
MTF Supply Demand Zones MT5
Georgios Kalomoiropoulos
Nuova generazione di zone di domanda e offerta automatizzate. Algoritmo nuovo e innovativo che funziona su qualsiasi grafico. Tutte le zone vengono create dinamicamente in base all'azione dei prezzi del mercato. DUE TIPI DI AVVISI --> 1) QUANDO IL PREZZO RAGGIUNGE UNA ZONA 2) QUANDO SI FORMA UNA NUOVA ZONA Non ottieni un altro indicatore inutile. Ottieni una strategia di trading completa con risultati comprovati.     Nuove caratteristiche:     Avvisi quando il prezzo raggiunge
149 USD
Automated Trendlines MT5
Georgios Kalomoiropoulos
Le linee di tendenza sono lo strumento più essenziale di analisi tecnica nel forex trading. Sfortunatamente, la maggior parte dei trader non li disegna correttamente. L'indicatore automatizzato delle linee di tendenza è uno strumento professionale per i trader seri che ti aiuta a visualizzare il movimento di tendenza dei mercati. Esistono due tipi di linee di tendenza, linee di tendenza rialziste e linee di tendenza ribassiste. Nella tendenza rialzista, la linea di tendenza Forex viene t
99 USD
Price Action Finder MT5
Siarhei Vashchylka
5 (9)
The Price Action finder indicator displays Price action patterns on the price chart. Pattern List: Pin Bar (Pin) Outside bar (OB) Inside bar (IB) PPR Force bar The hanged man (HM) Inverted hammer (HR) Filter For novice traders, in the new version of the indicator, we have added a trend filter taken from Elder's Three Screens system. Now it can be enabled in the external parameters of the indicator. The trend filter is configured for each price range separately. External parameters: FB  -  Dis
99 USD
Volume by Price MT5
Brian Collard
5 (2)
The Volume by Price Indicator for MetaTrader 5 features Volume Profile and Market Profile TPO (Time Price Opportunity). Get valuable insights out of currencies, equities and commodities data. Gain an edge trading financial markets. Volume and TPO histogram bar, line and metric charts. TPO letter and block marker charts including split structures. Positioning and styling options to suit the user's needs and context. Volume Profile and Market Profile TPO Point of Control (VPOC and TPOC), Imbalanc
179.95 USD
Buy and Sell Alerts when price breaks out following strict price action. Sends Alerts – #On MT5 To Your Phone To Your Email Does not repaint . Works on any Forex pair, any timeframe. 10 Activations allowed so you are free from limitations >> MT4 Version Here Description When the indicator detects a possible trade, it sends you an alert. It shows you where to place your trade and even suggests Stop Loss and Take Profits for you. How To Trade With The Breakout Entry Signals Indicator
297 USD
IVISTscalp5
Vadym Zhukovskyi
We present you the iVISTscalp5 indicator, which is not only unique, but also effective in the analysis of trading operations. This indicator is based on time data and is the result of many years of experience and deep analysis of financial markets. The iVISTscalp5 indicator is an excellent assistant for manual trading. Convenience, simplicity and visualization. All the most difficult is hidden inside. We have simplified the settings and use of the iVISTscalp5 indicator as much as possible. The i
500 USD
AI Forecast MT5
Leonardo Antonio Camacaro Armas
Discover our extraordinary AI-powered Metatrader 4 indicator, designed to provide you with accurate forecasts on the price reaction of a financial asset based on a specific level! Our product guides you through three simple steps to obtain reliable results and make informed decisions: ️   Step 1:   The user selects the entry level and the two possible outcomes (Take Profit and Stop Loss) and clicks on calculate. In an instant, the full potential of the indicator is unleashed. ️   Step 2:
100 USD
The Quantum VPOC indicator has been developed to expand the two dimensional study of volume and price, to a three dimensional one which embraces time. The volume/price/time relationship then provides real insight to the inner workings of the market and the heartbeat of sentiment and risk which drives the price action accordingly. The Quantum VPOC indicator displays several key pieces of information on the chart as follows: Volume Profile - this appears as a histogram of volume on the vertical pr
197 USD
Introducing the POWER TRADE indicator created by a small group of traders with a few years trading trading the financial market profitably . This is a plug and play indicator that provides you with  POWERFUL Entry signals with Profit Taking and rebound zones. The indicator Works with all MT5 trading instruments. The indicator uses previous  chart data as receipt to speculate on future market moves.
150 USD
Altri dall’autore
Owl smart levels
Sergey Ermolov
4.79 (19)
Guida per l'indicatore   |   Strategia Owl Smart Levels  |  Versione MT5  |  Come installare?  | FAQ L' indicatore Owl Smart Levels   è un sistema di trading completo all'interno dell'unico indicatore che include strumenti di analisi di mercato popolari come i   frattali avanzati di Bill Williams , Valable ZigZag che costruisce   la corretta struttura a onde   del mercato, e i   livelli di Fibonacci che segnano i livelli esatti di entrata nel mercato e luoghi per prendere profitti. Per una desc
97 USD
Universal Breakout MT5
Sergey Ermolov
4.5 (16)
Impostazioni e rapporti |  Versione MT4  |  Indicatore di sessione di trading Universal Box   |  Come installare?  |   FAQ Universal Breakout  questo è un consulente commerciale sulla classica strategia di ripartizione della fascia di prezzo. Può essere configurato per qualsiasi strategia che implichi l'uscita del prezzo dal corridoio dei prezzi, che è specificato da un intervallo di tempo. Ad esempio: una ripartizione degli estremi delle sessioni di trading asiatiche, europee o Americane, una
FREE
Valable ZigZag MT5
Sergey Ermolov
5 (6)
Versione MT4  | Indicatore Trend Monitor VZ  |   Indicatore Owl Smart Levels   |  Strategia Owl Smart Levels  |  Come installare?   |   FAQ La teoria delle onde di Elliott è un'interpretazione dei processi nei mercati finanziari che si basa su un modello visivo delle onde nei grafici dei Prezzi. L'indicatore ZigZag Valable mostra la struttura delle onde del mercato su cui puoi fare affidamento per prendere decisioni di trading. L'indicatore ZigZag Valable è più stabile e spesso non cambia direz
FREE
Universal Breakout
Sergey Ermolov
4.88 (24)
Impostazioni e rapporti |  Versione MT5  |  Indicatore di sessione di trading Universal Box |  Come installare?  |  FAQ Universal Breakout  questo è un consulente commerciale sulla classica strategia di ripartizione della fascia di prezzo. Può essere configurato per qualsiasi strategia che implichi l'uscita del prezzo dal corridoio dei prezzi, che è specificato da un intervallo di tempo.   Ad esempio: una ripartizione degli estremi delle sessioni di trading asiatiche, europee o Americane, una r
FREE
MiloBot PRO MT5
Sergey Ermolov
5 (2)
Backtest dal 2015 | Versione MT4  |  Come installare?  |  FAQ MiloBot PRO   è un Forex Expert Advisor basato sulla   strategia dell'autore , sviluppata, testata e ottimizzata per oltre 2 anni. I conti reali dello sviluppatore possono essere considerati un indicatore dell'affidabilità della strategia. I loro   depositi   superano i 100.000 dollari . La strategia algoritmica   avanzata di MiloBot PRO consente di   ottenere un profitto stabile   ogni mese. Inoltre,   gli indicatori personalizzati
197 USD
Grid Hlevel MT5
Sergey Ermolov
5 (2)
Versione MT4  |   Indicatore Valable ZigZag   |  Come installare?  |   FAQ L'Expert Advisor   Grid HLevel   è perfetto per i trader che vogliono ottenere un profitto stabile sul mercato Forex ogni mese. L'Expert Advisor funziona secondo la strategia di mediazione e vi consiglio di usarla correttamente. Usarla "correttamente" significa aprire operazioni di mediazione nei punti di inversione del mercato e operare solo nella direzione di un trend globale. Per quanto riguarda la direzione del trend
FREE
Full Fractals MT5
Sergey Ermolov
4.73 (11)
MT4 version  |   Indicatore Owl Smart Levels   |  Strategia Owl Smart Levels  |  Come installare?   |   FAQ L'indicatore Fractals   è uno degli elementi della strategia di trading dell'autore di   Bill Williams . Viene utilizzato per cercare i punti di inversione del prezzo sul grafico dei prezzi e, di conseguenza, i livelli di supporto e resistenza. L'indicatore Full Fractals   è un Fractals migliorato che è disponibile nel toolkit di quasi tutti i terminali di trading. La sua unica differen
FREE
MiloBot PRO
Sergey Ermolov
5 (2)
Backtest dal 2015 |  Versione MT5  |   Come installare?  |   FAQ MiloBot PRO è un Forex Expert Advisor basato sulla strategia dell'autore , sviluppata, testata e ottimizzata per oltre 2 anni. I conti reali dello sviluppatore possono essere considerati un indicatore dell'affidabilità della strategia. I loro depositi superano i 100.000 dollari . La strategia algoritmica avanzata di MiloBot PRO consente di ottenere un profitto stabile ogni mese. Inoltre, gli indicatori personalizzati consentono ag
197 USD
Full Fractals
Sergey Ermolov
4.67 (6)
MT5 version  |   Indicatore Owl Smart Levels  |  Strategia Owl Smart Levels  |  Come installare?   |   FAQ L'indicatore Fractals è uno degli elementi della strategia di trading dell'autore di Bill Williams . Viene utilizzato per cercare i punti di inversione del prezzo sul grafico dei prezzi e, di conseguenza, i livelli di supporto e resistenza. L'indicatore Full Fractals è un Fractals migliorato che è disponibile nel toolkit di quasi tutti i terminali di trading. La sua unica differenza è che
FREE
Shuttle Runner
Sergey Ermolov
4.55 (11)
La strategia swing è la base del consulente Shuttle Runner . La strategia è stata descritta nel lontano 2009 ed è stata attivamente utilizzata dai trader nel mercato Forex. Shuttle runner è una versione migliorata e migliorata di questa strategia . Consigli di trading per la settimana in corso qui Fai domande nella chat qui L'essenza principale della strategia è la seguente: Il trading di questo consulente è  solo nelle fasi attive del mercato . E sappiamo che il mercato è attivo durante la ses
FREE
Universal Box MT5
Sergey Ermolov
5 (3)
Versione MT4   |  Come installare?  |   FAQ   |   EA Universal Breakout   Universal Box   traccia sul grafico   gli intervalli di prezzo   che possono essere utilizzati in seguito per fare trading sul breakout di un intervallo di prezzo. Sono molte le strategie che si possono applicare a questo indicatore. L'indicatore è impostato di default per segnare sul grafico gli intervalli delle   sessioni di trading Asiatica, Europea e Americana . Gli intervalli sono tracciati come rettangoli, i cui con
FREE
Valable ZigZag
Sergey Ermolov
4.4 (5)
Versione MT5 | Indicatore Trend Monitor VZ  |  Indicatore Owl Smart Levels   |  Strategia Owl Smart Levels  |  Come installare?   |   FAQ La teoria delle onde di Elliott   è un'interpretazione dei processi nei mercati finanziari che si basa su un modello visivo delle onde nei grafici dei Prezzi.   L'indicatore ZigZag Valable   mostra la struttura delle onde del mercato su cui puoi fare affidamento per prendere decisioni di trading. L'indicatore ZigZag Valable è più stabile e spesso non cambia d
FREE
Grid HLevel
Sergey Ermolov
4.33 (18)
Versione MT5  |   Indicatore Valable ZigZag   |  Come installare?  |   FAQ L'Expert Advisor Grid HLevel è perfetto per i trader che vogliono ottenere un profitto stabile sul mercato Forex ogni mese. L'Expert Advisor funziona secondo la strategia di mediazione e vi consiglio di usarla correttamente. Usarla "correttamente" significa aprire operazioni di mediazione nei punti di inversione del mercato e operare solo nella direzione di un trend globale. Per quanto riguarda la direzione del trend pri
FREE
Universal Box
Sergey Ermolov
5 (1)
Versione MT5   |  Come installare?  |   FAQ   |   EA Universal Breakout   Universal Box traccia sul grafico gli intervalli di prezzo che possono essere utilizzati in seguito per fare trading sul breakout di un intervallo di prezzo. Sono molte le strategie che si possono applicare a questo indicatore. L'indicatore è impostato di default per segnare sul grafico gli intervalli delle sessioni di trading Asiatica, Europea e Americana . Gli intervalli sono tracciati come rettangoli, i cui confini son
FREE
Trend Monitor VZ
Sergey Ermolov
5 (3)
Versione MT5   | Indicatore Valable ZigZag |  Come installare?  |   FAQ La teoria delle onde di Elliott è un'interpretazione dei processi dei mercati finanziari che si basa sul modello visivo delle onde sui grafici dei prezzi. Secondo questa teoria, possiamo sapere esattamente quale tendenza sta prevalendo sul mercato, ascendente o discendente. L'indicatore Valable ZigZag mostra la struttura a onde del mercato e indica la direzione del trend principale al momento sul timeframe corrente. Per com
49 USD
Safety
Sergey Ermolov
4.67 (3)
Penso che tutti conoscano una regola di gestione del denaro come "Sicuro". Per coloro che non lo sanno, safe comporta la chiusura di metà della posizione dopo che i profitti dell'operazione sono stati livellati alla dimensione del piede. Quindi, anche se il prezzo si gira e si blocca, non perderai più denaro, perché esattamente lo stesso margine di profitto è stato ottenuto quando una parte della posizione è stata chiusa in precedenza. Safety Advisor ha solo un'impostazione: il lotto di chius
FREE
Trend Monitor VZ MT5
Sergey Ermolov
5 (1)
Versione MT4   |   Indicatore Valable ZigZag   |  Come installare?  |   FAQ La teoria delle onde di Elliott   è un'interpretazione dei processi dei mercati finanziari che si basa sul modello visivo delle onde sui grafici dei prezzi. Secondo questa teoria, possiamo sapere esattamente quale tendenza sta prevalendo sul mercato, ascendente o discendente .   L'indicatore Valable ZigZag   mostra   la struttura a onde del mercato   e indica la direzione del trend principale al momento sul timeframe co
49 USD
Filtro:
Thiranai Somjing
22
Thiranai Somjing 2023.05.25 13:07 
 

A nice and simple strategy to follow.

brentbust3
30
brentbust3 2023.05.24 20:53 
 

I love mechanical strategies, this is awesome!

schulz2021
20
schulz2021 2023.05.24 11:09 
 

Excellent indicator. For me it is very easy to understand which trading rules are used. There is enough time to convert the signal into a trade. All markets and different trading activities are supported by different parameters.

manuelm3
43
manuelm3 2023.05.22 19:34 
 

Very good attention, it is a very interesting strategy, it is not a simple indicator, in principle highly recommended.

watju
40
watju 2023.05.09 16:20 
 

Well thought out and comprehensive full strategy. The best thing about it is the corrections it makes, it's constantly evolving and modifying position entries for the best possible result. It's easy to follow and does not overwhelm you. Sergey has put his effort behind this and continues to do so with weekly reviews of the trades on his mql5 blog (not a single losing week). Do yourself a favor and try this out, it'll be worth it...

Enrico Wnendt
882
Enrico Wnendt 2023.04.11 09:12 
 

OWL is not a indicator, its a full strategy. I love it. Its a mechanical strategy without guessing. I like the weekly recaps of his trades, so I can compare with my trades. What I like 1) profitable strategy 2) pending trades - no stress to get in immediately or to miss the trade. No need to sit 24/7 in front of the chart 3) indicator and trade settings are explained and will be shown on the chart 4) you can scale the number of trades up/down (other timeframe and/or more/less pairs) 5) honest basic indicators (zigzag + fractals)

Downsides: you will often miss a trade or close it while it pends resp. is open. This means you have to actively manage your trades

Marcello Catalini
75
Marcello Catalini 2023.04.06 09:56 
 

Buon indicatore, seguite le indicazioni dell'autore. Mi piace perché non ha misteriosi "algoritmi segreti", integra bene indicatori conosciuti in modo chiaro.

Станислав Касьянов
82
 

Хороший индикатор, уже получил первую прибыльную сделку

Rispondi alla recensione
Versione 2.5 2023.04.27
- Il codice dell'indicatore contiene le condizioni del manuale. Ora la maggior parte delle condizioni dall'istruzione indicatore si gestisce
- Configurato per lavorare con OWL Helper
Versione 2.4 2023.04.13
Aggiunte nuove notifiche su: rimozione degli ordini in sospeso, chiusura dell'affare
Versione 2.3 2023.03.02
Aggiunto avviso e-mail
Versione 2.2 2023.02.23
- nuova interfaccia user-friendly
- nuova tecnica di calcolo
- sistema di notifica aggiornato
- sistema di segnale più visivo