Owl Smart Levels MT5
- 指标
- Sergey Ermolov
- 版本: 2.15
- 更新: 29 一月 2024
- 激活: 10
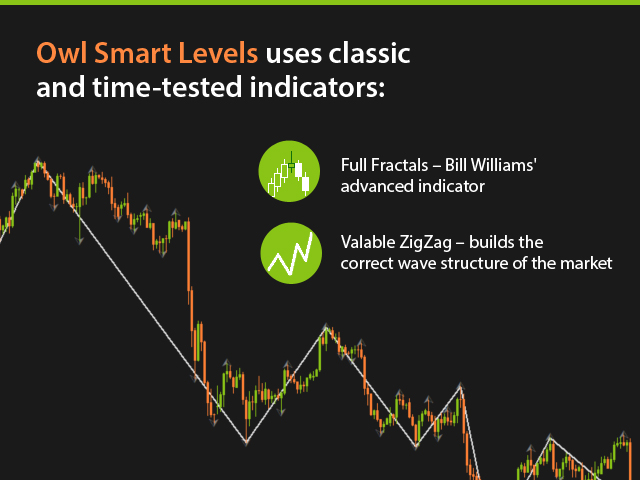
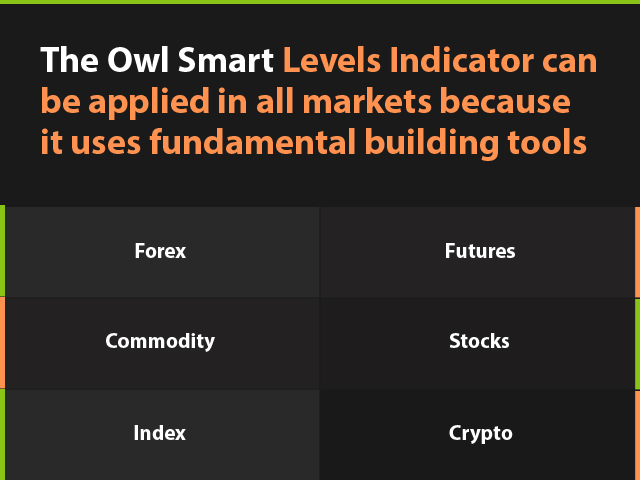
Owl Smart Levels Indicator 是一個完整的交易系統,包含 Bill Williams 的高級分形、構建正確的市場波浪結構的 Valable ZigZag 以及標記準確入場水平的斐波那契水平等流行的市場分析工具 進入市場和地方獲利。
- 策略的详细说明
- 指示灯使用说明
- 顾问-贸易猫头鹰助手助理
- 私人用户聊天
->购买后写信给我,我会将您添加到私人聊天中,您可以在那里下载所有奖金
力量在於簡單!
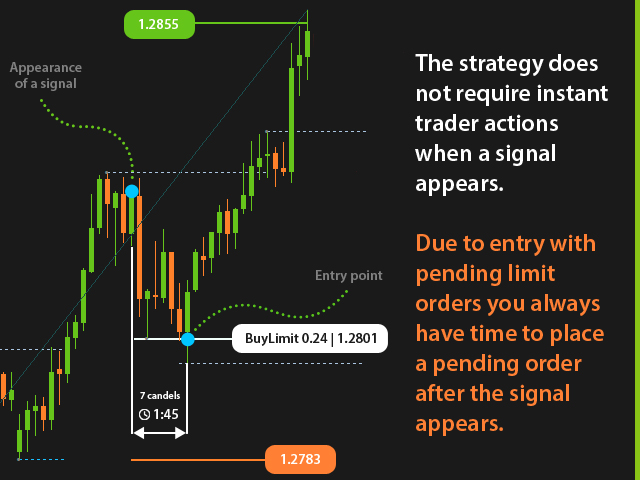
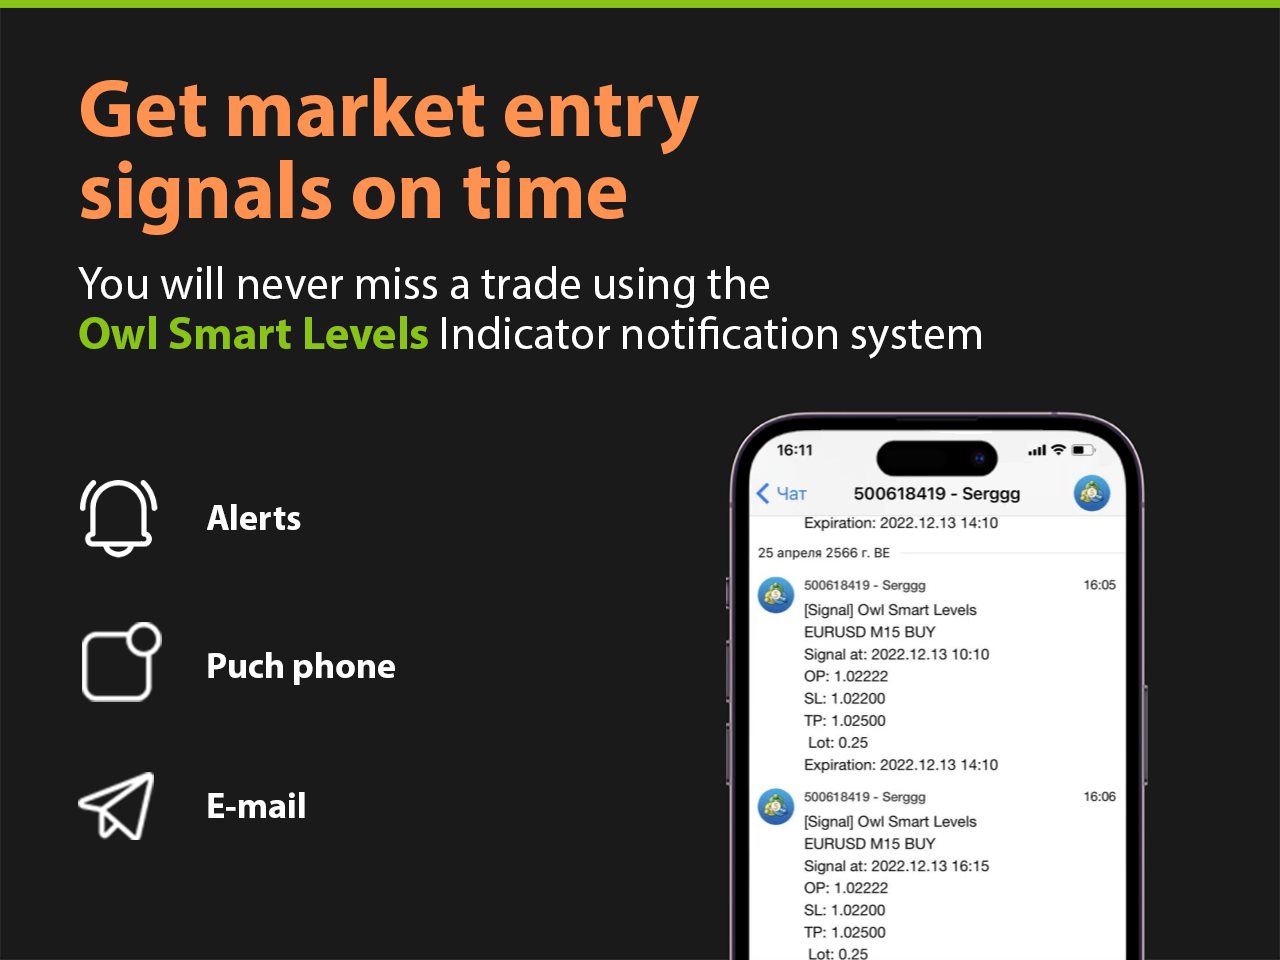
Owl Smart Levels 交易系統非常易於使用,因此適合專業人士和剛開始研究市場並為自己選擇交易策略的人。 策略和指標中沒有隱藏的秘密公式和計算方法,所有策略指標都是公開的。 Owl Smart Levels 允許您快速查看進入交易的信號,突出顯示下訂單的水平並向您發送有關已出現信號的通知。
優點很明顯:
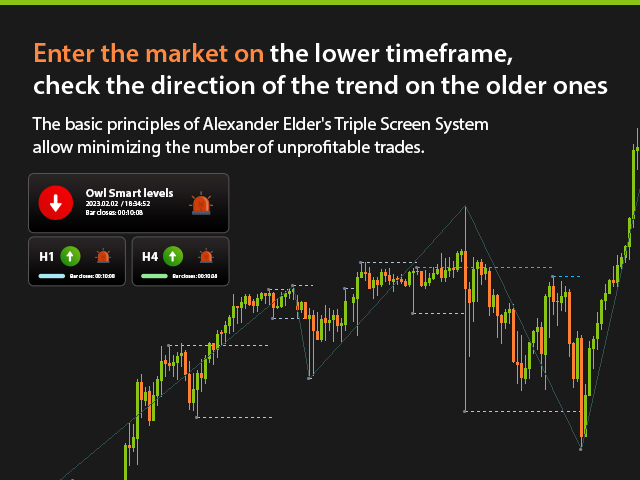
- 清楚地顯示主要和更高時間框架的趨勢方向。
- 指示儀器信號的出現。
- 標記開單、止損設置和固定利潤的水平。
沒有多餘的,只有必要的結構!
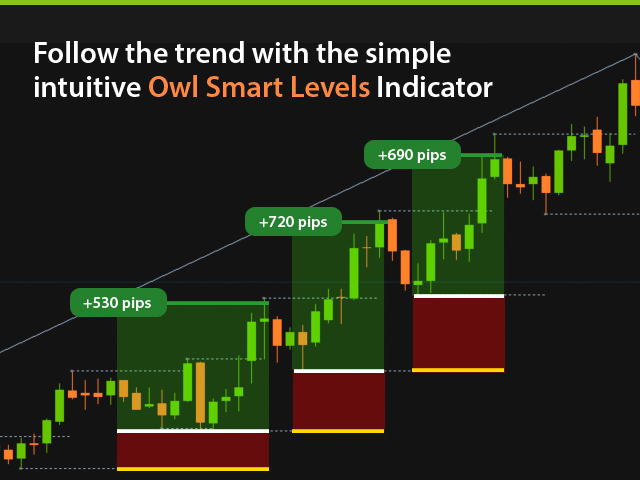
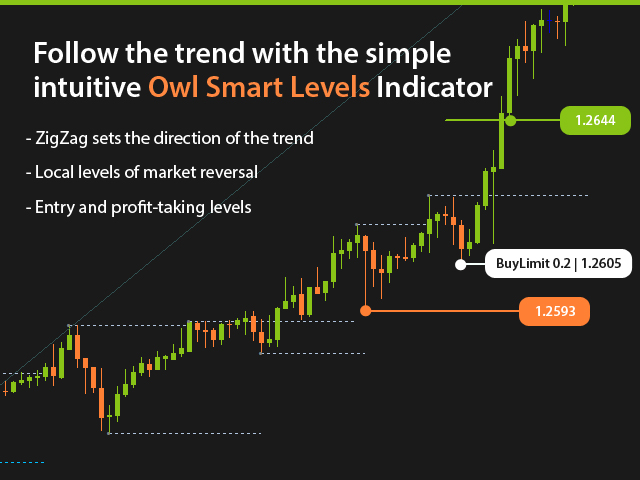
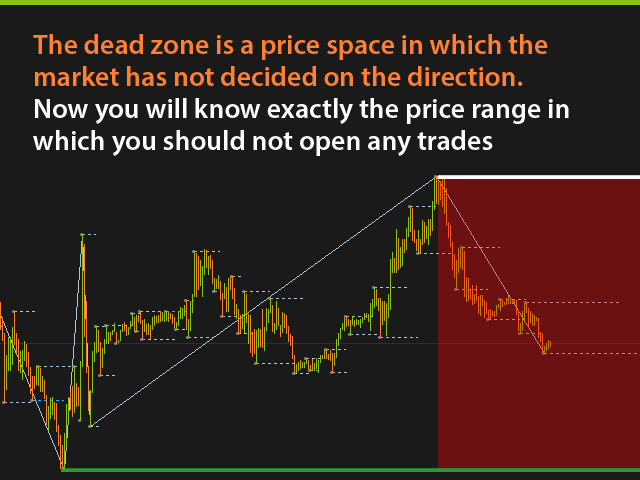
ZigZag 表示全球趨勢的方向,因此也表示貿易方向。 市場反轉點的短線清楚地表明在什麼水平上構建斐波那契網格。 以及您應該開倉並設置 StopLoss 和 TakeProfit 的水平。 這就是我們需要在圖表上看到的全部內容!
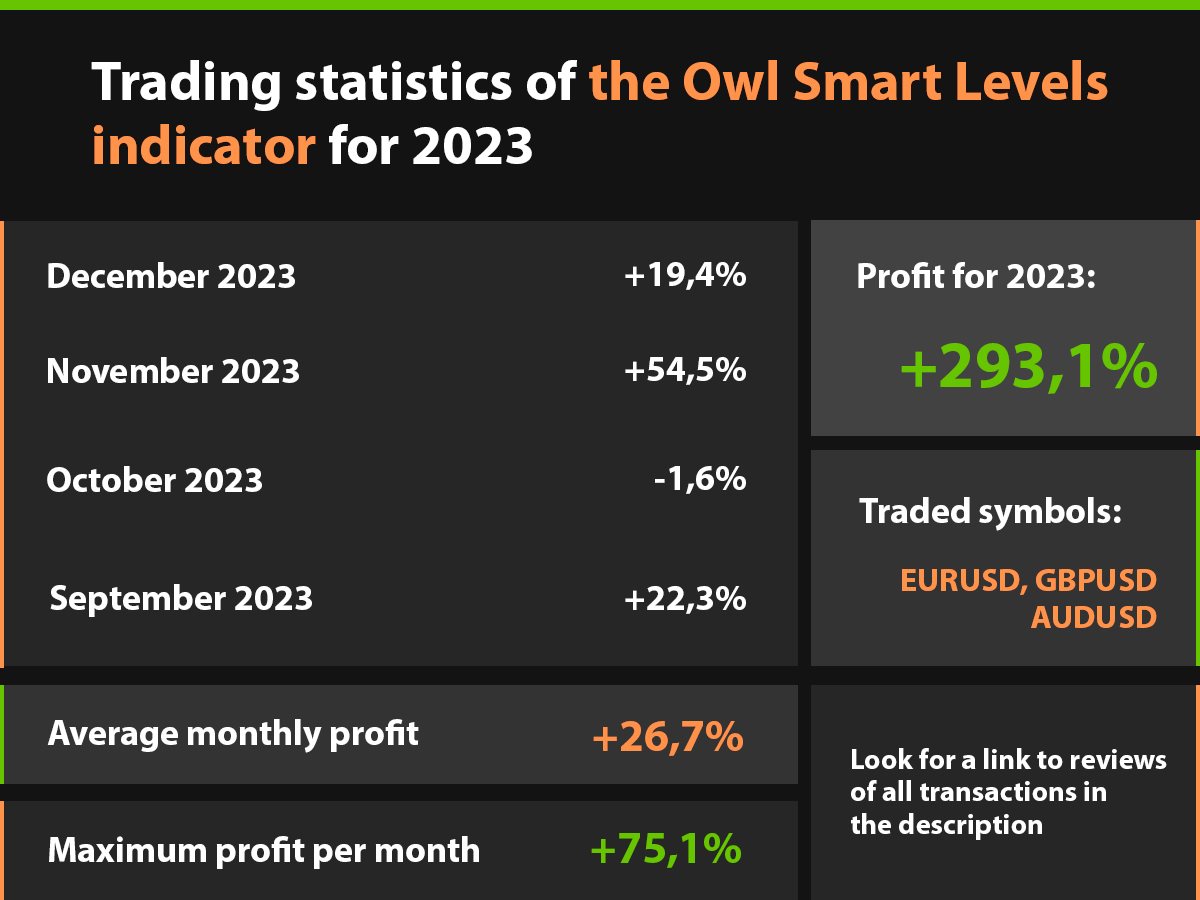
點擊鏈接查看每週交易評論 >>
您只需要了解 4 個最重要的設置:
- Candles on the left – 確定用於構建分形的左側柱的數量。
- Candles on the right – 確定右側柱的數量以構建分形。
- Open price level – 分配斐波那契水平以確定進入市場的入口點。
- TakeProfit level – 為設置 TakePofit 分配斐波那契水平。
大多數指標只顯示市場已經發生的歷史,Owl Smart Levels 建議跟隨全球趨勢並建議進入局部修正。
我是Sergei Ermolov,關注我更新!


i belive this guy hi i want to get the owl bonus