• Aperçu
  • Avis (8)
  • Commentaires (8)
  • Nouveautés

Owl Smart Levels MT5

5

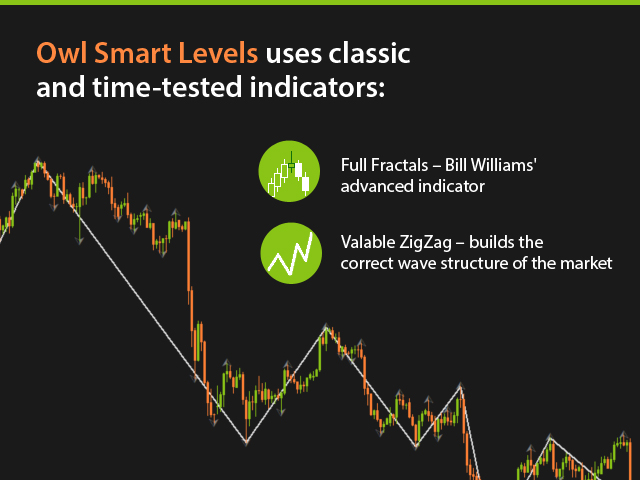
L'indicateur Owl Smart Levels est un système de trading complet au sein d'un seul indicateur qui comprend des outils d'analyse de marché populaires tels que les fractales avancées de Bill Williams, Valable ZigZag qui construit la structure d'onde correcte du marché et les niveaux de Fibonacci qui marquent les niveaux exacts d'entrée. sur le marché et les endroits où prendre des bénéfices.

Pour une description détaillée du système de trading, voir l'article Owl Trend Strategy - Smart Levels

La puissance est dans la simplicité !

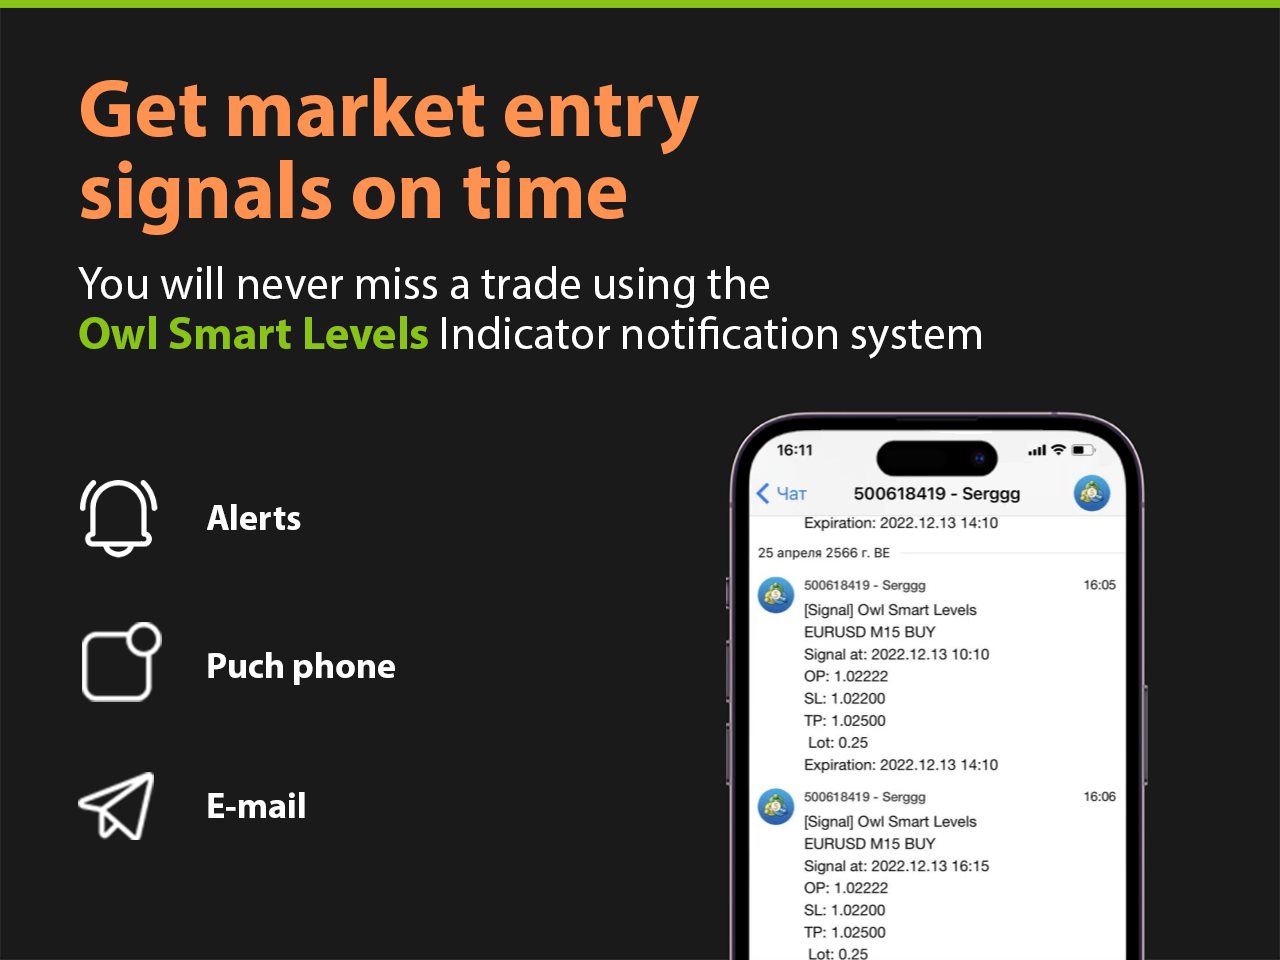
Le système de trading Owl Smart Levels est très facile à utiliser, il convient donc aussi bien aux professionnels qu'à ceux qui commencent tout juste à étudier le marché et à choisir une stratégie de trading pour eux-mêmes. Il n'y a pas de formules secrètes et de méthodes de calcul cachées à l'œil dans la stratégie et l'indicateur, tous les indicateurs de stratégie sont accessibles au public. Owl Smart Levels vous permet de voir rapidement le signal pour entrer dans une transaction, met en évidence les niveaux pour passer une commande et vous envoie une notification sur le signal qui est apparu.

Les avantages sont évidents :

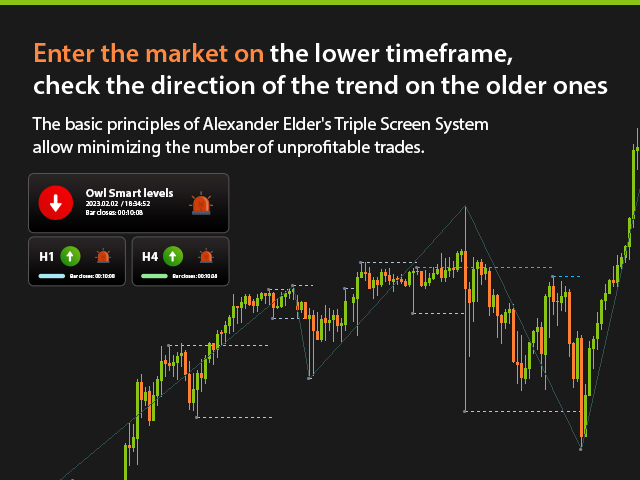
  • Affiche clairement la direction de la tendance sur le timeframe principales et supérieures.
  • Signale l'apparition d'un signal pour l'instrument.
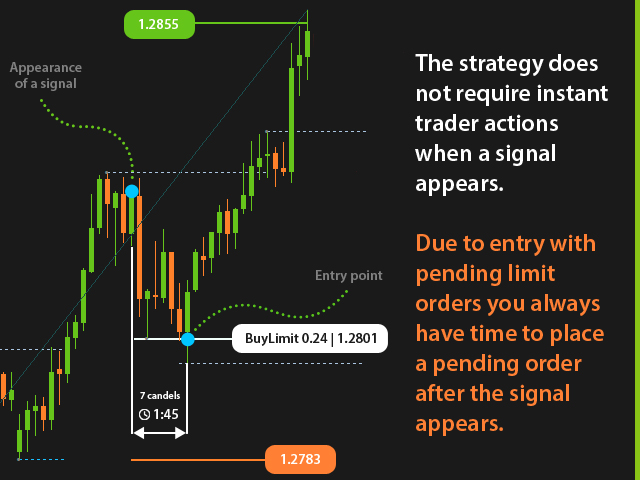
  • Marque les niveaux d'ouverture de commande, de réglage d'arrêt et de fixation des bénéfices.

Offre spéciale

  • Acheter l'indicateur Owl Smart Levels
  • Ecrire un commentaire
  • Ajoutez-moi comme ami

Obtenez gratuitement :

  • Conseiller Expert auxiliaire le Owl Helper
  • Conseiller Expert MiloBot PRO pour 3 mois GRATUITEMENT

Rien de superflu, juste les tracés nécessaires !

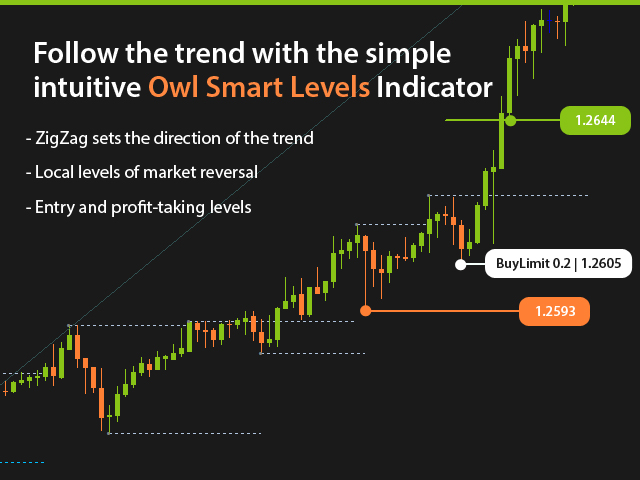
ZigZag montre la direction de la tendance mondiale et, par conséquent, la direction du commerce. Des lignes courtes de points d'inversion du marché indiquent clairement à quels niveaux construire la grille de Fibonacci. Et les niveaux eux-mêmes auxquels vous devez ouvrir une position et définir StopLoss et TakeProfit. C'est tout ce que nous devons voir sur le graphique!

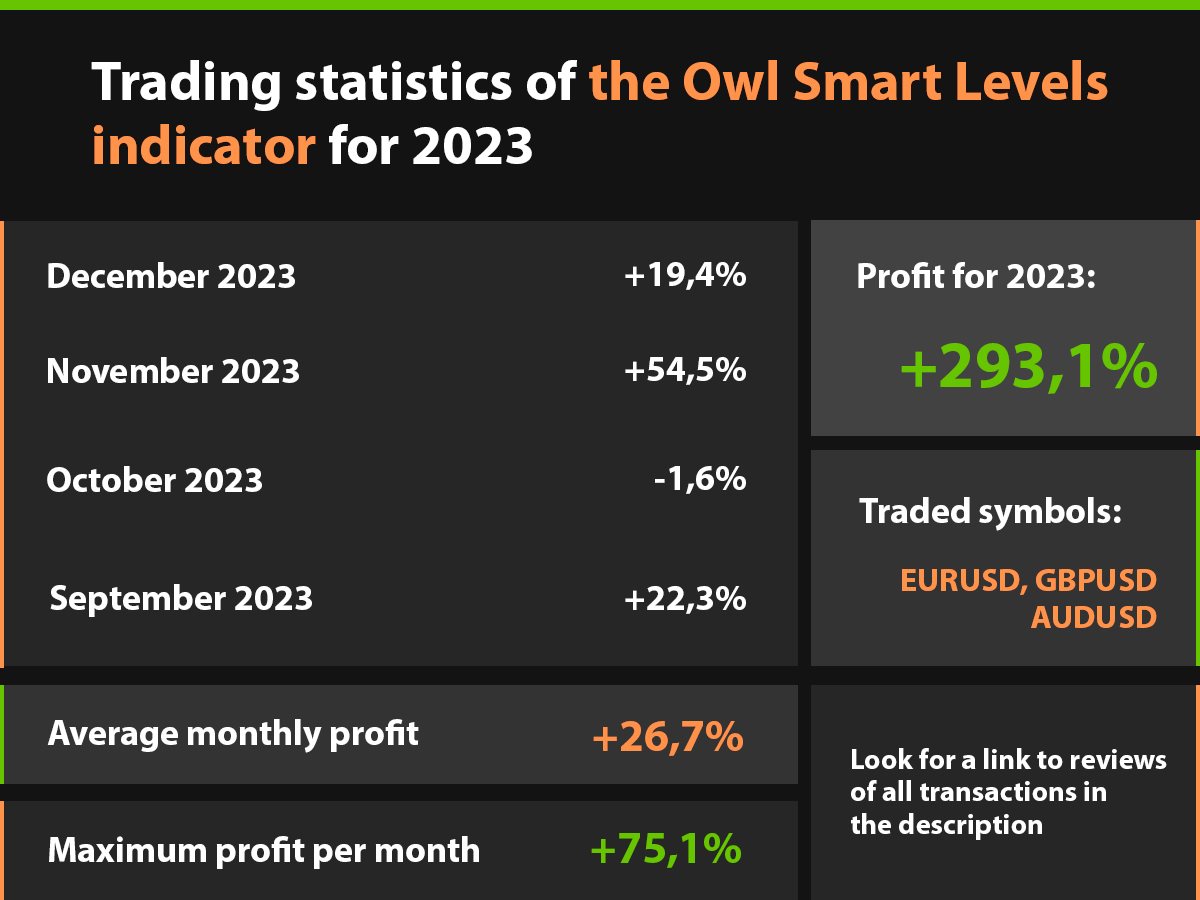
Regardez les revues des trades hebdomadaires en cliquant sur le lien >>

Il n'y a que 4 paramètres les plus importants que vous devez connaître :

  1. Candles on the left  détermine le nombre de barres à gauche pour construire une fractale.
  2. Candles on the right  détermine le nombre de barres à droite pour construire une fractale.
  3. Open price level  attribue le niveau de Fibonacci pour déterminer le point d'entrée sur le marché.
  4. TakeProfit level – attribue le niveau de Fibonacci pour définir TakeProfit.

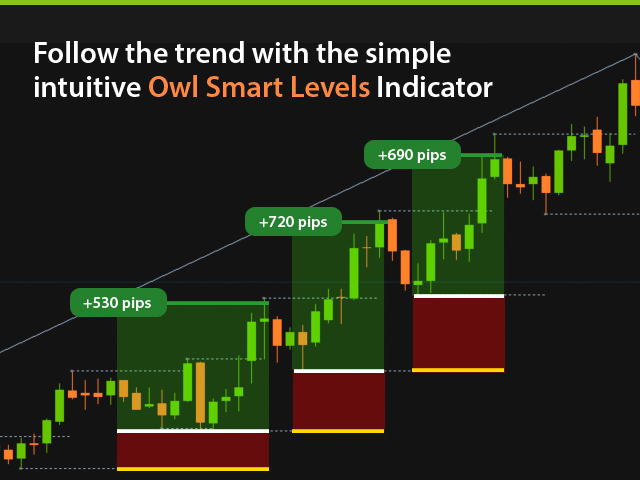
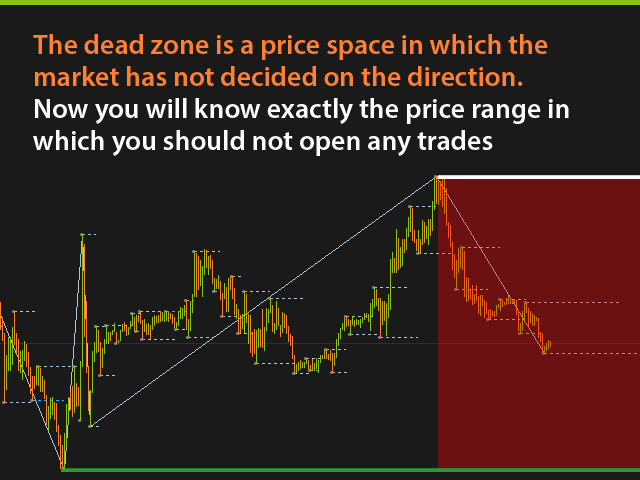
La plupart des indicateurs ne montrent que l'historique de ce qui s'est déjà passé sur le marché, et Owl Smart Levels recommande de suivre la tendance mondiale et suggère d'entrer dans des corrections locales.

Je suis Sergei Ermolov, suivez-moi pour les mises à jour !


Avis 8
Thiranai Somjing
22
Thiranai Somjing 2023.05.25 13:07 
 

A nice and simple strategy to follow.

schulz2021
20
schulz2021 2023.05.24 11:09 
 

Excellent indicator. For me it is very easy to understand which trading rules are used. There is enough time to convert the signal into a trade. All markets and different trading activities are supported by different parameters.

manuelm3
43
manuelm3 2023.05.22 19:34 
 

Very good attention, it is a very interesting strategy, it is not a simple indicator, in principle highly recommended.

Produits recommandés
Elliott Wave Trend was designed for the scientific wave counting. This tool focuses to get rid of the vagueness of the classic Elliott Wave Counting using the guideline from the template and pattern approach. In doing so, firstly Elliott Wave Trend offers the template for your wave counting. Secondly, it offers Wave Structural Score to assist to identify accurate wave formation. It offers both impulse wave Structural Score and corrective wave Structure Score. Structural Score is the rating to sh
200 USD
WAPV Weis Wave Chart Forex
Eduardo Da Costa Custodio Santos
Le Weis Wave Chart Forex pour MT5 est un indicateur de prix et de volume. La lecture du prix et du volume a été largement diffusée par Richard Demille Wyckoff sur la base des trois lois qu'il a créées : l'offre et la demande, la cause et l'effet et l'effort contre le résultat. En 1900 R.Wyckoff utilisait déjà le wave chart dans ses analyses. De nombreuses années plus tard, vers 1990, David Weis a automatisé le diagramme d'onde de R. Wyckoff et aujourd'hui nous vous apportons l'évolution du diagr
100 USD
Follow The Line PRO MT5
Oliver Gideon Amofa Appiah
Follow The Line PRO   FOLLOW THE LINE (PRO VERSION) This powerful indicator is the full and complete version of my free indicator called "Follow The Line". IT IS BASED ON the popular maxim that: "THE TREND IS YOUR FRIEND" It gives alarms and alerts of all kinds. IT DOES NOT REPAINT and can be used for all currency pairs and timeframes. AVOID FALSE SIGNALS: BUY ONLY when price closes above the green line and the green line is above the blue channel. SELL ONLY when price closes below the pink
50 USD
Normalized Volume 99% of indicators are based on price analysis. This indicator is based on volume. Volume is overlooked piece of information in most trading systems. And this is a big mistake since volume gives important information about market participants. Normalized Volume is an indicator that can be used to confirm reversal points. The indicator code volume with colors indicating high, normal and low volume. You could enhance dramatically your trading system using volume analysis
97 USD
Gartley Projections D
Oleksandr Medviediev
3 (2)
The indicator identifies the harmonic patterns (XABCD) according to developments of H.M.Gartley ( "Profits in the Stock Market" , 1935г). It projects D-point as a point in the perspective projection (specify ProjectionD_Mode = true in the settings). Does not redraw. When a bar of the working timeframe closes, if the identified pattern point has not moved during Patterns_Fractal_Bars bars, an arrow appears on the chart (in the direction of the expected price movement). From this moment on, the ar
200 USD
The Fibonacci series.  This number sequence is formed as each subsequent number is a sum of the previous two. it turns out that it refers to its neighbors in the ratio 0.618 and 1.618 The most commonly used method for measuring and forecasting the length of the price movement is along the last wave, which ended in the opposite direction The Fibonacci Waves indicator could be used by traders to determine areas where they will wish to take profits in the next leg of an Up or Down trend.
40 USD
This indicator will detect harmonic patterns that are drawn on the chart by manual and automatic methods. You can see user manual from this link: https://www.mql5.com/en/blogs/post/719257 There is a free MT4 version to try this product. You can use it to detect Gartley and Nenstar patterns: https://www.mql5.com/en/market/product/30181 You can buy the full MT5 version from: https://www.mql5.com/en/market/product/70105 Notes Indicator has control panel and it will save every (chart & timeframe)
125 USD
Introduction to X3 Chart Pattern Scanner X3 Cherart Pattern Scanner is the non-repainting and non-lagging indicator detecting X3 chart patterns including Harmonic pattern, Elliott Wave pattern, X3 patterns, and Japanese Candlestick patterns. Historical patterns match with signal patterns. Hence, you can readily develop the solid trading strategy in your chart. More importantly, this superb pattern scanner can detect the optimal pattern of its kind. In addition, you can switch on and off individu
250 USD
What was IFM created for Our goal in creating IFM was to provide the tool to manage your Fibonacci Retrecements and other Fibo tools in MetaTrader 5. This indicator allows you to edit all of the settings without getting into it by right click on the tool. That is faster and easiest way to manage objects on your chart. Inputs Font size - change font size of texts on the IFM panel. This is necessary, because some of users change font size in Windows settings Description of the Fibo levels (varia
40 USD
Introduction to Chart Pattern MT Chart Pattern MT is a chart pattern scanner to detect the triangle pattern, falling wedge pattern, rising wedge pattern, channel pattern and so on. Chart Pattern MT uses highly sophisticated chart pattern detection algorithm. However, we have designed it in the easy to use with intuitive user interface. Chart Pattern MT will show all the patterns in your chart in the most efficient format for your trading. You do not have to do tedious manual pattern detection an
180 USD
BeST_Keltner Channels Strategies MT5   is an  MT5  Indicator based on the original Keltner Channels Indicator and it can display in the Chart all the known Variations of Keltner Channels and also the corresponding 10 totally Strategies. Every such generally consists of a Central Moving Average Line and two Boundary Bands at a distance above and below it and can be traded mainly in a Trending Mode but also in a Ranging ReEntry Mode.  BeST_Keltner Channels Strategies Indicator Draws definite Bu
35 USD
L'indicateur affiche des schémas harmoniques sur le graphique basé sur Dynamic ZigZag (   https://www.mql5.com/en/market/product/5356   ) et est presque un analogue complet de l'une des versions du célèbre korHarmonics. L'indicateur reconnaît les modèles suivants et leurs variétés : ABCD, Gartley (Papillon, Crabe, Chauve-souris), 3Drives, 5-0, Batman, SHS, One2One, Camel, Triangles, WXY, Fibo et Vibrations. Seul l'affichage des modèles ABCD et Gartley est activé dans les paramètres par défaut. L
50 USD
Keltner Channel Indicator Keltner Channel is an oscillator like Bollinger Bands. Keltner Channel is a very good tool to time entries for your strategy. Keltner Channel displays a channel where price is supposed to stay unless we are in overbought or oversold situations. Various strategies use Keltner Channel indicator successfully to spot overbought / oversold situations and look for reversals. Keltner Channel indicator uses ATR to determine overbought and oversold situations. Inputs of the
97 USD
This is arguably the most complete harmonic price formation auto-recognition indicator you can find for the MetaTrader Platform. It detects 19 different patterns, takes fibonacci projections as seriously as you do, displays the Potential Reversal Zone (PRZ) and finds suitable stop-loss and take-profit levels. [ Installation Guide | Update Guide | Troubleshooting | FAQ | All Products ] It detects 19 different harmonic price formations It plots primary, derived and complementary Fibonacci p
249 USD
Mean Volume indicator for MT5
Renaud Herve Francois Candel
Mean Volume Most indicators are based on price analysis. This indicator is based on volume. Volume is overlooked piece of information in most trading systems. And this is a big mistake since volume gives important information about market participants. Mean Volume is an indicator that can be used to spot when volume is above average. It usually means that institutional traders are active. Peak in volume can be used to confirm an entry since increased volume can sustain the move in one
97 USD
Introduction Harmonic Patterns are best used to predict potential turning point. Traditionally, Harmonic Pattern was identified manually connecting peaks and troughs points in the chart. Manual harmonic pattern detection is painfully tedious and not suitable for everyone. You are often exposed under subjective pattern identification with manual pattern detection. To avoid these limitations, Harmonic Pattern Plus was designed to automate your harmonic pattern detection process. The functionality
98 USD
An Ultimate Tool  for quick and efficient market analysis. Unique combination of solid indicators defining market direction for trend tracking and filtration designed for you to stay on the   right   side of the market. Market Rider Oscillators  gives you access to one of the most used from professional trades indicators on worldwide, which were not build in for MT4 and MT5 terminals . These are unique non-repainting oscillators designed to be used on all time frames for all instruments class
50 USD
How the day starts
Sergio Antoni Escudero Tirado
This indicator draws the high intraday price and the low intraday price of the first n minutes of the day. The chart shows the days with vertical lines and two horizontal lines to indicate the max and the min close price of the n first minutes of the day. The max/min lines start and end with the day calculated. With this indicator you can see how starts the day compared with the previous days. It is valid for any market inasmuch as the start time is calculated with the data received. Paramete
30 USD
DUCHOAN99 would like to send you the  indicator   ATR (Keltner) Channels Multi TF Real Value for MT5 . Please download the demo to see if the indicator helps you or not before deciding to buy this indicator. 1.   KEY TAKEAWAYS Keltner Channels are volatility-based bands that are placed on either side of an asset's price and can aid in determining the direction of a trend. The exponential moving average (EMA) of a Keltner Channel is typically 20 periods, although this can be adjusted if desired
30 USD
This dashboard shows the latest available  Harmonic Patterns  for selected symbols. Free Indicator :   Basic Harmonic Pattern MT4 Version Columns Symbol Trend   (Bullish/ Bearish) Pattern   Type (Gartley/ Butterfly/ Bat/ Crab) Entry  (Entry Price) SL   (Stop Loss Price) TP1   (1st Take Profit Price) TP2  (2nd Take Profit Price) TP3  (3rd Take Profit Price) Current   (Current Price) Age   (Age of pattern in Bars) Alert Settings   (Set an alert if a new pattern is found) You can sort the dashboa
99 USD
Le niveau Premium est un indicateur unique avec une précision de plus de 80 % des prédictions correctes ! Cet indicateur a été testé par les meilleurs Trading Specialists depuis plus de deux mois ! L'indicateur de l'auteur que vous ne trouverez nulle part ailleurs ! À partir des captures d'écran, vous pouvez constater par vous-même la précision de cet outil ! 1 est idéal pour le trading d'options binaires avec un délai d'expiration de 1 bougie. 2 fonctionne sur toutes les paires de de
1 100 USD
Price Breakout pattern Scanner is the automatic scanner for traders and investors. It can detect following patterns automatically from your chart. Head and Shoulder - Common tradable pattern. Reverse Head and Shoulder - This pattern is the reverse formation of the Head and Shoulder. Double Top - When the price hits resistance level twice and decline toward the support level, the trader can anticipate sudden bearish breakout through the support level. Double Bottom - The double bottom pattern is
100 USD
TSO Bollinger Bandit Strategy is an indicator based on the Bollinger Bandit Trading Strategy as presented in the book Building Winning Trading Systems with TradeStation by G. Pruitt and J. R. Hill. SCANNER is included . Now with Scanner you can find trading opportunities and setups easily and faster.   Features A complete entry and exit strategy for trending markets. Get email / push notifications when an entry signal occurs. The indicator is not repainting. Can easily be used in an EA. (see F
69 USD
Elliott Wave Helper
Siarhei Vashchylka
4.8 (5)
Elliott Wave Helper - A panel for marking Elliott wave  and technical analysis. Wave Analysis: Allows you to build a wave analysis in a few clicks with the definition of the type and order of waves. - Choice of color, style and font of waves is available. - Marking of impulses, triangles, zigzags, flats, simple and complex combinations is available. Special wave font is supported. To activate it, you need to do the following: Download the font following the link: https://traderevolution.ru/upl
99 USD
FibTracer
Syed Oarasul Islam
FibTracer is an interactive Fibonacci tool that is aim to improve and facilitate your Fibonacci trading style. This Indicator can generate Fibonacci Retracement levels in two different ways. You can select whether to draw Fibonacci Retracement levels based on you favourite ZigZag settings or you can let the indicator to draw Fibonacci Retracement level based on given number of periods.  You can also set Mobile and Email notification for your favourite Retracement levels individually. With this i
60 USD
IndicateMe
Dani Cyril Bakkum
The IndicateMe indicator has been specially created to remove as much noise as possible from the signals it gives. The indicator has been combined with several other well-known indicators. Indicators  that have been used: "Moving average, stocastic indicator, relative strenght index, moving". All indicators that are used can be adjusted by yourself. The default settings are set to the values ​​I like to use. Easily set alerts to always stay informed of the indicator's signals. Important: thi
30 USD
"The Squeeze indicator attempts to identify periods of consolidation in a market. In general the market is either in a period of quiet consolidation or vertical price discovery. By identifying these calm periods, we have a better opportunity of getting into trades with the potential for larger moves. Once a market enters into a "squeeze," we watch the overall market momentum to help forecast the market direction and await a release of market energy." The Modified TTM Squeeze Indicator is a modi
149 USD
The indicator builds a dynamic regression channel with high accuracy without lagging. Channel deviation is calculated using a unique formula and displayed on the graph. Support:   https://www.mql5.com/en/channels/TrendHunter Can be used on any timeframe and any instrument. MT4-version: https://www.mql5.com/en/market/product/64252 Can be used as a ready-made trading system, as well as an addition to the existing one. Settings: Fast Period   - Fast smoothing period; Slow Period   - Slow s
35 USD
Incinerat8
Paulos Ngwenya
This algorithm uses real time data to generate signals with an accuracy rate of 80%. It shows entries and where you should place both the stoploss and the take profit for each trade. It determines trend! It can even help you to become a signal provider! And it can generate up to 8 signals a day! You get access to a free forex trading community  Operates on any broker compatible to synthetic indices and forex   if you need any assistance whatsapp +2774 35 35 744 or telegram link @pipsempire01
400 USD
Matreshka
Dimitr Trifonov
Matreshka self-testing and self-optimizing indicator: 1. Is an interpretation of the Elliott Wave Analysis Theory. 2. Based on the principle of the indicator type ZigZag, and the waves are based on the principle of interpretation of the theory of DeMark. 3. Filters waves in length and height. 4. Draws up to six levels of ZigZag at the same time, tracking waves of different orders. 5. Marks Pulsed and Recoil Waves. 6. Draws arrows to open positions 7. Draws three channels. 8. Notes support and re
245 USD
Les acheteurs de ce produit ont également acheté
Top indicator for MT5   providing accurate signals to enter a trade without repainting! It can be applied to any financial assets: forex, cryptocurrencies, metals, stocks, indices .  MT4 version is here It will provide pretty accurate trading signals and tell you when it's best to open a trade and close it. Watch  the video  (6:22) with an example of processing only one signal that paid off the indicator! Most traders improve their trading results during the first trading week with the help of
125 USD
TPA True Price Action indicator reveals the true price action of the market makers through 100% non-repainting signals strictly at the close of a candle! TPA shows entries and re-entries, every time the bulls are definitely stronger than the bears and vice versa. Not to confuse with red/green candles. The shift of power gets confirmed at the earliest stage and is ONE exit strategy of several. There are available now two free parts of the TPA User Guide for our customers. The first "The Basics"
168 USD
Blahtech Supply Demand MT5
Blahtech Limited
4.45 (11)
Supply Demand uses previous price action to identify potential imbalances between buyers and sellers. The key is to identify the better odds zones, not just the untouched ones. Blahtech Supply Demand indicator delivers functionality previously unavailable on any trading platform. This 4-in-1 indicator not only highlights the higher probability zones using a multi-criteria strength engine, but also combines it with multi-timeframe trend analysis, previously confirmed swings and engulfing detecto
99 USD
Market Profile defines a number of day types that can help the trader to determine market behaviour. A key feature is the Value Area, representing the range of price action where 70% of trading took place. Understanding the Value Area can give traders valuable insight into market direction and establish the higher odds trade. It is an excellent addition to any system you may be using. Blahtech Limited presents their Market Profile indicator for the MetaTrader community. Inspired by Jim Dalton’s
99 USD
XQ Indicator MT5
Marzena Maria Szmit
5 (1)
The signal conditions are a combination of three indicators, and XQ Forex Indicators only display  medium and long-term trends . The indicator's efficacy has been improved with the addition of a filter that blocks out false signals. The XQ Forex Indicator can be used on  FX pairs, CFDs, and Cryptocurrencies . There are two type of signals:  Buy or Sell and Big Long or Big Short It is possible to enable sending emails when a major trend-change signal is detected, as well as to display the alerts
179 USD
Advanced Supply Demand MT5
Bernhard Schweigert
4.36 (11)
La meilleure solution pour tout commerçant débutant ou expert ! Cet indicateur est un outil de trading unique, de haute qualité et abordable car nous avons intégré un certain nombre de fonctionnalités propriétaires et une nouvelle formule. Avec cette mise à jour, vous pourrez afficher des zones à double horaire. Vous pourrez non seulement afficher un TF plus élevé, mais afficher les deux, le graphique TF, PLUS le TF supérieur : AFFICHAGE DES ZONES NICHÉES. Tous les traders Supply Demand vont ado
199 USD
MetaBands M5
Vahidreza Heidar Gholami
5 (2)
MetaBands uses powerful and unique algorithms to draw channels and detect trends so that it can provide traders with potential points for entering and exiting trades. It’s a channel indicator plus a powerful trend indicator. It includes different types of channels which can be merged to create new channels simply by using the input parameters. MetaBands uses all types of alerts to notify users about market events. Features Supports most of the channel algorithms Powerful trend detection algorith
129 USD
Introduction to EFW Analytics EFW Analytics was designed to accomplish the statement "We trade because there are regularities in the financial market". EFW Analytics is a set of tools designed to maximize your trading performance by capturing the repeating fractal geometry, known as the fifth regularity in the financial market. The functionality of EFW Analytics consists of three parts. Firstly, Equilibrium Fractal Wave Index is an exploratory tool to support your trading logic to choose which r
200 USD
Setups 9 Larry Williams
Luigi Nunes Labigalini
Buy and sell signals based on Larry Williams's exponential moving average strategies 9.1, 9.2, 9.3 and 9.4 for trend reversals and continuations. To understand the logic and how to trade the signals, please check: Setup 9.1:  https://www.mql5.com/pt/market/product/50986 Setup 9.2:  https://www.mql5.com/pt/market/product/52268 Setup 9.3:  https://www.mql5.com/pt/market/product/52269 Setup 9.4:  https://www.mql5.com/pt/market/product/52273 Notices:  - This indicator displays a lot of signals.
199 USD
Stargogs Spike Catcher
Lorenzo Edward Beukes
5 (6)
Stargogs Spike Catcher V3.11 This Indicator is Developed To milk the BOOM and CRASH indices . Send me Message if you need any help with the indicator.  CHECK OUT THE STARGOGS SPIKE CATCHER EA/ROBOT V3: CLICK HERE ALSO CHECK OUT SECOND TO NONEFX SPIKE CATCHER:   CLICK HERE STARGOGS SPIKE CATCHER V3.11 WHATS NEW! Brand New Strategy. This is the Indicator you need for 2023. The Indicator Gives you an Entry at a time when conditions are met and you should use TP & SL. New Trendline that changes col
100 USD
Introduction to Fractal Pattern Scanner Fractal Indicator refers to the technical indicator that makes use of the fractal geometry found in the financial market. Fractal Pattern Scanner is the advanced Fractal Indicator that brings the latest trading technology after the extensive research and development work in the fractal geometry in the financial market. The most important feature in Fractal Pattern Scanner is the ability to measure the turning point probability as well as the trend probabil
185 USD
Royal Scalping Indicator M5
Vahidreza Heidar Gholami
5 (8)
Royal Scalping Indicator is an advanced price adaptive indicator designed to generate high-quality trading signals. Built-in multi-timeframe and multi-currency capabilities make it even more powerful to have configurations based on different symbols and timeframes. This indicator is perfect for scalp trades as well as swing trades. Royal Scalping is not just an indicator, but a trading strategy itself. Features Price Adaptive Trend Detector Algorithm Multi-Timeframe and Multi-Currency Trend Low
149 USD
Royal Wave Pro M5
Vahidreza Heidar Gholami
3.67 (3)
Royal Wave is a Trend-Power oscillator which has been programmed to locate and signal low-risk entry and exit zones. Its core algorithm statistically analyzes the market and generates trading signals for overbought, oversold and low volatile areas. By using a well-designed alerting system, this indicator makes it easier to make proper decisions regarding where to enter and where to exit trades. Features Trend-Power Algorithm Low risk Entry Zones and Exit Zones Predictions for Overbought and Over
129 USD
PZ Trend Trading MT5
PZ TRADING SLU
3.67 (3)
Trend Trading is an indicator designed to profit as much as possible from trends taking place in the market, by timing pullbacks and breakouts. It finds trading opportunities by analyzing what the price is doing during established trends. [ Installation Guide | Update Guide | Troubleshooting | FAQ | All Products ] Trade financial markets with confidence and efficiency Profit from established trends without getting whipsawed Recognize profitable pullbacks, breakouts and early reversals The ind
175 USD
PZ Swing Trading MT5
PZ TRADING SLU
5 (4)
Swing Trading is the first indicator designed to detect swings in the direction of the trend and possible reversal swings. It uses the baseline swing trading approach, widely described in trading literature. The indicator studies several price and time vectors to track the aggregate trend direction and detects situations in which the market is oversold or overbought and ready to correct. [ Installation Guide | Update Guide | Troubleshooting | FAQ | All Products ] Profit for market swings with
175 USD
What is a Point of Interest? Traders who follow Smart Money Concepts may call this a Liquidity Point, or areas pools of liquidity have been built up by retail traders for for Big Banks to target to create large price movements in the market. As we all know, retail traders that use outdated and unreliable methods of trading like using trendlines, support and resistance, RSI, MACD, and many others to place trades and put their stop losses at keys points in the market. The "Big Banks" know these me
99.99 USD
Short description : TAMA is, at its core, a novel method for correcting moving averages (MAs) during trends. | This usually also results in better smoothing and a significantly lower time delay (lag) of the MAs. | The indicator can additionally be used for price forecasts and band formation, also combined. | TAMA received an award from VTAD in 2022. | Honored with the VTAD Award 2022 (VTAD = Association of Technical Analysts Germany, German branch of IFTA).   Core Features : Classic MAs
99 USD
WAPV Full MT5
Eduardo Da Costa Custodio Santos
## Opérez de manière professionnelle en utilisant WAPV Full et soyez capable de suivre où est l'argent des gros joueurs Imaginez que vous ayez entre les mains un outil qui fait seul la lecture des principaux acteurs du marché, montrant les meilleures régions commerciales sur la base d'une analyse des prix et des volumes. WAPV Full est un outil complet, 100% focalisé sur l'opérationnel de R. Wyckoff En plus de cartographier les mouvements du marché dans les vagues de négociation, il cartographie
199 USD
ToolBox 360 is the swiss knife of all indicators. It is full packed with useful tools to help you with your trading. It can be used to find best entry and exit points and help you to decide if you should open a trade or not. It shows market trends, candlestick formations outside / inside bars and you can sett time based allerts. Main features: Time based Fibonacci lines Choose a start and end time and the indicator shows you Fibonacci lines within the selected time range including range high
399 USD
Tired of plotting support and resistance lines? This is a multi-timeframe indicator that detects and plots supports and resistance lines in the chart with the same precision as a human eye would. As price levels are tested over time and its importance increases, the lines become thicker and darker, making price leves easy to glance and evaluate. [ Installation Guide | Update Guide | Troubleshooting | FAQ | All Products ] Boost your technical analysis Customizable timeframe selection Read pri
125 USD
Introduction to Harmonic Pattern Scenario Planner The present state of Forex market can go through many different possible price paths to reach its future destination. Future is dynamic. Therefore, planning your trade with possible future scenario is an important step for your success. To meet such a powerful concept, we introduce the Harmonic Pattern Scenario Planner, the first predictive Harmonic Pattern Tool in the world among its kind. Main Features Predicting future patterns for scenari
100 USD
Nouvelle génération de zones d'approvisionnement et de demande automatisées. Algorithme nouveau et innovant qui fonctionne sur n'importe quel graphique. Toutes les zones sont créées dynamiquement en fonction de l'action des prix du marché. DEUX TYPES D'ALERTES --> 1) QUAND LE PRIX ATTEINT UNE ZONE 2) QUAND UNE NOUVELLE ZONE SE FORME Vous n'obtenez pas un indicateur inutile de plus. Vous obtenez une stratégie de trading complète avec des résultats prouvés.     Nouvelles fonctionnali
149 USD
Automated Trendlines MT5
Georgios Kalomoiropoulos
Les lignes de tendance sont l'outil d'analyse technique le plus essentiel dans le trading forex. Malheureusement, la plupart des commerçants ne les dessinent pas correctement. L'indicateur Automated Trendlines est un outil professionnel pour les traders sérieux qui vous aide à visualiser le mouvement de tendance des marchés. Il existe deux types de lignes de tendance, les lignes de tendance haussières et les lignes de tendance baissières. Dans la tendance haussière, la ligne de tendance
99 USD
Price Action Finder MT5
Siarhei Vashchylka
5 (9)
The Price Action finder indicator displays Price action patterns on the price chart. Pattern List: Pin Bar (Pin) Outside bar (OB) Inside bar (IB) PPR Force bar The hanged man (HM) Inverted hammer (HR) Filter For novice traders, in the new version of the indicator, we have added a trend filter taken from Elder's Three Screens system. Now it can be enabled in the external parameters of the indicator. The trend filter is configured for each price range separately. External parameters: FB  -  Dis
99 USD
The Volume by Price Indicator for MetaTrader 5 features Volume Profile and Market Profile TPO (Time Price Opportunity). Get valuable insights out of currencies, equities and commodities data. Gain an edge trading financial markets. Volume and TPO histogram bar, line and metric charts. TPO letter and block marker charts including split structures. Positioning and styling options to suit the user's needs and context. Volume Profile and Market Profile TPO Point of Control (VPOC and TPOC), Imbalanc
179.95 USD
Buy and Sell Alerts when price breaks out following strict price action. Sends Alerts – #On MT5 To Your Phone To Your Email Does not repaint . Works on any Forex pair, any timeframe. 10 Activations allowed so you are free from limitations >> MT4 Version Here Description When the indicator detects a possible trade, it sends you an alert. It shows you where to place your trade and even suggests Stop Loss and Take Profits for you. How To Trade With The Breakout Entry Signals Indicator
297 USD
IVISTscalp5
Vadym Zhukovskyi
Nous vous présentons l'indicateur iVISTscalp5, qui est non seulement unique, mais également efficace dans les opérations de trading. Cet indicateur est basé sur des données temporelles et est le résultat de nombreuses années d'expérience et d'analyse approfondie des marchés financiers. L'indicateur iVISTscalp5 est un excellent outil pour le trading manuel. La commodité, la simplicité et la visualisation - toute la complexité est cachée à l'intérieur. Nous avons simplifié au maximum les paramètre
500 USD
AI Forecast MT5
Leonardo Antonio Camacaro Armas
Discover our extraordinary AI-powered Metatrader 4 indicator, designed to provide you with accurate forecasts on the price reaction of a financial asset based on a specific level! Our product guides you through three simple steps to obtain reliable results and make informed decisions: ️   Step 1:   The user selects the entry level and the two possible outcomes (Take Profit and Stop Loss) and clicks on calculate. In an instant, the full potential of the indicator is unleashed. ️   Step 2:
100 USD
The Quantum VPOC indicator has been developed to expand the two dimensional study of volume and price, to a three dimensional one which embraces time. The volume/price/time relationship then provides real insight to the inner workings of the market and the heartbeat of sentiment and risk which drives the price action accordingly. The Quantum VPOC indicator displays several key pieces of information on the chart as follows: Volume Profile - this appears as a histogram of volume on the vertical pr
197 USD
Introducing the POWER TRADE indicator created by a small group of traders with a few years trading trading the financial market profitably . This is a plug and play indicator that provides you with  POWERFUL Entry signals with Profit Taking and rebound zones. The indicator Works with all MT5 trading instruments. The indicator uses previous  chart data as receipt to speculate on future market moves.
150 USD
Plus de l'auteur
Owl smart levels
Sergey Ermolov
4.79 (19)
Guide de l'indicateur   |  Stratégie Owl Smart Levels  |   Version MT5  |  Comment installer?   |   FAQ L' indicateur Owl Smart Levels   est un système de trading complet au sein d'un seul indicateur qui comprend des outils d'analyse de marché populaires tels que   les fractales avancées de Bill Williams , Valable ZigZag qui construit   la structure d'onde correcte   du marché et   les niveaux de Fibonacci   qui marquent les niveaux exacts d'entrée. sur le marché et les endroits où prendre des
97 USD
Universal Breakout MT5
Sergey Ermolov
4.5 (16)
Paramètres et Rapports |  Version MT4  |  Indicateur de session de trading Universal Box   |  Comment installer?  |  FAQ Universal Breakout   est un conseiller de négociation sur la stratégie   classique de la fourchette de prix de rupture . Il peut être configuré pour n'importe quelle stratégie qui   implique la sortie du prix   du couloir de prix, qui est spécifié par l'intervalle de temps. Par exemple : la répartition des extremums des séances de négociation Asiatiques, européennes ou Améric
FREE
Valable ZigZag MT5
Sergey Ermolov
5 (6)
Version MT4  | Indicateur Trend Monitor VZ  |   Indicateur Owl Smart Levels   |  Stratégie Owl Smart Levels  |   Comment installer?   |   FAQ La théorie des vagues d'Elliott est une interprétation des processus sur les marchés financiers qui s'appuie sur un modèle visuel des vagues sur les graphiques des prix. L'indicateur valable ZigZag affiche la structure des vagues du marché sur laquelle vous pouvez compter pour prendre des décisions commerciales. L'indicateur Valable ZigZag est plus stable
FREE
Universal Breakout
Sergey Ermolov
4.88 (24)
Paramètres et Rapports |  Version MT5  |  Indicateur de session de trading Universal Box |  Comment installer?  |  FAQ Universal Breakout est un conseiller de négociation sur la stratégie classique de la fourchette de prix de rupture . Il peut être configuré pour n'importe quelle stratégie qui implique la sortie du prix du couloir de prix, qui est spécifié par l'intervalle de temps. Par exemple : la répartition des extremums des séances de négociation Asiatiques, européennes ou Américaines, l
FREE
MiloBot PRO MT5
Sergey Ermolov
5 (2)
Backtests à partir de 2015 |  Version MT4   |  Comment installer?  |  FAQ MiloBot PRO  est un Conseiller Expert Forex basé sur la stratégie  de l'auteur, qui a été développée, testée et optimisée pendant deux ans. L'indicateur de la fiabilité de la stratégie peut être considéré comme les comptes des promoteurs immobiliers dont les  dépôts totalisent plus de 100 000 $ . La stratégie  algorithmique avancée  de MiloBot PRO permet  d'obtenir un profit stable  chaque mois. Les indicateurs de l'auteu
197 USD
Grid Hlevel MT5
Sergey Ermolov
5 (2)
Version MT4  |  Indicateur Valable ZigZag  |   Comment installer?   |   FAQ L'Expert Advisor  Grid HLevel  est parfait pour les traders qui veulent faire un profit stable sur le marché Forex chaque mois. L'Expert Advisor fonctionne selon la stratégie de la moyenne et je vous conseille de l'utiliser correctement. L'utiliser "correctement" signifie ouvrir des transactions avec la moyenne au point de renversement du marché et négocier uniquement dans la direction d'une tendance globale. En ce qui
FREE
Full Fractals MT5
Sergey Ermolov
4.73 (11)
MT4 version  |   Indicateur Owl Smart Levels   |  Stratégie Owl Smart Levels  |   Comment installer?   |   FAQ L'indicateur Fractals   est l'un des éléments de la stratégie commerciale de l'auteur de   Bill Williams . Il est utilisé pour rechercher des points d'inversion des prix sur le graphique des prix et, par conséquent, des niveaux de support et de résistance. L'indicateur Full Fractals   est un Fractals amélioré qui est disponible dans la boîte à outils de presque tous les terminaux de
FREE
MiloBot PRO
Sergey Ermolov
5 (2)
Backtests à partir de 2015 |  Version MT5   |   Comment installer?   |   FAQ MiloBot PRO est un Conseiller Expert Forex basé sur la stratégie de l'auteur, qui a été développée, testée et optimisée pendant deux ans. L'indicateur de la fiabilité de la stratégie peut être considéré comme les comptes des promoteurs immobiliers dont les dépôts totalisent plus de 100 000 $ . La stratégie algorithmique avancée de MiloBot PRO permet d'obtenir un profit stable chaque mois. Les indicateurs de l'auteur pe
197 USD
Full Fractals
Sergey Ermolov
4.67 (6)
MT5 version  |   Indicateur Owl Smart Levels  |  Stratégie Owl Smart Levels  |  Comment installer?   |   FAQ L'indicateur Fractals est l'un des éléments de la stratégie commerciale de l'auteur de Bill Williams . Il est utilisé pour rechercher des points d'inversion des prix sur le graphique des prix et, par conséquent, des niveaux de support et de résistance. L'indicateur Full Fractals est un Fractals amélioré qui est disponible dans la boîte à outils de presque tous les terminaux de trading. S
FREE
Shuttle Runner
Sergey Ermolov
4.55 (11)
La stratégie swing est la base du conseiller Shuttle Runner . La stratégie a été décrite dans la lointaine année 2009 et a été activement utilisée par les traders sur le marché Forex. Shuttle runner est une version modifiée et améliorée de cette stratégie . Recommandations commerciales pour la semaine en cours ici Posez des questions dans le chat ici L'essence principale de la stratégie est la suivante: Le commerce de ce conseiller est seulement  dans les phases actives du marché . Et nous savo
FREE
Universal Box MT5
Sergey Ermolov
5 (3)
Version MT4   |  Comment installer?   |   FAQ  |   EA Universal Breakout   L'Universal Box   trace des   intervalles de prix   sur le graphique qui peuvent être utilisés ultérieurement pour négocier sur un breakout de l'intervalle de prix. Il existe de nombreuses stratégies avec lesquelles vous pouvez appliquer cet indicateur. L'indicateur est configuré par défaut pour marquer les intervalles des   séances de négociation Asiatique, Européenne et Américaine   sur le graphique. Les intervalles so
FREE
Valable ZigZag
Sergey Ermolov
4.4 (5)
Version MT5 | Indicateur Trend Monitor VZ  |  Indicateur Owl Smart Levels   |  Stratégie Owl Smart Levels  |   Comment installer?   |   FAQ La théorie des vagues d'Elliott   est une interprétation des processus sur les marchés financiers qui s'appuie sur un modèle visuel des vagues sur les graphiques des prix.   L'indicateur valable ZigZag   affiche la structure des vagues du marché sur laquelle vous pouvez compter pour prendre des décisions commerciales. L'indicateur Valable ZigZag est plus st
FREE
Grid HLevel
Sergey Ermolov
4.33 (18)
Version MT5  |  Indicateur Valable ZigZag   |  Comment installer?  |   FAQ L'Expert Advisor  Grid HLevel  est parfait pour les traders qui veulent faire un profit stable sur le marché Forex chaque mois. L'Expert Advisor fonctionne selon la stratégie de la moyenne et je vous conseille de l'utiliser correctement. L'utiliser "correctement" signifie ouvrir des transactions avec la moyenne au point de renversement du marché et négocier uniquement dans la direction d'une tendance globale. En ce qui c
FREE
Universal Box
Sergey Ermolov
5 (1)
Version MT5   |  Comment installer?   |   FAQ  |   EA Universal Breakout   L'Universal Box trace des intervalles de prix sur le graphique qui peuvent être utilisés ultérieurement pour négocier sur un breakout de l'intervalle de prix. Il existe de nombreuses stratégies avec lesquelles vous pouvez appliquer cet indicateur. L'indicateur est configuré par défaut pour marquer les intervalles des séances de négociation Asiatique, Européenne et Américaine sur le graphique. Les intervalles sont représe
FREE
Trend Monitor VZ
Sergey Ermolov
5 (3)
Version MT5  | Indicateur Valable ZigZag |   Comment installer?  |   FAQ La théorie des vagues d'Elliott est une interprétation des processus sur les marchés financiers, basée sur le modèle visuel des vagues sur les graphiques de prix. Selon cette théorie, nous pouvons savoir exactement quelle tendance prévaut actuellement sur le marché, ascendante ou descendante. L'indicateur Valable ZigZag montre la structure des vagues du marché et indique la direction de la tendance principale du moment sur
49 USD
Safety
Sergey Ermolov
4.67 (3)
Je pense que tout le monde connaît une telle règle de gestion de l'argent, comme le «coffre-fort». Pour ceux qui ne sont pas au courant, le coffre-fort suggère de fermer la moitié de la position après que le profit sur la transaction a égalisé avec la taille de l'arrêt. Ainsi, même si le prix se déroule et s'accroche à l'arrêt, Vous ne perdrez pas d'argent, car le même montant de profit a été reçu lors de la fermeture d'une partie de la position plus tôt. Safety Advisor n'a qu'un seul paramèt
FREE
Trend Monitor VZ MT5
Sergey Ermolov
5 (1)
Version MT4  |  Indicateur Valable ZigZag  |   Comment installer?  |   FAQ La théorie des vagues d'Elliott  est une interprétation des processus sur les marchés financiers, basée sur le modèle visuel des vagues sur les graphiques de prix. Selon cette théorie, nous pouvons savoir exactement quelle tendance prévaut actuellement sur le marché, ascendante ou descendante. L'indicateur Valable ZigZag  montre  la structure des vagues du marché  et indique la direction de la tendance principale du mome
49 USD
Filtrer:
Thiranai Somjing
22
Thiranai Somjing 2023.05.25 13:07 
 

A nice and simple strategy to follow.

brentbust3
30
brentbust3 2023.05.24 20:53 
 

I love mechanical strategies, this is awesome!

schulz2021
20
schulz2021 2023.05.24 11:09 
 

Excellent indicator. For me it is very easy to understand which trading rules are used. There is enough time to convert the signal into a trade. All markets and different trading activities are supported by different parameters.

manuelm3
43
manuelm3 2023.05.22 19:34 
 

Very good attention, it is a very interesting strategy, it is not a simple indicator, in principle highly recommended.

watju
40
watju 2023.05.09 16:20 
 

Well thought out and comprehensive full strategy. The best thing about it is the corrections it makes, it's constantly evolving and modifying position entries for the best possible result. It's easy to follow and does not overwhelm you. Sergey has put his effort behind this and continues to do so with weekly reviews of the trades on his mql5 blog (not a single losing week). Do yourself a favor and try this out, it'll be worth it...

Enrico Wnendt
882
Enrico Wnendt 2023.04.11 09:12 
 

OWL is not a indicator, its a full strategy. I love it. Its a mechanical strategy without guessing. I like the weekly recaps of his trades, so I can compare with my trades. What I like 1) profitable strategy 2) pending trades - no stress to get in immediately or to miss the trade. No need to sit 24/7 in front of the chart 3) indicator and trade settings are explained and will be shown on the chart 4) you can scale the number of trades up/down (other timeframe and/or more/less pairs) 5) honest basic indicators (zigzag + fractals)

Downsides: you will often miss a trade or close it while it pends resp. is open. This means you have to actively manage your trades

Marcello Catalini
75
Marcello Catalini 2023.04.06 09:56 
 

Buon indicatore, seguite le indicazioni dell'autore. Mi piace perché non ha misteriosi "algoritmi segreti", integra bene indicatori conosciuti in modo chiaro.

Станислав Касьянов
82
 

Хороший индикатор, уже получил первую прибыльную сделку

Répondre à l'avis
Version 2.5 2023.04.27
- Le code de l'indicateur contient les conditions de l'instruction. Maintenant, la plupart des conditions de l'instruction indicateur gère lui-même
- Travail personnalisé avec OWL Helper
Version 2.4 2023.04.13
Ajout de nouvelles notifications sur: suppression des commandes en attente, clôture de la transaction
Version 2.3 2023.03.02
이메일 알림 추가
Version 2.2 2023.02.23
- nouvelle interface conviviale
- nouvelle méthode de calcul
- système de notification mis à jour
- système de signal plus visuel