• Información general
  • Comentarios (97)
  • Discusión (267)
  • Novedades

Trend Screener

4.8

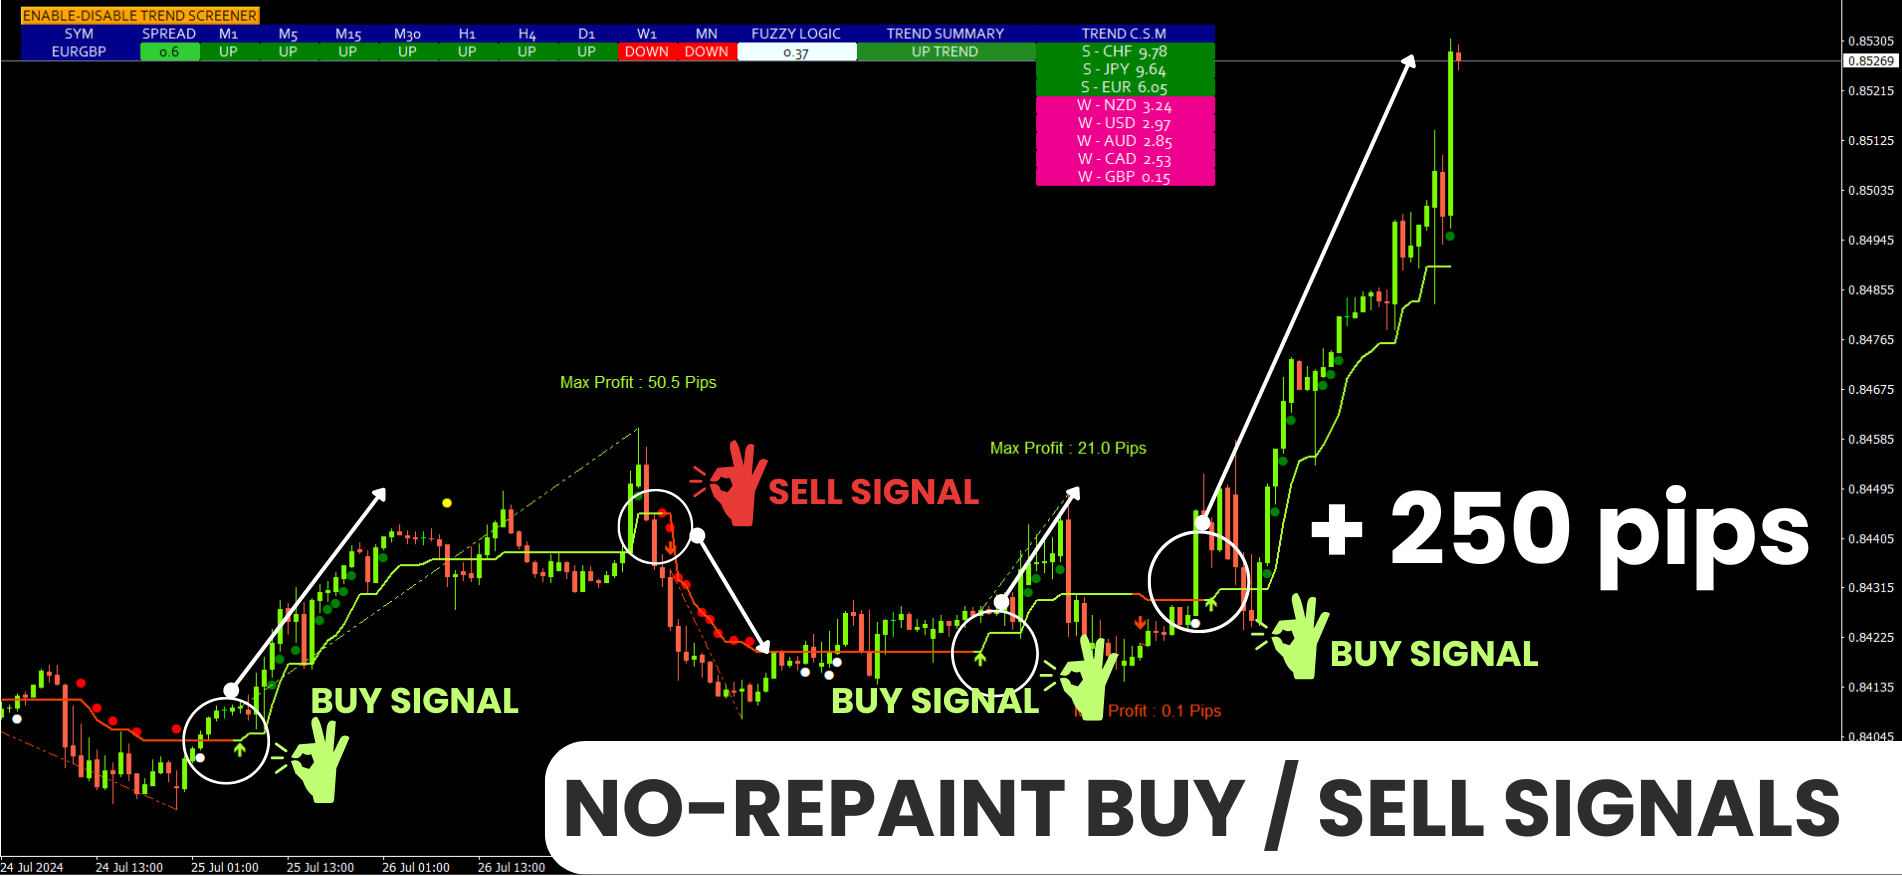
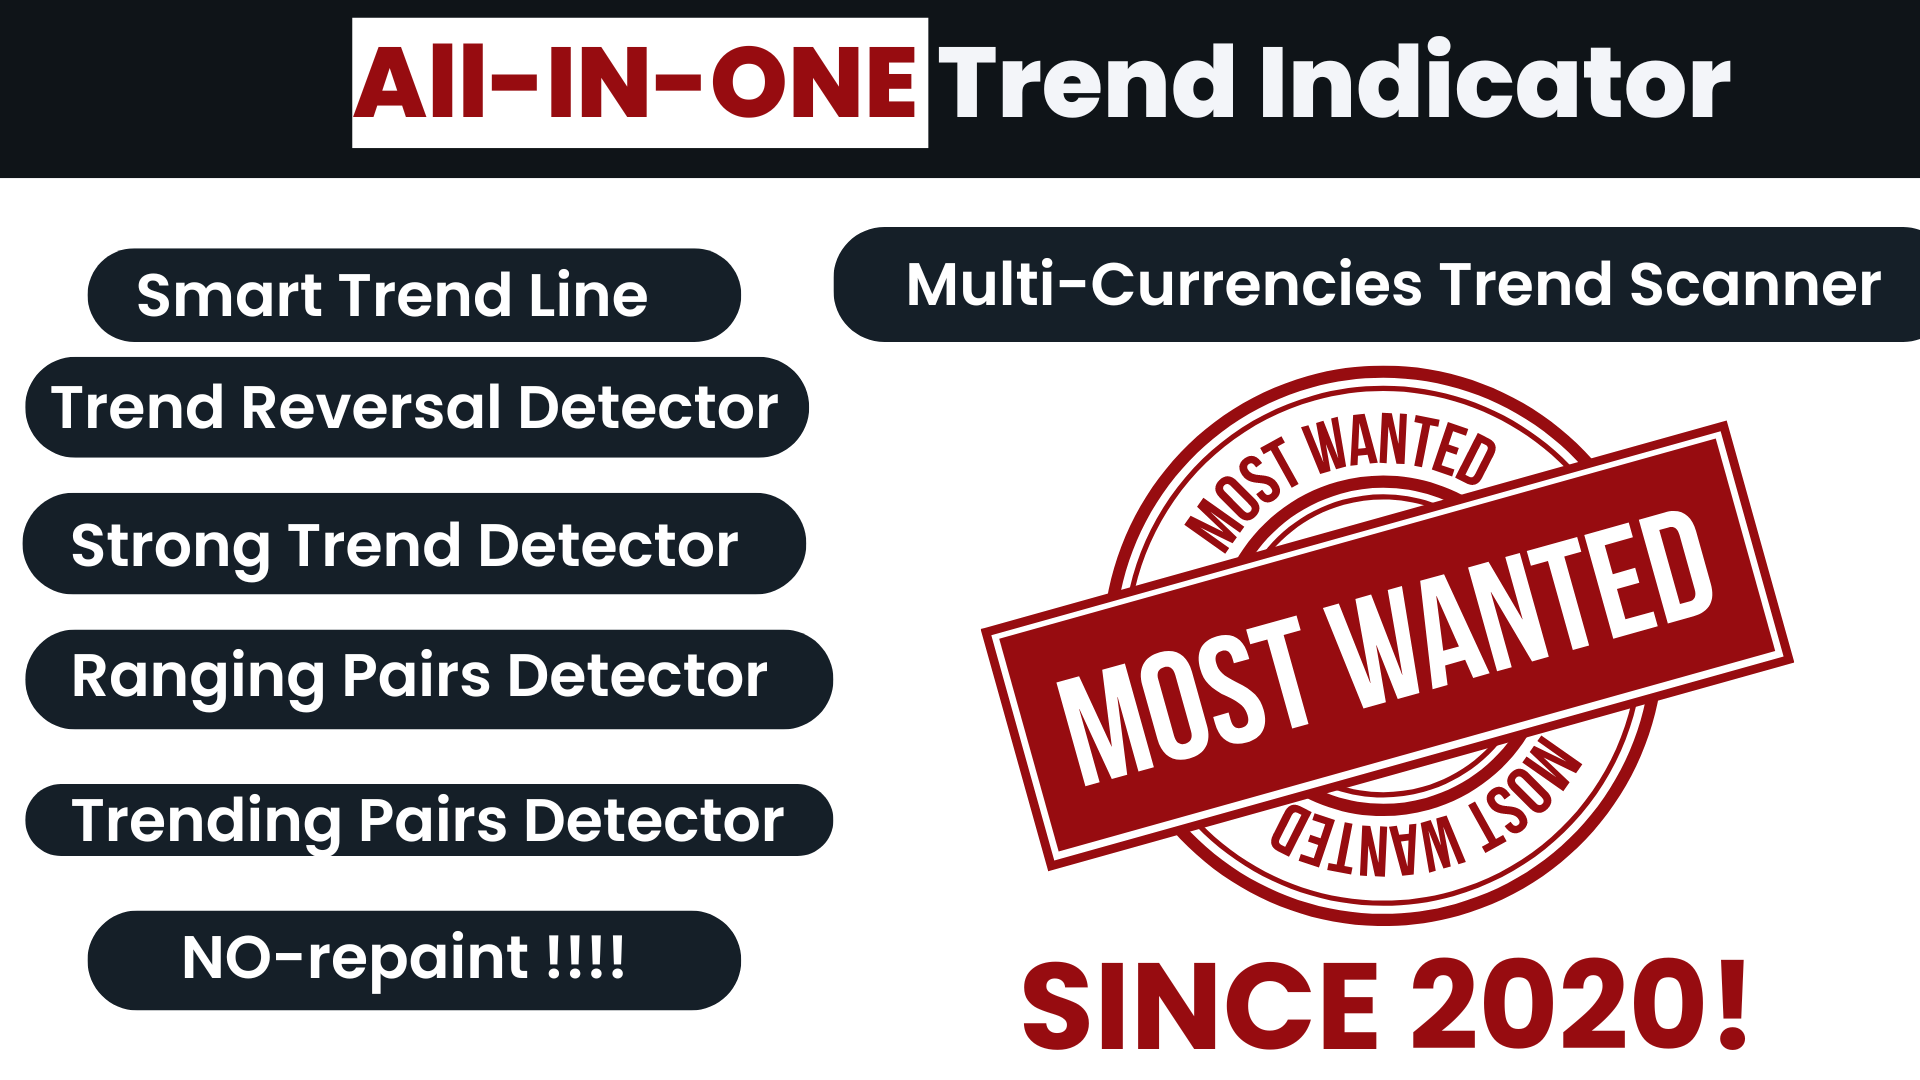
Indicador de tendencia, solución única e innovadora para el comercio y filtrado de tendencias con todas las funciones de tendencias importantes integradas en una sola herramienta. Es un indicador 100% sin repintar de marcos temporales y monedas múltiples que se puede usar en todos los símbolos/instrumentos: divisas, materias primas, criptomonedas, índices y acciones.

OFERTA POR TIEMPO LIMITADO: El indicador de detección de soporte y resistencia está disponible por solo 50$ y de por vida. (Precio original 250 $) (oferta extendida)

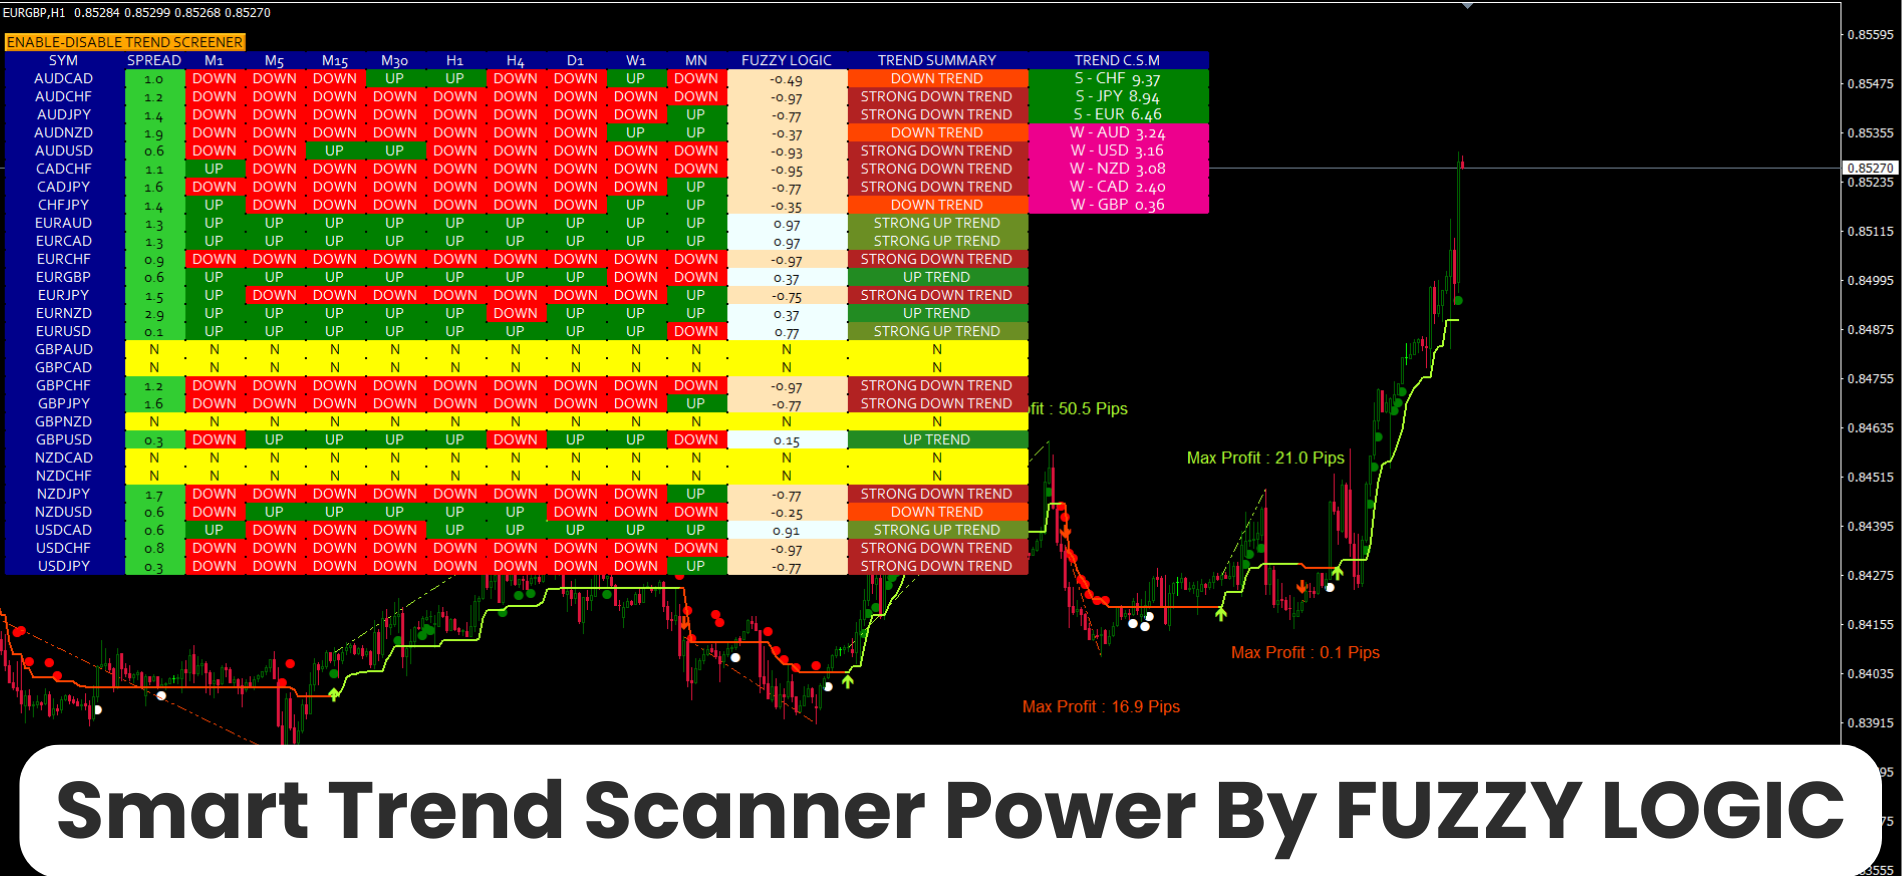
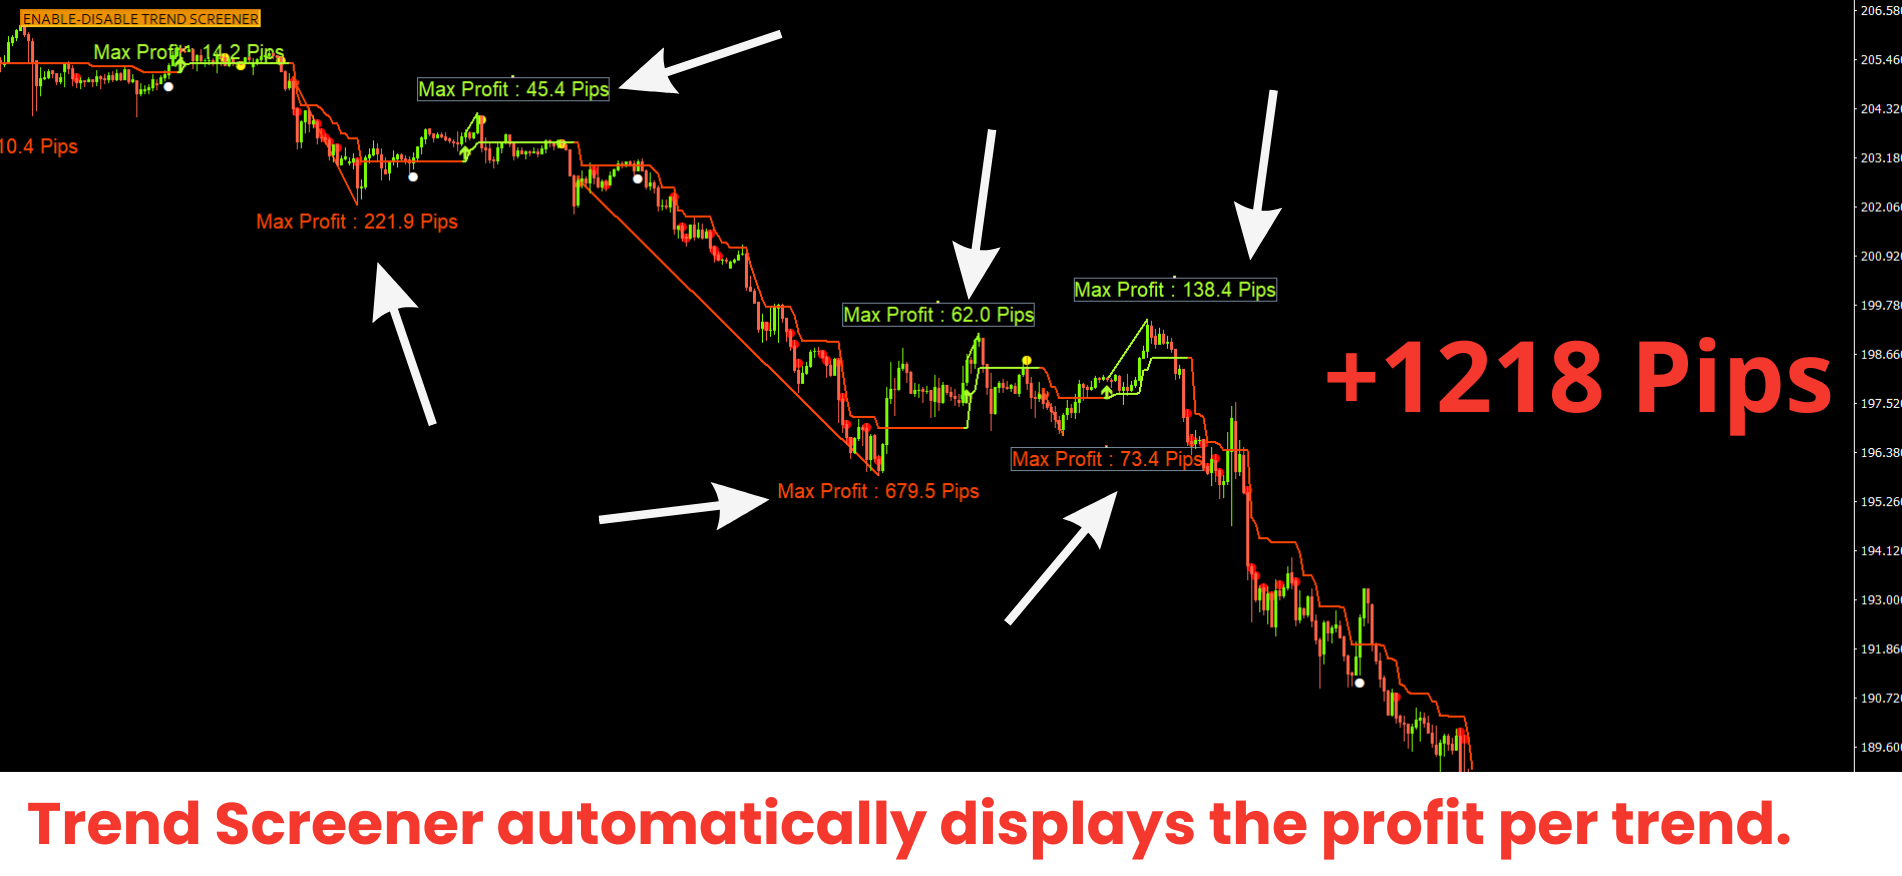
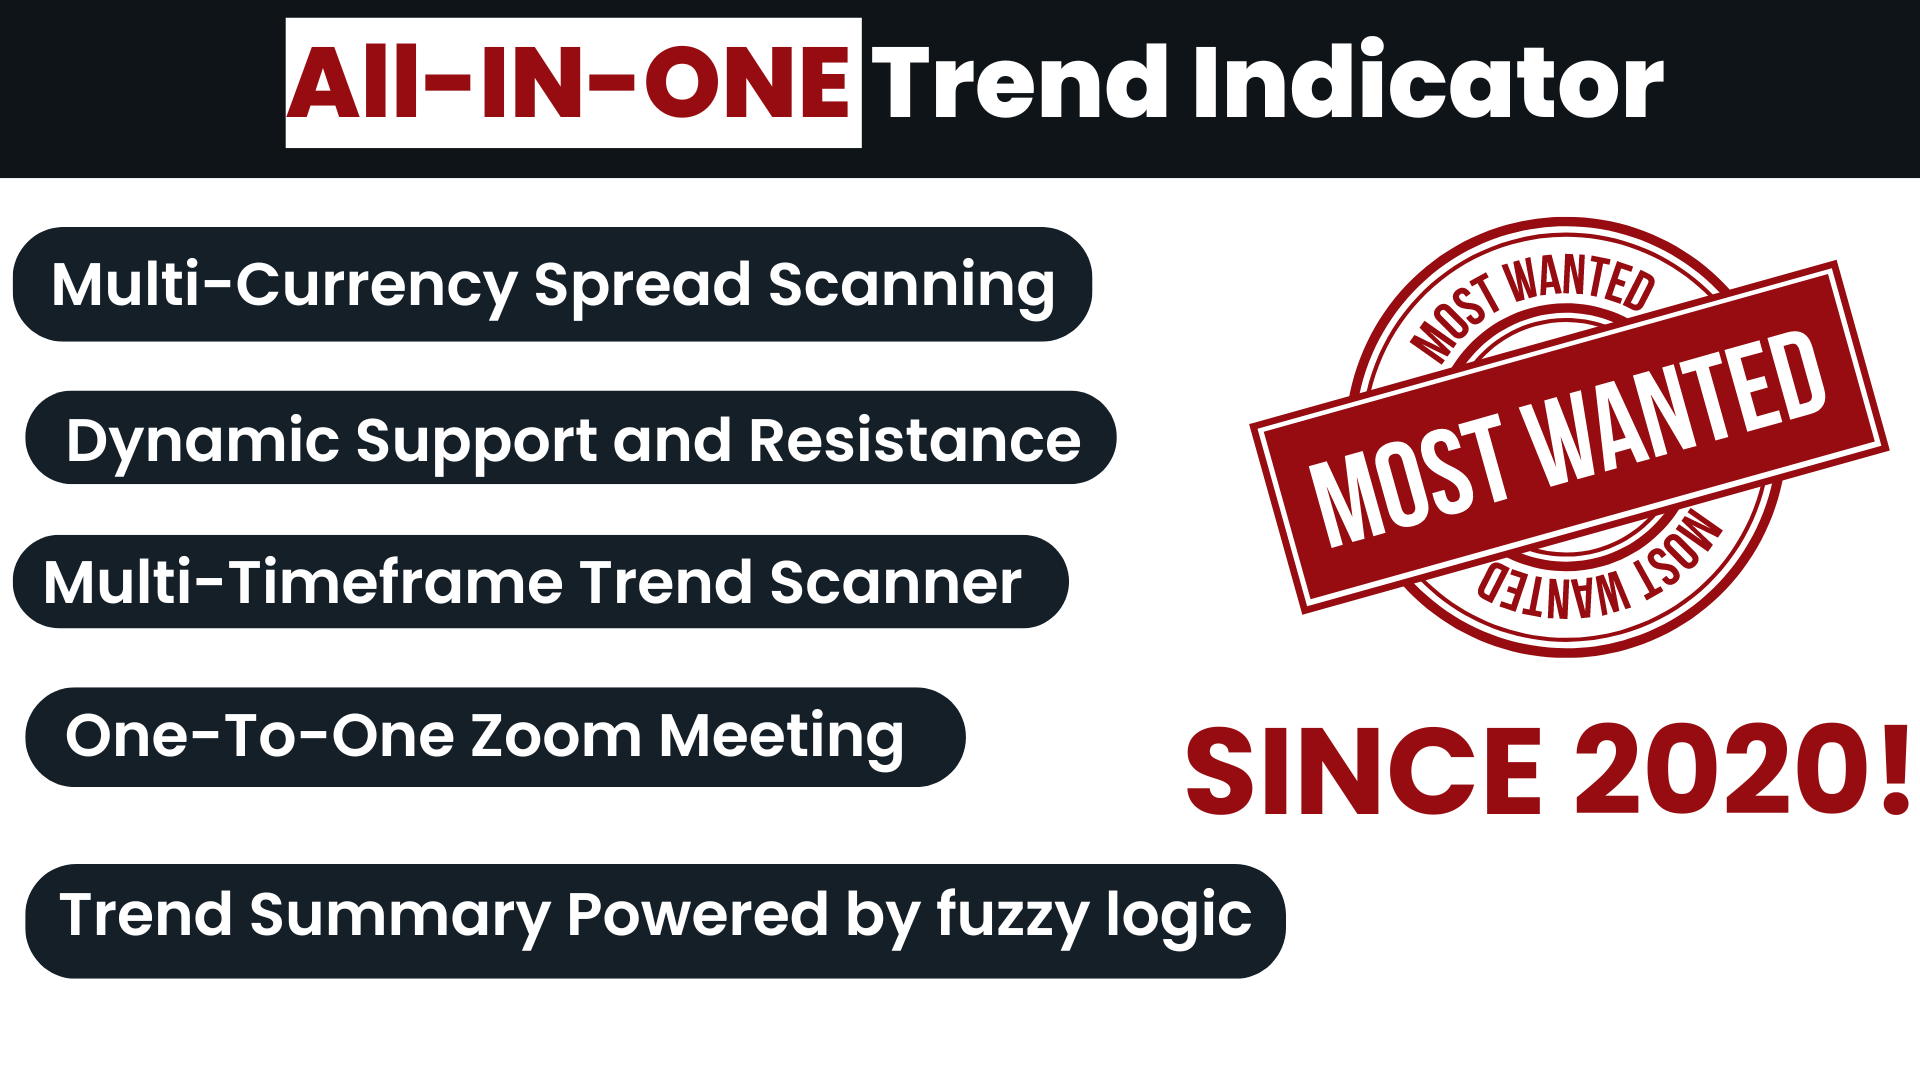
Trend Screener es un indicador de seguimiento de tendencia eficiente que proporciona señales de tendencia de flecha con puntos en el gráfico. Las características que están disponibles en el indicador del analizador de tendencias:

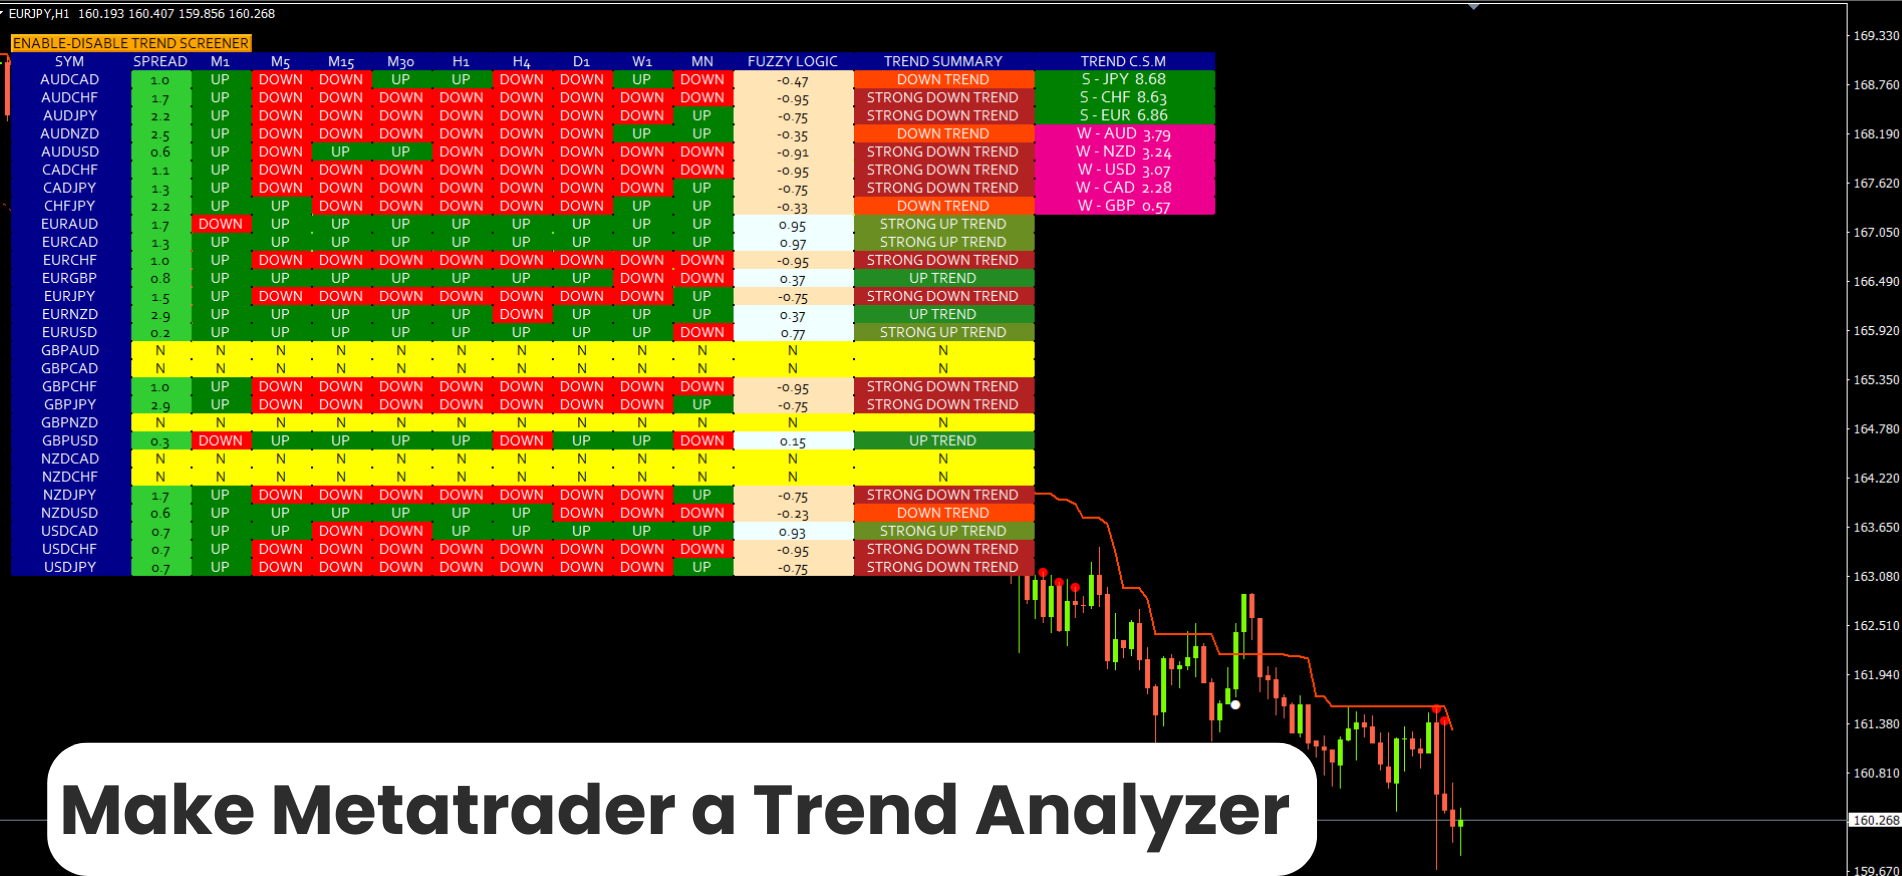
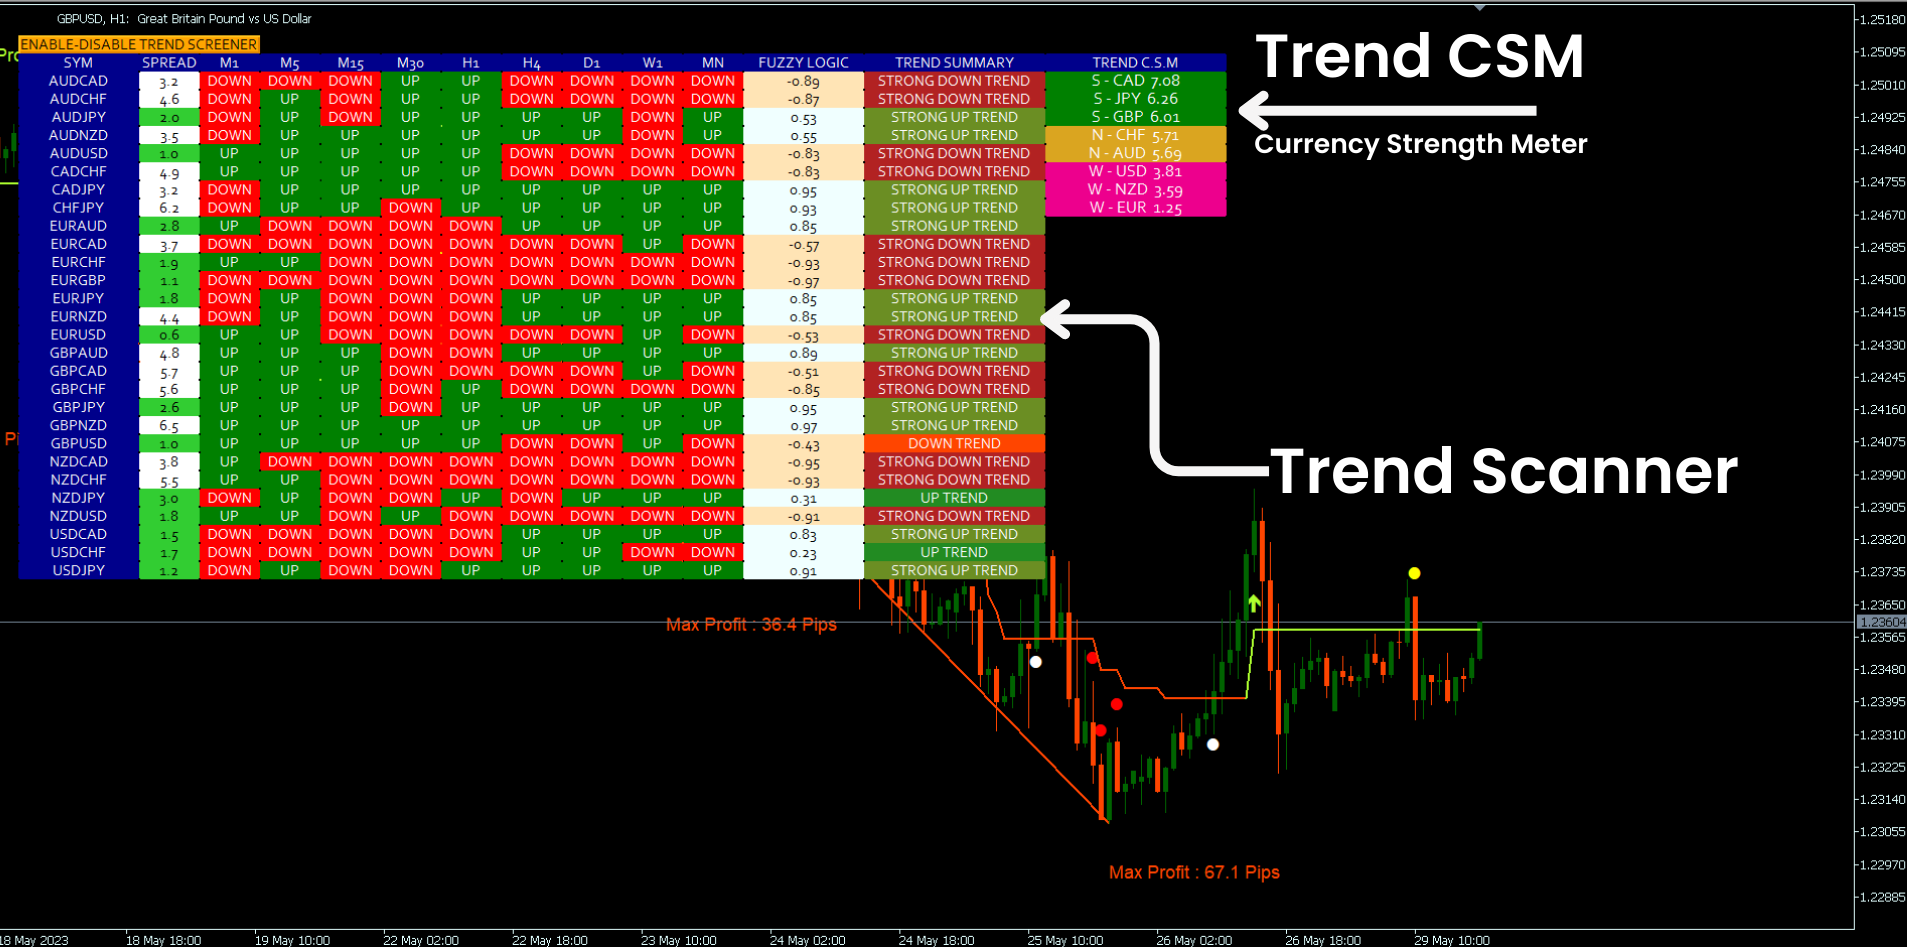
1. Escáner de tendencias.

2. Línea de tendencia con análisis de ganancias máximas.

3. Medidor de fuerza de moneda de tendencia.

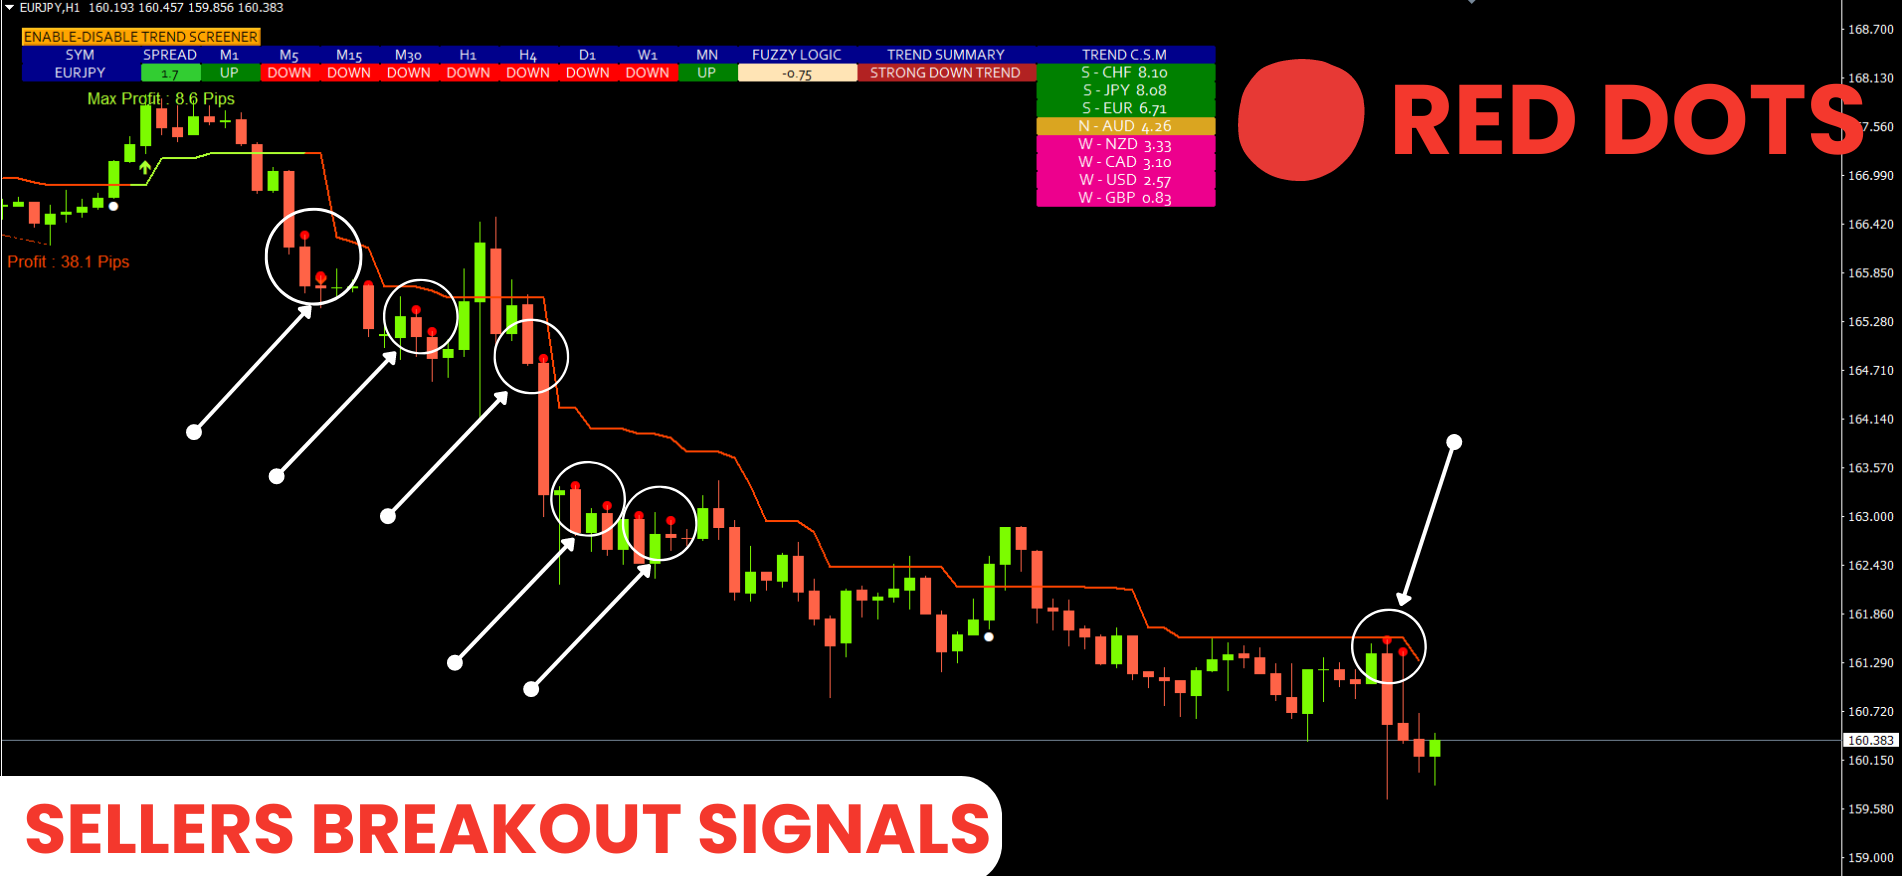
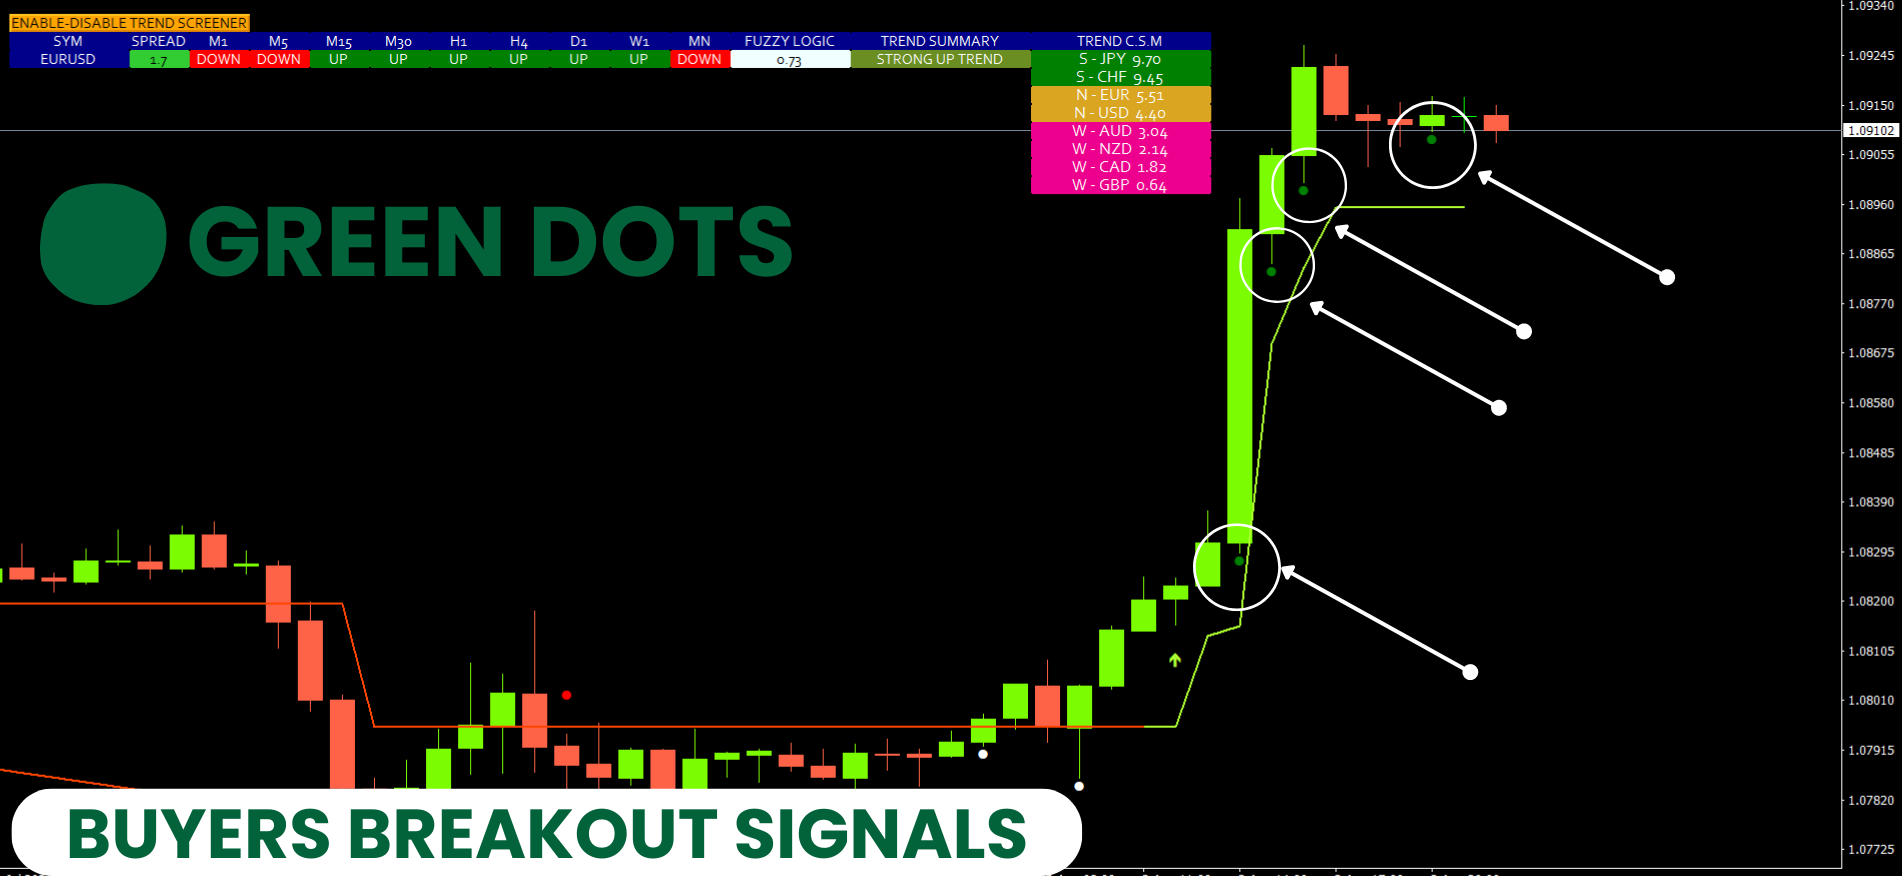
4. Puntos de inversión de tendencia con alertas.

5. Fuertes puntos de tendencia con alertas.

6. Flechas de tendencia

Ejemplos de análisis diarios, rendimiento de la señal diaria... etc. con nuestro indicador de detección de tendencias, se pueden encontrar aquí: Haga clic aquí


OFERTA POR TIEMPO LIMITADO: El indicador Trend Screener está disponible por solo 50 $ y de por vida. (Precio original 125 $)

Accediendo a nuestro Blog MQL5, puede encontrar todos nuestros indicadores premium con ejemplos de análisis, Rendimiento de señal diario ... etc. : Haga clic aquí


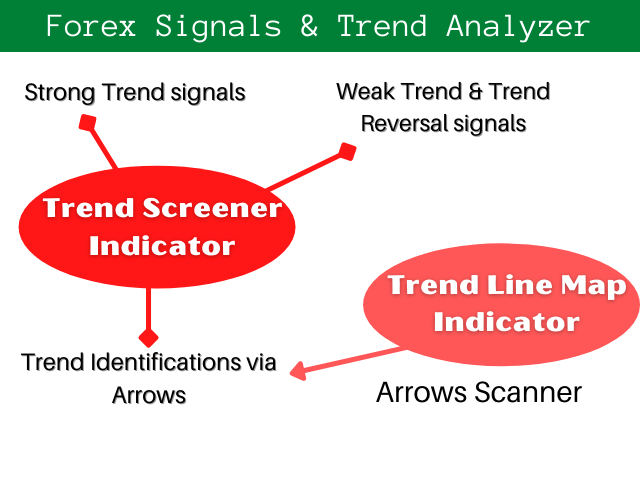
Nuestro sistema de Tendencia compuesto por 2 Indicadores:
1. Trend Screener Indicator: muestra el panel de tendencias, la línea de tendencias en el gráfico, los puntos de entrada, etc.

2. Trend Line Map Indicator: muestra Comprar y Vender como un tablero, las señales activas de ganancias / pérdidas ... etc.

        Descargar indicador de mapa de líneas de tendencia


Vídeos tutoriales de Youtube:

Al consultar nuestro blog de MQL5, encontrará muchos tutoriales en video de YouTube donde explicamos cómo usar y cómo operar con el indicador Trend Screener. Haga clic aquí para encontrar todos los videos.


Características clave

  • Analizador de fuerza de tendencia.
  • Analizador de tendencias de múltiples períodos y monedas.
  • Panel de tendencias
  • Señales de inversión de tendencia. (Señales de puntos)
  • Señales de tendencia fuertes. (Señales de puntos)
  • Línea de tendencia

Documentaciones (Instrucciones)

Toda la documentación de Trend Screener (Instrucciones) y los detalles de la estrategia están disponibles en esta publicación en nuestro Blog de MQL5: Haga clic aquí.


Contacto

Si tiene alguna pregunta o si necesita ayuda, comuníquese conmigo por mensaje privado.


Autor

SAYADI ACHREF, ingeniero de software fintech y fundador de Finansya.


Comentarios 20
Matthew Nathan Brooks
199
Matthew Nathan Brooks 2024.09.04 19:24 
 

This is an amazing indicator. ive used it for 2 weeks on a demo on Gold and the results have been amazing. it took a couple days to get the setting right. but since then its been the best, will try on a demo for another 2 weeks. having a small issue with notification not coming to my phone all the time but thats not a big deal for me..

waqarqureshi1
57
waqarqureshi1 2024.08.05 14:25 
 

Amazing

Nagib Mahfuj Nayem
37
Nagib Mahfuj Nayem 2024.08.02 18:27 
 

This is really Insane. I just used only one week but more than 500 pips made with this indicator with only GOLD. And his support is really top notch. 100% Recommended.

Productos recomendados
Trend Line Map Pro
STE S.S.COMPANY
4.47 (15)
El indicador Trend Line Map es un complemento para Trend Screener Indicator . Funciona como un escáner para todas las señales generadas por el evaluador de tendencias (Trend Line Signals). Es un escáner de líneas de tendencia basado en el indicador de evaluación de tendencias. Si no tiene el indicador Trend Screener Pro, Trend Line Map Pro no funcionará. Al acceder a nuestro blog MQL5, puede descargar la versión gratuita del indicador Trend Line Map. Pruébelo antes de comprar, sin las res
Quantum Heiken Ashi PRO MT4
Bogdan Ion Puscasu
4.33 (6)
Introduciendo el       Gráficos   Quantum Heiken Ashi PRO Diseñadas para brindar información clara sobre las tendencias del mercado, las velas Heiken Ashi son reconocidas por su capacidad para filtrar el ruido y eliminar las señales falsas. Diga adiós a las confusas fluctuaciones de precios y dé la bienvenida a una representación gráfica más fluida y confiable. Lo que hace que Quantum Heiken Ashi PRO sea realmente único es su fórmula innovadora, que transforma los datos de velas tradicionales en
El indicador de color R 2EMA para MT4 proporciona señales comerciales sólidas basadas en el cruce de 2 EMA. Puntos clave Cuando el precio cruza y cierra por encima de los dos EMA verdes, crea una señal comercial de compra. Cuando el precio cruza y cierra por encima de los dos EMA rojos, crea una señal comercial de venta. El indicador R 2EMA Color Forex hace que sea aún más fácil determinar cuándo es el momento de comprar y vender Se produce una señal de compra cuando las 2 líneas de EMA se
High Pass Filter Candlesticks
Safwan Rushdi Khalil Arekat
This indicator applies the  biquad high pass filter to the price-chart data, and displays the filter output for the OHLC as candlesticks. The candlesticks corresponds to the actual calculations of the filter value  during the formation of each price bar (not from all historical highs lows or closes). The shape of the bars therefore corresponds directly to the shape of each price bar. High pass filters are an underappreciated type of oscillator that are seldom used in technical analysis in the st
FREE
Noize Absorption Index MT4
Ekaterina Saltykova
5 (1)
Noize Absorption Index - is the manual trading system that measures the difference of pressure between bears forces and bulls forces. Green line - is a noize free index that showing curent situation. Zero value of index shows totally choppy/flat market.Values above zero level shows how powerfull bullish wave is and values below zero measures bearish forces.Up arrow appears on bearish market when it's ready to reverse, dn arrow appears on weak bullish market, as a result of reverse expectation. S
Daily Candle Predictor es un indicador que predice el precio de cierre de una vela. El indicador está destinado principalmente para su uso en gráficos D1. Este indicador es adecuado tanto para el comercio de divisas tradicional como para el comercio de opciones binarias. El indicador se puede utilizar como un sistema de negociación independiente o puede actuar como una adición a su sistema de negociación existente. Este indicador analiza la vela actual, calculando ciertos factores de fuerza dent
Super Reversal Pattern
Parfait Mujinga Ndalika
Super Reversal Pattern Indicator Unlock the power of advanced pattern recognition with our Super Reversal Pattern Indicator. Designed for traders seeking precision and reliability, this indicator identifies one of the most effective reversal patterns in technical analysis, offering a significant edge in your trading strategy. Key Features: Non-Repainting Accuracy: Enjoy the confidence of non-repainting technology. Once a Super Reversal Pattern is detected, it remains static, providing consis
Dynamic Forex28 Navigator - The Next Generation Forex Trading Tool CURRENTLY 49% OFF. Dynamic Forex28 Navigator is the evolution of our long-time, popular indicators, combining the power of three into one: Advanced Currency Strength28 Indicator  (695 reviews) + Advanced Currency IMPULSE with ALERT  (520 reviews) + CS28 Combo Signals (recent Bonus) Details about the indicator What Does This Next-Generation Strength Indicator Offer? Everything you loved about the originals, now enhanced with ne
MACD Color for GOLD
Chitipat Changsamrit
MACD Color for GOLD  Use for looking moving-way of graph and checking will be buy or sell  Easy for looking by see the color of trand. Red is down / Blue is up.  Can to use it with every time-frame by 1. Long Trade : Use it with time-frame H1 /  H4 /  Daily  2.Short Trade : Use it with  time-frame  M5 / M15  / M 30 /  H1 and you can see when you will open or close the orders by see this indicator by well by see signal line cut with color line again in opposite. and you can use this indicator for
Classic Fractals indicator for MT4, with additional Trendlines connecting the latest couples of fractals ( fractals are showing highest high, and lowest low on each period) Rules for trendlines: -if new top fractal is below the last one = new resistance line -if new bot fractal is above the last one = new support line -Trendlines can be hidden -Fractals can be hidden Fractal Period = can be both even or uneven number, as it is setting for half (one side) of the bars sequence
Binary Options Support Resistance Indicator This indicator is designed for binary options trading and effectively shows retracements from support and resistance levels. Signals appear on the current candle. A red arrow pointing downwards indicates a potential selling opportunity, while a blue arrow pointing upwards suggests buying opportunities. All that needs adjustment is the color of the signal arrows. It is recommended to use it on the M1-M5 timeframes as signals are frequent on these timef
Volume by Price MT4
Brian Collard
4.64 (11)
The Volumebyprice.com Indicator for MetaTrader 4 features Volume Profile and Market Profile TPO (Time Price Opportunity). Volume and TPO histogram bar and line charts. Volume Footprint charts. TPO letter and block marker collapsed and split structure charts. Static, dynamic and flexible range segmentation and compositing methods with relative and absolute visualizations. Session hours filtering and segment concatenation with Market Watch and custom user specifications. Graphical layering, posit
TWO PAIRS SQUARE HEDGE METER INDICATOR Try this brilliant 2 pairs square indicator It draws a square wave of the relation between your two inputs symbols when square wave indicates -1 then it is very great opportunity to SELL pair1 and BUY Pair2 when square wave indicates +1 then it is very great opportunity to BUY pair1 and SELL Pair2 the inputs are : 2 pairs of symbols         then index value : i use 20 for M30 charts ( you can try other values : 40/50 for M15 , : 30 for M30 , : 10 for H1 ,
Power Renko is an indicator which plots Renko bricks underneath the chart using a histogram. You can select the brick size and the timeframe of the Renko bricks as well as whether or not to use the close price or the high/low price of the candles. Renko bricks are based on price alone, not time, therefor the Renko bricks will not be aligned with the chart's time. They are extremely useful for trend trading and many different strategies can be formed from them. Buffers are provided allowing you t
Rapid
Igor Semyonov
The Rapid indicator is a ready binary options trading system . The system is designed for trading on a five-minute interval with the 15-minute expiration and with the payout at least 85%, it is designed for traders using web terminals and MetaTrader 4 platform. Available financial instruments: EURUSD, EURCHF, GBPUSD, GBPJPY, USDJPY and XAGUSD. This is a counter-trend system, i.e. it waits for the price reversal of a traded asset. The indicator signals are not redrawn, they appear after the close
This indicator works on MT4 and is very easy to use. When you receive a signal from it, you wait for that candle with the signal to close and you enter your trade at the beginning of the next new candle . A red arrow means sell and a green arrow means buy. All arrows comes with Alert  like for easy identification of trade signal. Are you okay with that? 1 minute candle 1 minute expire
Indicator for binary options arrow is easy to use and does not require configuration works on all currency pairs, cryptocurrencies buy signal blue up arrow sell signal red down arrow tips do not trade during news and 15-30 minutes before their release, as the market is too volatile and there is a lot of noise it is worth entering trades one or two candles from the current period (recommended for 1 candle) timeframe up to m 15 recommended money management fixed lot or fixed percentage of the depo
YK-Fibo Pivot Indicator: Trade Smarter with Fibonacci Pivot Points The YK-Fibo Pivot Indicator is a powerful technical analysis tool that combines the precision of Fibonacci retracements with the insights of Pivot Points. Whether you're a novice or seasoned trader, this indicator empowers you to spot profitable opportunities in the market with ease. Why Choose YK-Fibo Pivot? Pinpoint Support & Resistance: By calculating Fibonacci levels based on the previous day's high, low, and close prices, y
NEW check the FULL Version Including the private ICT tools limited so far until the release of the full 2016 Mentorship Core Content to the public. Indicator type: Money Management Calculator; Forex Position Size Calculator; Fixed or ATR value for Stop Loss and Take Profit levels; Average Position Size Indicator (True Average Price); Acc ount Information; Stop-out Level, Margin and Risk Exposure Warning, Forex Sessions; Institutional Levels Grid; Major Highs and Lows, Detailed Account Report an
A Boss Stats
Anthonius Soruh
Hi Trader, We are strategy development for Binary and Forex tools, our product have success for binary trading 1 min - 2 min experation. At the moment I build indicator for trading all day, not like Bonosu series with specific time. We launch A-Boss Stats Indicator for trading 1 minute to 5 minutes experation is mean can trade from 1 minutes - 5 minutes. Specification of A Boss Stats trading binary option: Work with all MT4 broker. Chart Time Frame M1 only, can use M5 Experation time for contact
This is a new strategy for SUPPLY DEMAND areas It is based on a calculation using the tick volume to detect the big price action in market for both bear /bull actions this smart volume action candles are used to determine the supply and demand areas prices in between main supply and demand lines indicate sideway market  up arrows will be shown when prices moves above the main supply and the secondary supply lines Down arrows will be shown when prices moves below the main demand and the secondary
5 signal in 1  Product     TimeFrame   Recommend   1m-5m recommend  signal   TF  5m    Banks Pro Binary Option is Indicator for binary option Can Use Manaul Trade or Robot on Platform  Mt2Trading  https://www.mt2trading.com/?ref=104    Time Trading   good work  EU session    Recommend  Curency   EUR  GBP USD        careful   AUD JPY      Recommend  Martingale 2-5 Step   Recommend  set profit  2%-5%/Day Setting Brake  News Event High volatility   recommend  15-30 min Have Problem Contract
Advanced Stochastic Scalper - is a professional indicator based on the popular Stochastic Oscillator. Advanced Stochastic Scalper is an oscillator with dynamic overbought and oversold levels, while in the standard Stochastic Oscillator, these levels are static and do not change. This allows Advanced Stochastic Scalper to adapt to the ever-changing market. When a buy or a sell signal appears, an arrow is drawn on the chart and an alert is triggered allowing you to open a position in a timely mann
MA Alignment Scanner
Benedict Jamora
5 (1)
This indicator scans and displays currency pairs that have recently aligned moving averages on a given timeframe. You can configure which pairs the indicator will scan. It also includes all types of alert options. Bullish MA Alignment =  MA1>MA2>MA3>MA4>MA5 Bearish MA Alignment =  MA1<MA2<MA3<MA4<MA5 Features Attach to one chart and scans all the currency pairs configured and visible in the Market Watch Window It can monitor all the available timeframes from M1 to MN1 and sends alerts on ever
VR Cub
Vladimir Pastushak
VR Cub es un indicador para obtener puntos de entrada de alta calidad. El indicador fue desarrollado para facilitar los cálculos matemáticos y simplificar la búsqueda de puntos de entrada a una posición. La estrategia comercial para la cual se diseñó el indicador ha demostrado su eficacia durante muchos años. La simplicidad de la estrategia comercial es su gran ventaja, que permite que incluso los operadores novatos negocien con éxito con ella. VR Cub calcula los puntos de apertura de posiciones
This indicator is a conventional analytical tool for tick volumes changes. It calculates tick volumes for buys and sells separately, and their delta on every bar, and displays volumes by price clusters (cells) within a specified bar (usually the latest one). The algorithm used internally is the same as in the indicator VolumeDelta , but results are shown as cumulative volume delta bars (candlesticks). Analogous indicator for MetaTrader 5 exists - VolumeDeltaBars . This is a limited substitution
Shark Trading
Yaroslav Varankin
The indicator is designed to trade binary options on small time frames up to m 30 Signals The blue up arrow is a buy signal. The red dn arrow is a sell signal. The signal will appear together with the advent of a new candle  and during formation Signals on the current candle Expiration time one candle from the timeframe on which you are trading You can use moving average to filter out false signals. Or escort support levels. This tool is reliable in trading.
Скрипт собирает размеры всех ценовых волн на текущем графике, которые не меньше заданной величины, и сохраняет их в CSV файл. Каждая строка таблицы будет содержать дату/время окончания волны и ее размер. Если вам нужно знать размеры волн в реальном времени, то воспользуйтесь индикатором Wave Size into ZigZag , Wave Size Histogram  или ZZ Histogram . ПАРАМЕТРЫ MinWaveSize:  минимальный размер дял волн, которые попадут в статистику PositiveValues:   true  - в файл сохраняется только размер вол
indicator for trading binary options and forex trading. The indicator does not redraw the readings. when trading binary options, testing was performed. This indicator showed the good results correct predictions. Under these conditions, the eur / usd m1 chart, when a signal appears, the transaction opens in the direction indicated by the indicator for 5 candles, then the truth is (5 minutes since in us the 1-minute chart of a candlestick is 1 minute) the result was. When trading in the forex
ROYAL DUTCH SKUNK USES THE TREND WAVE INDICATOR AND IT CAN IDENTIFY THE BEGINNING AND THE END OF A NEW WAVE TREND MOVEMENT. AS AN OSCILLATOR, THE INDICATOR IDENTIFIES THE OVERBOUGHT AND OVERSOLD ZONES. IT WORKS GREAT TO CATCH THE SHORT TERM PRICE REVERSALS AND USES A MARTINGALE STRATEGY TO CLOSE ALL TRADES IN PROFIT. USE DEFAULT SETTINGS ON H1 OR HIGHER TIME FRAME ON ANY PAIR FOR MORE ACCURATE TRADES WHY THIS EA : Smart entries calculated by 6 great strategies The EA can be run on even a $20000
Los compradores de este producto también adquieren
Gann Made Easy
Oleg Rodin
4.85 (82)
Gann Made Easy es un sistema de comercio de Forex profesional y fácil de usar que se basa en los mejores principios de comercio utilizando la teoría del Sr. W. D. Gann. El indicador proporciona señales precisas de COMPRA y VENTA, incluidos los niveles de Stop Loss y Take Profit. Puede comerciar incluso sobre la marcha utilizando notificaciones PUSH. ¡Por favor, póngase en contacto conmigo después de la compra! ¡Compartiré mis consejos comerciales con usted y excelentes indicadores de bonificació
TPSpro RFI Levels
Roman Podpora
4.82 (22)
反转第一脉冲水平 (RFI)     指示     俄羅斯     -        ESP   Recomendamos utilizar con   el indicador -   TPSpro 趋势专业版 -   MT5版本 Un elemento clave importante en el comercio son las zonas o niveles a partir de los cuales se toman decisiones para comprar o vender un instrumento comercial. A pesar de los intentos de los grandes actores de ocultar su presencia en el mercado, inevitablemente dejan rastros. Nuestra tarea era aprender a encontrar estos rastros e interpretarlos correctamente. Funciones principales:
Atomic Analyst
Issam Kassas
5 (2)
En primer lugar, vale la pena enfatizar que este Indicador de Trading no repinta, no redibuja y no se retrasa, lo que lo hace ideal tanto para el trading manual como para el automatizado. Manual del usuario: configuraciones, entradas y estrategia. El Analista Atómico es un Indicador de Acción del Precio PA que utiliza la fuerza y el impulso del precio para encontrar una mejor ventaja en el mercado. Equipado con filtros avanzados que ayudan a eliminar ruidos y señales falsas, y aumentan el poten
Trend Punch
Mohamed Hassan
4.95 (19)
This indicator is unstoppable when combined with our other indicator called  Support & Resistance . After purchase, send us a message and you will get it   for  FREE as a BONUS! Introducing Trend Punch , the revolutionary forex trend indicator that will transform the way you trade! Trend Punch is uniquely designed to provide precise buy and sell arrows during strong market trends, making your trading decisions clearer and more confident. Whether you're trading major currency pairs or exotic sym
TPSproTREND PrO
Roman Podpora
4.79 (19)
TPSpro TREND PRO   es un indicador de tendencia que analiza automáticamente el mercado y proporciona información sobre la tendencia y cada uno de sus cambios, además de dar señales para ingresar operaciones sin volver a dibujar. El indicador utiliza cada vela, analizándolas por separado. refiriéndose a diferentes impulsos: impulso hacia arriba o hacia abajo. ¡Puntos de entrada exactos a transacciones de divisas, criptomonedas, metales, acciones e índices! Versión MT5                   DESCRIPCI
Scalper Inside PRO
Alexey Minkov
4.73 (56)
An exclusive indicator that utilizes an innovative algorithm to swiftly and accurately determine the market trend. The indicator automatically calculates opening, closing, and profit levels, providing detailed trading statistics. With these features, you can choose the most appropriate trading instrument for the current market conditions. Additionally, you can easily integrate your own arrow indicators into Scalper Inside Pro to quickly evaluate their statistics and profitability. Scalper Inside
FX Power MT4 NG
Daniel Stein
5 (12)
Obtenga su actualización diaria del mercado con detalles y capturas de pantalla a través de nuestro Morning Briefing aquí en mql5 y en Telegram ! FX Power MT4 NG es la nueva generación de nuestro popular medidor de fuerza de divisas, FX Power. ¿Y qué ofrece este medidor de fuerza de nueva generación? Todo lo que le encantaba del FX Power original PLUS Análisis de fuerza de ORO/XAU Resultados de cálculo aún más precisos Períodos de análisis configurables individualmente Límite de cálculo persona
¡Actualmente 20% OFF ! ¡La mejor solución para cualquier novato o trader experto! Este software funciona con 28 pares de divisas. Se basa en 2 de nuestros principales indicadores (Advanced Currency Strength 28 y Advanced Currency Impulse). Proporciona una gran visión general de todo el mercado de divisas. Muestra los valores de Advanced Currency Strength, la velocidad de movimiento de las divisas y las señales para 28 pares de divisas en todos los (9) marcos temporales. Imagine cómo mejorar
FX Volume
Daniel Stein
4.58 (33)
Obtenga su actualización diaria del mercado con detalles y capturas de pantalla a través de nuestro Morning Briefing aquí en mql5 y en Telegram ! FX Volume es el PRIMER y ÚNICO indicador de volumen que proporciona una visión REAL del sentimiento del mercado desde el punto de vista de un bróker. Proporciona una visión impresionante de cómo los participantes institucionales del mercado, como los brokers, están posicionados en el mercado Forex, mucho más rápido que los informes COT. Ver esta info
ACTUALMENTE 31% DE DESCUENTO Este indicador es una herramienta de transacción única, de alta calidad y asequible porque hemos incorporado una serie de características propias y una fórmula secreta. Con solo un gráfico, da Alertas para los 28 pares de divisas. ¡Imagina cómo mejorarás porque puedes identificar el punto de activación exacto de una nueva tendencia u oportunidad de crecimiento! Basado en nuevos algoritmos subyacentes , hace que sea aún más fácil identificar y confirmar operaciones po
Enigmera
Ivan Stefanov
5 (3)
ENIGMERA: El núcleo del mercado https://www.enigmera.com Introducción Este indicador y sistema de negociación es un enfoque extraordinario de los mercados financieros. ENIGMERA utiliza los ciclos fractales para calcular con precisión los niveles de soporte y resistencia. Muestra la auténtica fase de acumulación y proporciona dirección y objetivos.  Un sistema que funciona tanto si estamos en una tendencia como en una corrección.  ¿Cómo funciona? ENIGMERA consta de tres líneas: la línea de s
ACTUALMENTE 26% DE DESCUENTO ¡La mejor solución para cualquier operador novato o experto! Este indicador es una herramienta única, de alta calidad y asequible porque hemos incorporado una serie de características propias y una nueva fórmula. ¡Con sólo UN gráfico puede leer la Fuerza de la Divisa para 28 pares de Divisas! Imagínese cómo mejorará su operativa porque podrá señalar el punto exacto de activación de una nueva tendencia o de una oportunidad de scalping. Manual del usuario: haga
Bomb Bank Signal
Igor Pereira Calil
5 (1)
Señal de Bomb Bank: su indicador de confianza en MetaTrader 4 Bomb Bank Signal es un poderoso indicador para MetaTrader 4, diseñado para identificar las tendencias más relevantes en el mercado financiero. Si buscas una herramienta que anticipe los movimientos con precisión, el Bomb Bank es el aliado que necesitas. Cómo funciona: Este indicador combina tres métodos distintos (análisis de volumen, cierre de velas y tendencia simétrica) para detectar y señalar oportunidades de compra y venta
Trend Cutter
Oleg Rodin
5 (2)
Trend Cutter es un indicador de tendencia que se puede utilizar con cualquier período de tiempo, incluidos los períodos de tiempo más bajos como M1 y M5. El indicador es ideal para los operadores que prefieren el comercio intradiario y también será útil para aquellos que prefieren el comercio a largo plazo. Puede utilizar este indicador como base para su sistema comercial o como una solución comercial independiente. El indicador proporciona todo tipo de alertas, incluidas notificaciones PUSH. El
TakePropips Donchian Trend Pro
Eric John Pajarillaga Aldana
4.44 (16)
¡TakePropips Donchian Trend Pro   (MT4) es una herramienta poderosa y efectiva que detecta automáticamente la dirección de la tendencia utilizando el Canal Donchian y le proporciona señales comerciales de entrada y salida! Este indicador multifunción incluye un escáner de tendencias, señales comerciales, panel estadístico, filtro, sesiones comerciales y panel de historial de alertas. ¡Está diseñado para proporcionarle señales comerciales y ahorrarle horas analizando los gráficos! Puede descargar
Gold Channel is a volatility-based indicator, developed with a specific timing algorithm for the XAUUSD pair, which consists of finding possible corrections in the market. This indicator shows two outer lines, an inner line (retracement line) and an arrow sign, where the theory of the channel is to help identify overbought and oversold conditions in the market. The market price will generally fall between the boundaries of the channel. If prices touch or move outside the channel it is a tra
Advanced Supply Demand
Bernhard Schweigert
4.91 (294)
¡Actualmente con 33% de descuento! ¡La mejor solución para cualquier tráder principiante o experto! Este indicador es una herramienta comercial única, de alta calidad y asequible, porque incorpora una serie de características patentadas y una nueva fórmula. Con esta actualización, podrá mostrar zonas de doble marco temporal. No solo podrá mostrar un marco temporal más alto, sino también mostrar ambos, el marco temporal del gráfico MÁS el marco temporal más alto: MOSTRANDO ZONAS ANIDADAS. A todos
Currency Strength Wizard es un indicador muy poderoso que le proporciona una solución todo en uno para operar con éxito. El indicador calcula el poder de este o aquel par de divisas utilizando los datos de todas las monedas en múltiples marcos de tiempo. Estos datos se representan en forma de índice de moneda fácil de usar y líneas eléctricas de moneda que puede usar para ver el poder de esta o aquella moneda. Todo lo que necesita es adjuntar el indicador al gráfico que desea operar y el indicad
Order Block Hunter
Noha Mohamed Fathy Younes Badr
5 (4)
Order block hunter indicator is the best indicator for  hunt the order blocks that area where there has been a large concentration of limit orders waiting to be executed Order blocks are identified on a chart by observing previous price action and looking for areas where the price experienced significant movement or sudden changes in direction .This indicator does that for you by using very complicated codes and helps you to take the best areas To buy and sell because it make marks at the best a
El sistema PRO Renko es un sistema de trading de alta precisión especialmente diseñado para operar gráficos RENKO. Se trata de un sistema universal que se puede aplicar a diversos instrumentos de negociación. El sistema neutraliza eficazmente el llamado ruido de mercado, lo que le brinda acceso a señales de reversión precisas. El indicador es muy fácil de usar y solo tiene un parámetro responsable de la generación de señales. Puede adaptar fácilmente la herramienta a cualquier instrumento com
Trend Pulse
Mohamed Hassan
5 (4)
Please contact me after purchase to immediately get your PDF strategy + documentation for Trend Pulse !  Introducing Trend Pulse , a unique and robust indicator capable of detecting bullish, bearish, and even ranging trends! Trend Pulse uses a special algorithm to filter out market noise with real precision. If the current symbol is moving sideways, Trend Pulse will send you a ranging signal, letting you know that it's not a good time to enter a trade. This excellent system makes Trend Pulse
Ante todo, vale la pena enfatizar que esta Herramienta de Trading es un Indicador No Repintado, No Redibujado y No Retrasado, lo que la hace ideal para el trading profesional. Curso en línea, manual del usuario y demostración. El Indicador de Conceptos de Acción del Precio Inteligente es una herramienta muy potente tanto para traders nuevos como experimentados. Combina más de 20 indicadores útiles en uno solo, combinando ideas avanzadas de trading como el Análisis del Trader del Círculo Interio
M1 Arrow
Oleg Rodin
4.73 (15)
Una estrategia intradía basada en dos principios fundamentales del mercado. El algoritmo se basa en el análisis de volúmenes y ondas de precios utilizando filtros adicionales. El algoritmo inteligente del indicador da una señal solo cuando dos factores de mercado se combinan en uno. El indicador calcula ondas de cierto rango en el gráfico M1 utilizando los datos del marco de tiempo más alto. Y para confirmar la onda, el indicador utiliza el análisis por volumen. Este indicador es un sistema come
PZ Day Trading
PZ TRADING SLU
3.67 (3)
Este indicador detecta reversiones de precios en forma de zig-zag, utilizando solo análisis de acción de precios y un canal donchian. Ha sido diseñado específicamente para el comercio a corto plazo, sin repintar ni pintar en absoluto. Es una herramienta fantástica para comerciantes astutos con el objetivo de aumentar el tiempo de sus operaciones. [ Guía de instalación | Guía de actualización | Solución de problemas | FAQ | Todos los productos ] Increíblemente fácil de comerciar Proporciona
Supply and Demand Dashboard PRO
Bernhard Schweigert
4.8 (20)
¡Actualmente 20% OFF ! Este tablero de instrumentos es una pieza muy poderosa de software de trabajo en múltiples símbolos y hasta 9 marcos de tiempo. Se basa en nuestro indicador principal (Mejores críticas: Advanced Supply Demand ).  El tablero de instrumentos da una gran visión general. Se muestra:  Valores filtrados de Oferta y Demanda, incluyendo la calificación de fuerza de la zona, Pips distancias a / y dentro de las zonas, Destaca las zonas anidadas, Da 4 tipos de alertas para los s
True Direction Oscillator
Muhammad Elbermawi
4.86 (362)
O (TDO), que es un índice que mide la tasa de cambio de precios utilizando el principio de " Pure Momentum ". Cuando el precio de un valor aumenta de 10 a 15, la tasa de cambio del precio es del 150%, pero cuando baja de 15 a 10, la tasa de cambio del precio es solo del 33,3%. Es por eso que los indicadores de análisis técnico como "Tasa de cambio de precio" (ROC) o "Momentum" dan lecturas más altas para los movimientos de precios ascendentes que las dadas para los descendentes. TDO soluciona e
¡Descubra el secreto para el comercio de Forex exitoso con nuestro indicador MT4 personalizado! ¿Alguna vez se ha preguntado cómo lograr el éxito en el mercado de Forex, obteniendo ganancias constantemente al tiempo que minimiza el riesgo? ¡Aquí está la respuesta que ha estado buscando! Permítanos presentar nuestro indicador MT4 patentado que revolucionará su enfoque para el comercio. Versatilidad única Nuestro indicador está especialmente diseñado para usuarios que prefieren las formacio
¡LEA LA INFORMACIÓN A CONTINUACIÓN ANTES DE COMPRAR EL PRODUCTO! ¡Apollo Pips PLUS SP es un producto único! ¡ES PARA AQUELLOS QUE QUIEREN OBTENER MI NUEVO INDICADOR "APOLLO PIPS" MÁS BONO "SUPER PACK" CON ACCESO A TODOS MIS INDICADORES COMERCIALES! Al comprar el producto Apollo Pips PLUS SP, en realidad está comprando una versión absolutamente nueva de mi indicador Apollo Pips. Esta versión del indicador tiene un algoritmo mejorado y un parámetro fácil de usar que le brinda la oportunidad de uti
Currency Strength Exotics
Bernhard Schweigert
4.87 (30)
¡ACTUALMENTE 20% DE DESCUENTO ! ¡La mejor solución para cualquier operador novato o experto! Este indicador está especializado en mostrar la fuerza de la divisa para cualquier símbolo como Pares Exóticos, Materias Primas, Índices o Futuros. Es el primero de su clase, cualquier símbolo se puede añadir a la 9 ª línea para mostrar la verdadera fuerza de la moneda de Oro, Plata, Petróleo, DAX, US30, MXN, TRY, CNH etc. Se trata de una herramienta de trading única, de alta calidad y asequible por
Este tablero muestra los últimos patrones armónicos disponibles para los símbolos seleccionados, por lo que ahorrará tiempo y será más eficiente / versión MT5 . Indicador gratuito: Basic Harmonic Pattern Columnas del indicador Symbol: aparecerán los símbolos seleccionados Trend : alcista o bajista Pattern : tipo de patrón (gartley, mariposa, murciélago, cangrejo, tiburón, cifrado o ABCD) Entry : precio de entrada SL: precio de stop loss TP1: 1er precio de toma de beneficios TP2: 2º precio de
Otros productos de este autor
Trend Screener Pro MT5
STE S.S.COMPANY
4.87 (62)
Desbloquee el poder del comercio de tendencias con el indicador Trend Screener: ¡su solución definitiva para el comercio de tendencias impulsada por lógica difusa y un sistema multidivisa!Mejore su comercio de tendencias con Trend Screener, el revolucionario indicador de tendencias impulsado por lógica difusa. Es un poderoso indicador de seguimiento de tendencias que combina más de 13 herramientas y funciones premium y 3 estrategias comerciales, lo que lo convierte en una opción versátil para co
Support Resistance screnner
STE S.S.COMPANY
4.97 (35)
Support And Resistance Screener está en un indicador de nivel para MetaTrader que proporciona múltiples herramientas dentro de un indicador. Las herramientas disponibles son: 1. Cribador de estructura de mercado. 2. Zona de retroceso alcista. 3. Zona de retroceso bajista. 4. Puntos pivotes diarios 5. Puntos de pivote semanales 6. Puntos Pivotes mensuales 7. Fuerte soporte y resistencia basado en patrón armónico y volumen. 8. Zonas de nivel de banco. OFERTA POR TIEMPO LIMITADO: El indicador de so
Trend Line Map Pro
STE S.S.COMPANY
4.47 (15)
El indicador Trend Line Map es un complemento para Trend Screener Indicator . Funciona como un escáner para todas las señales generadas por el evaluador de tendencias (Trend Line Signals). Es un escáner de líneas de tendencia basado en el indicador de evaluación de tendencias. Si no tiene el indicador Trend Screener Pro, Trend Line Map Pro no funcionará. Al acceder a nuestro blog MQL5, puede descargar la versión gratuita del indicador Trend Line Map. Pruébelo antes de comprar, sin las res
El indicador Boom and Crash Spike Detector está codificado en base a una estrategia avanzada principalmente para detectar Boom and Crash en los precios. Se implantaron algoritmos complejos para detectar auges y caídas de alta probabilidad en los precios. Alerta sobre posibles fases de auge o choque: Fase de auge: cuando el precio aumenta demasiado rápido. Crash Phase: cuando el precio baja demasiado rápido. OFERTA POR TIEMPO LIMITADO: El indicador está disponible por solo 30$ y de por vida.  C
Nuestros niveles de soporte o resistencia se forman cuando la acción del precio de un mercado se invierte y cambia de dirección, dejando atrás un pico o valle (punto de oscilación) en el mercado. Los niveles de soporte y resistencia pueden crear rangos de negociación. El indicador identifica el Swing High y Swing Low según la cantidad X de barras (Periodo) definidas en el conjunto de indicadores. Nota: si le gusta nuestro indicador de acción del precio, pruebe nuestro indicador de tendencia t
FREE
Trend Line Map Pro MT5
STE S.S.COMPANY
4.09 (11)
El indicador Trend Line Map es un complemento para Trend Screener Indicator. Funciona como un escáner para todas las señales generadas por el evaluador de tendencias (Trend Line Signals). Es un escáner de líneas de tendencia basado en el indicador de evaluación de tendencias. Si no tiene el indicador Trend Screener Pro, Trend Line Map Pro no funcionará. It's a Trend Line Scanner based on Trend Screener Indicator. If you don't have Trend Screener Pro Indicator,     the Trend Line Map Pro will
El indicador Boom and Crash Spike Detector está codificado en base a una estrategia avanzada principalmente para detectar Boom and Crash en los precios. Se implantaron algoritmos complejos para detectar auges y caídas de alta probabilidad en los precios. Alerta sobre posibles fases de auge o choque: Fase de auge: cuando el precio aumenta demasiado rápido. Crash Phase: cuando el precio baja demasiado rápido. OFERTA POR TIEMPO LIMITADO: El indicador está disponible por solo 30 $ y de por vida. 
El rango diario promedio muestra el rango de pips promedio de un par de divisas medido durante un cierto número de períodos. Los comerciantes pueden usar el ADR para visualizar la acción potencial del precio fuera del movimiento diario promedio. Cuando el ADR está por encima del promedio, significa que la volatilidad diaria es más alta de lo habitual, lo que implica que el par de divisas puede extenderse más allá de su norma. Nuestro analizador ADR se compone de 5 características principales:
Todo comerciante sabe que él o ella nunca deben arriesgar más del 5% (o 7%) por operación. Esta es una ley de administración de dinero y se debe calcular un tamaño de lote utilizable cada vez porque un comerciante debe usar un valor StopLoss diferente para diferentes niveles de negociación. Este indicador calculará un tamaño de lote apropiado para el momento en que lo colocará en el gráfico y cada vez arrastrará la "Línea de stop loss" en cualquier dirección. OFERTA POR TIEMPO LIMITADO: Tod
El medidor de fuerza de la moneda le brinda una guía visual rápida sobre qué monedas son fuertes actualmente y cuáles son débiles. El medidor mide la fuerza de todos los pares cruzados de divisas y aplica cálculos sobre ellos para determinar la fuerza general de cada moneda individual. Calculamos en base a la fuerza de la moneda en función de la tendencia de 28 pares. Accediendo a nuestro Blog MQL5, puede descargar la versión gratuita del indicador. Pruébelo antes de comprar, sin las rest
Todo comerciante sabe que él o ella nunca deben arriesgar más del 5% (o 7%) por operación. Esta es una ley de administración de dinero y se debe calcular un tamaño de lote utilizable cada vez porque un comerciante debe usar un valor StopLoss diferente para diferentes niveles de negociación. Este indicador calculará un tamaño de lote apropiado para el momento en que lo colocará en el gráfico y cada vez arrastrará la "Línea de stop loss" en cualquier dirección. OFERTA POR TIEMPO LIMITADO: Tod
El analizador de volatilidad es un indicador de impulso, que aprovecha la tendencia del precio a romper con fuerza después de consolidarse en un rango de cotización ajustado. El indicador también usa un oscilador de impulso para mostrar la dirección esperada del movimiento cuando se dispara el apretón. Este histograma oscila alrededor de la línea cero, el aumento del impulso por encima de la línea cero indica una oportunidad de compra larga, mientras que el impulso que cae por debajo de la líne
El rango diario promedio muestra el rango de pips promedio de un par de divisas medido durante un cierto número de períodos. Los comerciantes pueden usar el ADR para visualizar la acción potencial del precio fuera del movimiento diario promedio. Cuando el ADR está por encima del promedio, significa que la volatilidad diaria es más alta de lo habitual, lo que implica que el par de divisas puede extenderse más allá de su norma. Nuestro analizador ADR se compone de 5 características principales:
El analizador de volatilidad es un indicador de impulso, que aprovecha la tendencia del precio a romper con fuerza después de consolidarse en un rango de cotización ajustado. El indicador también usa un oscilador de impulso para mostrar la dirección esperada del movimiento cuando se dispara el apretón. Este histograma oscila alrededor de la línea cero, el aumento del impulso por encima de la línea cero indica una oportunidad de compra larga, mientras que el impulso que cae por debajo de la líne
Filtro:
temcclain78
24
temcclain78 2024.09.11 16:35 
 

This outstanding product has been a game changer! In July, I bought the Trend Screener and the Trend Line Map Pro for $100 USD all together, signed up for a $200K challenge, and 6 days later I passed the challenge. August brought a market shift. So my honest recommendation, have a reliable trend based strategy already so you will know WHAT to look for. Buy the products so you will know WHERE and WHEN to look. I downloaded some free technical indicators to build my current strategy based on M1 (heads up), M5 (entry and exit), and M15 (overall trend). I have all 3 timeframes open when analysing and trading. The addition of the Trend Screener's analysis on all timeframes, and the Fuzzy Logic, make it a must have for me. The strongest trends, and best trades, happen when more timeframes align in that direction. The Trend Screener shows me what I am missing and makes Top Down Analysis quicker. These products have been the missing piece to the puzzle of trading for me / my "Aha moment". Although I'm a day trader, in July the Trend Line Map Pro made me want to become a swing trader. It gave an NZD alert based on the H4, and I placed my entries based on how I trade the lower timeframes. I placed my Take Profit based on H4 levels and saw amazing profit.

STE S.S.COMPANY
289077
Respuesta del desarrollador Sayadi Achraf 2024.09.12 16:14
Thank you for sharing your detailed experience with the Trend Screener and Trend Line Map Pro! It's fantastic to hear how these tools have been game changers for you, especially with your successful $200K challenge result in just 6 days! Your strategy of combining multiple timeframes—M1 for a heads up, M5 for entry and exit, and M15 for the overall trend—alongside the Trend Screener's multi-timeframe analysis, sounds like a solid approach to making informed trading decisions. I appreciate your honest advice about having a reliable trend-based strategy beforehand to maximize the benefits of these products. It's clear that the combination of the Trend Screener, Fuzzy Logic, and the Top Down Analysis has really helped streamline your process and provided that "Aha moment" in your trading journey. It's also inspiring to hear how the Trend Line Map Pro prompted you to explore swing trading opportunities with such great results. Thanks again for the valuable insights—this is very helpful for other traders considering these tools!
Matthew Nathan Brooks
199
Matthew Nathan Brooks 2024.09.04 19:24 
 

This is an amazing indicator. ive used it for 2 weeks on a demo on Gold and the results have been amazing. it took a couple days to get the setting right. but since then its been the best, will try on a demo for another 2 weeks. having a small issue with notification not coming to my phone all the time but thats not a big deal for me..

STE S.S.COMPANY
289077
Respuesta del desarrollador Sayadi Achraf 2024.09.12 16:14
Thank you for your feedback! I'm glad to hear that you're having such a great experience with the indicator on your demo account with Gold. It’s awesome to know that once you fine-tuned the settings, it’s been delivering amazing results for you! As for the notification issue, we appreciate you bringing it to our attention. We'll definitely look into that to ensure a smoother experience. It’s great to see that it hasn’t been a major inconvenience for you, and I hope your continued testing over the next couple of weeks brings even more positive outcomes. Thanks again for sharing your experience!
waqarqureshi1
57
waqarqureshi1 2024.08.05 14:25 
 

Amazing

STE S.S.COMPANY
289077
Respuesta del desarrollador Sayadi Achraf 2024.08.05 15:03
Thank you for taking the time to write your review, sir. My customer satisfaction is always our top priority.
Nagib Mahfuj Nayem
37
Nagib Mahfuj Nayem 2024.08.02 18:27 
 

This is really Insane. I just used only one week but more than 500 pips made with this indicator with only GOLD. And his support is really top notch. 100% Recommended.

STE S.S.COMPANY
289077
Respuesta del desarrollador Sayadi Achraf 2024.08.02 18:29
Hi Mr. Nayem, Thank you for taking the time to write your review of our trend indicator. Since 2020, we have been committed to offering the best trend indicator for our customers, making MetaTrader a true trend analyzer. Wishing you good and safe trading!
Gimel Abayon Roda
334
Gimel Abayon Roda 2024.07.16 07:07 
 

I have been using this indicator to analyze the market trend. The dashboard is very useful in identifying the overall market direction. The CSM trend is useful in identifying the strong, weak and ranging currencies. I am using this in 15min timeframe. Though not recommended by the seller to use it in timeframes lower than 30mins, the indicator can still help generate positive pips, especially when you use it with support and resistance indicator.

STE S.S.COMPANY
289077
Respuesta del desarrollador Sayadi Achraf 2024.07.16 12:20
Thank you for taking the time to write your review MR. Gimel. Since 2020, we have been working hard to keep improving our indicator to offer our customers the best indicator in the market to analyze market trends via many features. I invite you to check the list of all our free and premium indicators here: https://www.mql5.com/en/users/sayadi_lancer/seller
sami57
119
sami57 2024.07.08 23:04 
 

this is the best indicator i use

STE S.S.COMPANY
289077
Respuesta del desarrollador Sayadi Achraf 2024.07.10 13:32
Thank you for taking the time to write your review MR. Sami. We are here to offer all the necessary support for our customers. Since 2020, we have been working hard to keep improving our indicator to offer our customers the best indicator in the market to analyze market trends via many features. I invite you to check all the list of all our free and premium indicators here : https://www.mql5.com/en/users/sayadi_lancer/seller
fatambouzid
47
fatambouzid 2024.05.16 01:35 
 

This is one of the best indicators I have seen ! Multitimeframe trend analysis for selected currency pairs, with a clear trend summary information; currency strength information, plus a trend simulator so you can verify and set your expectations right in terms of TP that is proven by historical signals and success rate statistics, etc. I am using both MT5 and MT4 versions of the indicator as the main signal source for all my trades with a very high success rate for a a week now. From one single chart I have clear visibility to the current market conditions.

Leroy Pastran
428
Leroy Pastran 2024.05.15 18:57 
 

Great HTF Trend Tool! Thanks for creating this system!

Erik
169
Erik 2024.03.25 10:10 
 

I haven't tested the indicator properly yet. But I give 3 stars for the great support. My questions were answered in a short time. Problems were solved quickly. Excellent. The indicator itself only gave me losses.

STE S.S.COMPANY
289077
Respuesta del desarrollador Sayadi Achraf 2024.04.15 02:33
Thank you for taking the time to write your review MR. Erik. We are here to offer all the necessary support for our customers. Since 2020, we have been working hard to keep improving our indicator to offer our customers the best indicator in the market to analyze market trends via many features. I invite you to check all the list of all our free and premium indicators here : https://www.mql5.com/en/users/sayadi_lancer/seller
zakim1984
44
zakim1984 2024.03.19 02:44 
 

I'm using trend screener since a couple of months both MT4 and MT5 versions and its really a great indicator! The author also is very responsive and helpful..

STE S.S.COMPANY
289077
Respuesta del desarrollador Sayadi Achraf 2024.03.19 02:48
Thank you so much sir , for your honest review and your kind words! You dont know how happy i am really you made my day! I wish you more success in your trading! The Trend Screener is the best All-In-One Trend Indicator ! I am really glad that i help and that I could bring some positivity in you trading in general! thank you so much again!
tunsam61
32
tunsam61 2024.03.19 02:01 
 

The trend screener is one of the best indicators in the market if followed correctly. I've had the indicator for 3 days and has greatly helped my ability to predict the market. The developer has excellent customer support and always willing to go extra mile to satisfy his customers and answer any questions. I will recommend this product for anyone who is interested in making money from the financial market.

STE S.S.COMPANY
289077
Respuesta del desarrollador Sayadi Achraf 2024.03.19 02:58
Hi sir, Thank you for taking time to write your review. If you see the trend summary always Up Trend it means that you're MT4 is missing historical data. The trend summary will not give up trend for 15 instruments always. There is something wrong with the installation. I'm sending you now a private message asap to check this issue with you and assisting you to fix it and explain to you the best way to use trend screener indicator because you need to use the trend line for short terms trend and trend summary, just as a filter.
———————
Update: Can you check your private message please? I just sent you a message to assist you from there and ensure that you don’t get confused. Please let me know your feedback sir.
19990228
34
19990228 2024.02.22 14:02 
 

El usuario no ha dejado ningún comentario para su valoración

STE S.S.COMPANY
289077
Respuesta del desarrollador Sayadi Achraf 2024.02.22 14:13
Hi sir, Thank you for your review. I'm happy to know that you found our indicator an excellent Smart trend indicator that can assist you in analyzing the Properly market trend and improving your trade accuracy. I'm sending you now a private message to assist you from there.
burnoutnorthbowl1
55
burnoutnorthbowl1 2024.01.22 21:33 
 

I purchased this indicator only a few days ago and I can already tell it is very powerful if used correctly. Now I am going to get the map add on.

STE S.S.COMPANY
289077
Respuesta del desarrollador Sayadi Achraf 2024.01.25 21:19
Thank you soo much for the honest review and the kind words.
We are working day and night to create the best advanced and professional tools in the market. That's the goal here and we can get there only if our standards are held high and professional as well!
Please have a good and safe trading.
DanyLbc747
880
DanyLbc747 2024.01.18 13:08 
 

I purchased Trend Screener based on reviews. I was a bit skeptical. Ultimately, this is by far the most used product I have ever used. The first month I tested it on a demo and today it's been more than 1.5 months that I've been using it daily on a live account. I wasn't as profitable before as I am now. I like to test other products as well, but this one captivated me already during the demo testing. The uniqueness is such that each trader will find his own way according to his style, whether it is scalping, day or swing trading. In essence, only this product is enough for you and you are taken care of. The author is very helpful. After the purchase, I also had a video call with him, where he explained the important steps. The author is above all human-friendly. Thank you for this product and a job well done by the author and his team.

STE S.S.COMPANY
289077
Respuesta del desarrollador Sayadi Achraf 2024.01.18 16:55
Thank you for taking the time to write your review, sir. I'm doing my best to offer the best analytics tools for my customers. My customer's satisfaction is always my top priority. Have a good and safe trading, sir.
Victor L
63
Victor L 2024.01.11 17:23 
 

A wonderful discovery. This tool indicator offers multiple feedback features to alert how the market is moving and enables probable actions one could take. The continuous process instills confidence. The 1x1 service support from Sayadi surely makes it better.

Iulius65
152
Iulius65 2024.01.04 18:21 
 

I bought this amazing indicator three days ago, in this moment I just study how can I better use this tool. I intuit that after I discover how to use it, will have good return in manual trading. From now I am very enthusiastic.

smallwood1988
64
smallwood1988 2023.12.29 16:37 
 

Amazing Indicator, Author so helpfull and understanding. Worth the purchase

STE S.S.COMPANY
289077
Respuesta del desarrollador Sayadi Achraf 2023.12.29 17:14
Thank you for taking the time to write your review. I'm happy to know that you found our indicator a good indicator to use during your trading and analyzing market trends with our smart scanner. -- Please have a good and safe trading.
SUYANTO_SE
173
SUYANTO_SE 2023.12.27 16:20 
 

Excellent product and prompt support. Highly recommend to have this indicator c/w Trend Line Map Indicator. Thank you very much Mr. Sayadi

hari2007
19
hari2007 2023.12.22 11:15 
 

Everything is good but wanted to check will this indicator works in autotrading using mt2trading and mx2trading for binary trading does it takes trades automatically following trendscreener indicator what are settings i need to do please help

STE S.S.COMPANY
289077
Respuesta del desarrollador Sayadi Achraf 2023.12.22 12:14
Hi sir, Thank you for taking the time to write your review. I'm happy to know that you find our trend indicator as a good indicator to use it in your daily trading and analyzing market trends.
---
I'm sending a PM to check more details about what you want to achieve exactly.
Ferdinand Amahan
123
Ferdinand Amahan 2023.12.17 23:57 
 

One of the best TREND INDICATOR in the market. Highly recommended for seasoned and newbie alike..

Respuesta al comentario
Versión 21.10 2024.06.03
1. Improve signal quality.
2. Add Trend line period.
Versión 20.10 2023.11.29
1. Change the Trend Scanner Layout by giving more flexibility in configuration to hide and display every column.
2. Add inputs to change timeframes for every column.
3. Optimize Trend breakout alerts and trend reversal alerts.
4. Add a period for the scanner to be adjusted for faster or slower trend calculation.
5. Change trend lines layout.
6. Optimize indicator setting.
7. Increase Scanner speed.
Versión 19.21 2023.05.29
1. Fixing Spelling mistakes.
Versión 19.20 2023.05.26
1. Optimize indicator speed.
2. Improve Trend CSM algorithm.
3. Improve Trend reversals dots.
4. Improve Strong Trend dots.
Versión 19.3 2022.12.06
1. Improve indicator Speed for calculation with missing data.
Versión 19.0 2021.08.29
1. Updating Alerts.
Versión 18.1 2021.08.27
1. Adjusting signals design.
Versión 18.0 2021.08.27
1. Add Strong Trend Signals.
2. Add Reversal Trend Signals.
3. Optimizing Trend Algorithm.
4. Add Scalper TP similator.
Versión 16.30 2021.06.07
1. Optimizing Trend Dashboard for small timeframes.
Versión 16.21 2021.05.08
1. Optimizing indicator speed.
Versión 16.20 2021.04.18
1. Fixing issue with ultimate Screener EA.
Versión 16.10 2021.04.18
1. Add support for Trend Screener Ultimate.
Versión 16.0 2021.03.19
1. Add support to swing stoploss for Trend screener EA.
Versión 15.80 2021.01.06
1. Add support to Trend Turbo EA
Versión 15.60 2020.10.01
1. Add backtesting feature / Demo testing in the market.
Versión 15.51 2020.08.22
1. Setting optimization.
Versión 15.50 2020.08.22
1. Optimizing Suffix and prefix displaying.
Versión 15.0 2020.07.29
1. Fixing the issue of Suffix / Current Chart Mode.
2. Buffers optimization for Eas.
3. Adjusting the default setting.
Versión 13.0 2020.06.15
1. Fixing Fuzzy logic score issue in version 12.00.
Versión 12.10 2020.06.07
Updates :

1. Add new Alert time ( GMT Or BROKER SERVER TIME or Local Computer time ).
2. Add Parameter to define Frequency of the Screener updating. ( Seconds )
3. Add Pairs manager: Display Screener based on Current Chart OR Display Screener based on Custom pairs List.
4. Hide - display button for the Success Rate Simulator.

Fixed issues :
1. Correcting button names.


Versión 11.10 2020.04.18
1. Add a Spread feature.
Versión 11.0 2020.04.14
1. Add enable-disable Button based on Customers requests.
Versión 10.1 2020.04.09
1. Changing the default setting.
Versión 10.0 2020.04.06
1. Add EAs Supporting with 3 methods.
Versión 9.2 2020.04.01
1. Fixing issue with the default setting.
Versión 9.1 2020.03.31
1. Optimization of Stoploss calculator.
Versión 9.0 2020.03.31
1. Optimizing trend line signal.
Versión 8.1 2020.03.19
1. Optimizing CSM updating timing.
2. Add enable-disable CSM.
Versión 8.0 2020.03.17
1. Add Currency Strength Meter
Versión 7.3 2020.03.13
1. Add Prefix and Suffix for pairs like "EURUSD.c"...etc.
Versión 7.2 2020.03.10
1. Fixing display Success rate simulator.
Versión 7.1 2020.03.07
1. Adjusting default colors.
Versión 7.0 2020.03.07
1. Optimizing Fuzzy logic algorithm and Strong Trend identification.
2. Optimizing Alert generating in Strong Trend and Normal Trend.
3. Add feature to display trading type recommendation in Success Rate Simulator.
4. Add Max bars to Run Success Rate Simulator.
Versión 6.11 2020.03.01
1. Correcting some spelling mistakes.
Versión 6.10 2020.03.01
1. Add Hide-Display Second Box
Versión 6.0 2020.03.01
1. Add TP levels and SL per level.
2. Add 2 options for Takeprofit
2.1 Floating TP with three Ratio.
2.2 TP simulator to find the best TP with the best success rate.
3. Add Chart change via Button in Trend Screener.
4. Optimizing button click event.
Versión 5.50 2020.02.27
1. Add Arrows color feature.
Versión 5.2 2020.02.26
1. Optimization refresher.
Versión 5.1 2020.02.26
1. Fixing a refreshing issue.
Versión 5.0 2020.02.25
1. Add max profit feature.
2. Optimizing trend line drawing.
Versión 4.0 2020.02.21
1. Add Alerts Filters.
2. Add List of pairs to display all Currencies in the same charts.
3. Add metals, indices supporting.
Versión 3.0 2020.02.20
1. Add symbols automatically to the MT4 MarketWatch.
Versión 2.0 2020.02.16
1. Optimizing trend calculation.
2. Add Alerts features.
Versión 1.70 2020.02.13
Fixing the EURUSD calculation issue.
Versión 1.60 2020.02.13
1. Optimizing Fuzzy logic calculation.