Nuevos robots comerciales e indicadores para MetaTrader 5 - 166

Ciclo Identificador Pro: Indicador avanzado de máximos y mínimos de swing Descripción: Libere todo el potencial de su estrategia de negociación con Cycle Identifier Pro , un indicador de vanguardia meticulosamente diseñado para señalar los máximos y mínimos de oscilación con una precisión sin precedentes. Si usted es un operador experimentado o acaba de empezar, Cycle Identifier Pro ofrece las herramientas que necesita para navegar por cualquier condición de mercado a través de todos los plazos
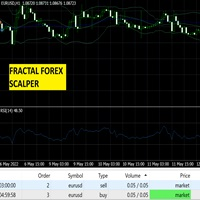
Este es un asesor experto que utiliza FrAMA (Media Móvil Adaptativa Fractal), RSI (Índice de Fuerza Relativa), y las Bandas de Bollinger para scalping el mercado para operaciones alcistas o bajistas. La estrategia se centra en el cruce alcista y bajista de la línea FrAMA con respecto a la banda media de Bollinger. El RSI se utiliza para confirmar el impulso del movimiento del precio antes de alcanzar el territorio de sobrecompra o sobreventa.
Las entradas ajustables de Stop Loss y Take Profit

Clicks es una herramienta para mejorar la ejecución , la gestión y la precisión de sus operaciones.
Características: Le permite establecer límites de negociación y mostrar sus estadísticas directamente en el gráfico. Le permite abrir, modificar, borrar/cerrar órdenes desde un panel y le facilita establecer niveles de take profit y stoploss. Le ayuda a operar utilizando las líneas de tendencia dibujadas en su gráfico. El algoritmo ejecuta sus órdenes cuando el precio alcanza las líneas de tenden

Road Runner utiliza los principios de las señales de trading estocásticas y la señal estocástica inversa para la entrada en función de las preferencias optimizadas. Para colocar una orden de compra en una zona de soporte, la lectura estocástica debe estar por debajo de 20, y la línea %K debe cruzar la línea %D hacia arriba. Del mismo modo, para colocar una orden de venta en una zona de resistencia, la lectura estocástica debe estar por encima de 80, y la línea %K debe cruzar la línea %D hacia ab

Fusion Pro Scalper EA - Scalping con estrategias de salida flexibles Tome el control de sus operaciones con Fusion Pro Scalper EA, creado para mercados dinámicos. Utilizando Aroon para la detección de tendencias y ATR para entradas basadas en la volatilidad, garantiza configuraciones precisas y salidas flexibles, sin depender de estrategias de martingala o rejilla. Características principales: Entrada y salida inteligentes : Combina Aroon y ATR para operaciones de ruptura precisas. Opciones de

Presentamos Quantum Quotient para los traders y aspirantes a PropFirms. Este sistema de trading automatizado implementa una estrategia sin tácticas MARTINGALE y GRID, meticulosamente construida utilizando indicadores técnicos y fundamentales propietarios. Estas metodologías han sido sometidas a rigurosas pruebas y refinamientos durante más de un año.
La estrategia Quantum Quotient comprende cuatro pasos clave:
1. Análisis de Oferta y Demanda: Inicialmente, el sistema calcula los niveles de ofer
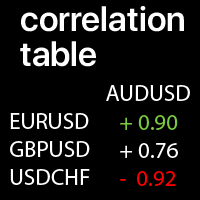
Valores de correlación entre los símbolos seleccionados: compare las tendencias actuales del mercado Un valor de +1: significa una correlación positiva completa; Un valor de -1: significa una correlación inversa completa; Un valor de 0: significa que no hay una correlación clara (los precios no dependen entre sí, o la correlación es aleatoria ); Mi #1 Utilidad : 66+ funciones | Contáctame para cualquier pregunta | Versión MT4 Cada símbolo se puede personalizar:
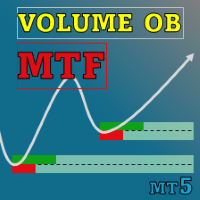
Special offer : ALL TOOLS , just $35 each! New tools will be $30 for the first week or the first 3 purchases ! Trading Tools Channel on MQL5 : Join my MQL5 channel to update the latest news from me El indicador Volumetric Order Blocks Multi Timeframe es una herramienta poderosa diseñada para traders que buscan una comprensión más profunda del comportamiento del mercado al identificar áreas clave de precios donde los principales participantes del mercado acumulan órdenes. Estas área

El "Poder de Tres" (PO3) es un concepto desarrollado por el Inner Circle Trader (ICT) para ilustrar un enfoque de tres etapas utilizado por el dinero inteligente en los mercados: Acumulación, Manipulación y Distribución . Los operadores del ICT lo consideran un patrón fundacional que puede explicar la formación de cualquier vela en un gráfico de precios. En términos simples, este concepto es eficaz para cualquier marco de tiempo, siempre y cuando haya un inicio definido, un punto más alto, un pu
FREE

OS PRESENTO EL ELECTRÓN ES ROBOT UN ROBOT DE ALTA FRECUENCIA QUE PUEDE COMERCIAR EL PAR US30 ES ORO PERIODO:PERIODO 1 MINUTO O 1 HORA
ESTE ROBOT DEBE SER UTILIZADO PARA CREAR UNA CUENTA DE PROP FIRM Y SER FINANCIADO PARÁMETRO A AJUSTAR EN EL ROBOT STOP LOSS1 AJUSTADO A:75
RANGO DE TIEMPO LÍMITE
RANGO DE TIEMPO DE SEÑAL DE:16H30
RANGO DE TIEMPO DE SEÑAL HASTA :20H00 ESTE ROBOT DEBE SER UTILIZADO EN VPS DE BAJA LATENCIA ES UN CORREDOR CON SPREADS BAJOS, COMO FP MERCADO O IC MERCADOS, PUEDE EDI

ProVolaBot es un robot de trading algorítmico diseñado para operar en índices sintéticos.
Funciona especialmente bien en los siguientes mercados: Mercados principales y más eficientes • Boom 900 y Crash 1000 (Deriv)
• GainX 999 y PainX 999 (WellTrade) Estos mercados han demostrado ofrecer la mayor estabilidad, un comportamiento estadístico sólido y el mejor potencial de rentabilidad para ProVolaBot. Mercado adicional compatible • Volatility 100 (1s) Index (Deriv) ProVolaBot también puede operar
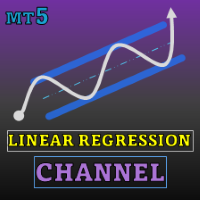
Special offer : ALL TOOLS , just $35 each! New tools will be $30 for the first week or the first 3 purchases ! Trading Tools Channel on MQL5 : Join my MQL5 channel to update the latest news from me El Indicador de Canal de Regresión Lineal es una poderosa herramienta de análisis técnico que ayuda a los traders a capturar tendencias de precios y puntos de reversión potenciales. Al calcular y mostrar canales de regresión lineal, bandas y proyecciones futuras, este indicador ofrece un
Hola traders, he diseñado esta herramienta con resultados reales de manera rigurosa, herramienta basada en varias de mis Estrategias anteriores, adaptándola al Mercado Forex, Tyr AI, con el poder del Dios del orden, un sistema neuronal de machine learning basado en IA para hacer un análisis profundo del mercado de scalping un EA sólido para manejar bien el mercado oficial EURUSD, analizando el mercado para hacer entradas a niveles profesionales no hedge, no martin, Professional AI Scalping con

SUBIRA TREND TRADER
Introducción
El siguiente software no depende de ningún indicador y funciona como una herramienta para automatizar completamente sus operaciones. No utiliza HFT ni ninguna estrategia riesgosa. Las operaciones pueden acumularse, pero el riesgo resultante es mínimo. Esta herramienta es una acumulación de mi experiencia en operaciones con USD JPY utilizando la acción del precio y las velas japonesas. La detección de patrones no es tan sencilla para las máquinas como lo es par

Traza automáticamente niveles Fibonacci, basado en los precios Máximo y Mínimo del marco de tiempo especificado Varias velas pueden unirse: por ejemplo, puede obtener un Fibonacci basado en los Máximos y Mínimos de 10 días Mi #1 Utilidad : 66+ funciones, incluido este indicador | Contácteme para cualquier pregunta | Versión MT4 Ayuda a ver niveles potenciales de reversión; Los patrones formados en los niveles Fibonacci tienden a ser más fuertes; Reduce significativamente el t
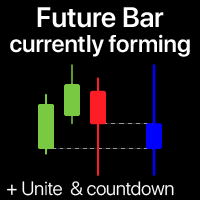
El indicador muestra la vela actualmente en formación del marco de tiempo seleccionado Múltiples barras pueden opcionalmente unirse en una sola vela: ayuda a ver el panorama general. Utilidad Multifuncional #1 : 65+ funciones, incluido este indicador | Contáctame para cualquier pregunta | Versión para MT4 En la configuración de entrada, seleccione el marco de tiempo que se utilizará para la barra futura: A la derecha del precio actual, verá una barra formándose en el intervalo es
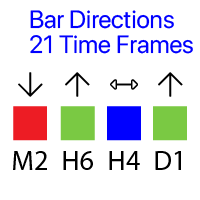
Muestra la dirección de las barras en todos los 21 marcos temporales. Utilidad multifuncional : 65+ funciones, incluyendo esta herramienta | Contáctame para cualquier pregunta | versión para MT4
Significado de las señales visuales ( cuadrados):
Rojo : El precio de cierre es menor que el precio de apertura: Close < Open; Verde : El precio de cierre es mayor que el precio de apertura: Close > Open; Azul : El precio de cierre es igual al precio de apertura: Close = Open; Pu

Potente EA de retroceso para operar con cualquier par de divisas.
Presentación en vivo: https://www.mql5.com/en/signals/2267756 - envíe un mensaje privado para solicitar los archivos del conjunto
Inicio rápido - Configure el EA en el gráfico M15 de EURGBP (solo vender), EURCHF (solo comprar), USDCAD (solo comprar), EURUSD (solo vender). - El riesgo único es de aproximadamente 300 USD por par para el lote mínimo. Asegúrese de que los riesgos sean cómodos para usted. - Asegúrese de que la config
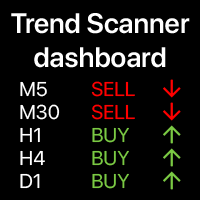
Panel de tendencias: indicador multiframe, muestra un resumen de la tendencia actual Esta herramienta se basa en 3 indicadores principales: RSI, Estocástico e Índice del Canal de Materias Primas. La opción de alertas te ayudará a no perderte el inicio de la tendencia. Utilidad multifuncional : incluye 66+ funciones | Contáctame si tienes alguna pregunta | Versión MT4 Una variedad de opciones te permitirá personalizar el indicador según tus necesidades. Configuració

Hola traders, he diseñado esta herramienta con resultados reales de manera rigurosa, herramienta basada en varias de mis Estrategias AI anteriores,
Crypto AI Pro se basa en realizar operaciones de compra y venta de activos financieros en periodos muy cortos de tiempo, buscando obtener ganancias de pequeñas fluctuaciones en los precios. Al aplicarlo a Bitcoin, un scalper utiliza inteligencia artificial y algoritmos de machine learning para analizar grandes cantidades de datos del mercado de cri
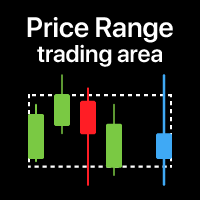
Zona de precio: visualización del rango de trading para el período seleccionado Especialmente útil al operar en timeframes bajos , para ver el rango desde un TF superior . Mi #1 Utilidad : 65+ funciones, incluyendo este indicador | Contácteme para cualquier pregunta | Versión MT4 Cuándo puede ser útil: Al usar múltiples timeframes Para ver el panorama general desde otro período Para ver el rango completo del período seleccionado Configuración: Color de la zona Rellenar zona: si es '
El Ninja Turtle Scalper utiliza el EA Donchian Channel para encontrar señales de entrada - al igual que las famosas operaciones de tortuga lo hicieron en aquel entonces. El indicador es simple pero eficaz. Es utilizado por traders profesionales desde hace muchos años y ahora también forma parte del framework de MT5. Si alguna vez has querido utilizar las señales del indicador para las entradas de scalping, este es el EA adecuado para usted. No AI, Martingala o Grid necesario. Este NO es el santo

Visión general El indicador Smart Money Structure Markup para MetaTrader 5 es una potente herramienta diseñada para ayudar a los operadores a identificar estructuras de mercado clave basadas en las populares estrategias Smart Money Concepts (SMC). Este indicador detecta micro-estructuras de mercado, proporcionando información sobre los movimientos de precios y los posibles cambios de tendencia. Destaca elementos importantes como la ruptura válida de la estructura (BOS), el cambio de carácter (CH
FREE
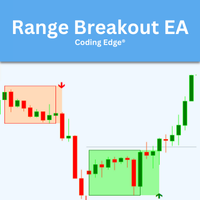
Range Breakout EA – ¡Aprovecha los movimientos de la sesión asiática! ¡Hola! Nuestro Range Breakout EA está diseñado para ayudarte a aprovechar los movimientos tempranos de la sesión asiática. Así es como funciona: durante un período de tiempo específico, el EA marca los puntos más altos y más bajos para crear un rango. Luego, coloca órdenes limitadas de compra y venta justo fuera de ese rango para que estés listo para aprovechar las rupturas en cualquier dirección. :) Por seguridad, el stop-los

Real Spread Monitor es un indicador de gran alcance que está diseñado para medir con precisión y analizar los diferenciales reales, dando a los comerciantes la capacidad de comparar las condiciones comerciales de diferentes corredores. Este producto también está disponible para MetaTrader 4 => https://www.mql5.com/en/market/product/125769 Características principales de Real Spread Monitor:
1. Dos modos de operación: Modo de escritura : En este modo el indicador recoge datos sobre spreads reale

Hola. MT5 cuenta debe tener la capacidad de cobertura. Después de un largo camino de desarrollo, (ya la versión 123) se detuvo en la necesidad de implementar tres modos de negociación: manual, semi-automático " INTRADAY_MANUAL [period_M1]", automático " INTRADAY_AUTO [period_H4]", semiautomático "INVESTOR_AUTO [period_H4]". El instrumento recomendado para operar es "oro". Los plazos recomendados para empezar a operar son M1 y H4. Para probar en el tester _ recomiendo activar el modo automático

Coulter_Precision - Aumente su potencial en el mercado con precisión y control Coulter_Precision es un asesor de operaciones profesional diseñado para operadores que buscan controlar cada aspecto de su estrategia en el mercado. Al trabajar exclusivamente con órdenes pendientes, este EA le permite centrarse en planificar los puntos de entrada y gestionar los riesgos, dejando la parte mecánica del trabajo a un asistente automatizado. La característica única de Coulter_Precision es que no toma deci

Test Trade Saver Script Tipo de Aplicación: Script
Funciones de la Aplicación: Guarda datos del archivo de caché de resultados de prueba en archivos de texto Acerca de la Aplicación El script extrae los resultados de comercio de un archivo de caché de un sistema de prueba y los guarda en archivos de texto para su posterior análisis. Cómo Usar Parámetros: LOG_LEVEL - Nivel de registro en la sección Experts del terminal. DEBUG proporciona la información más detallada, mientras que ERROR ofrece la
FREE

Vista general Nombre del bot : Plan Xchange Versión : 1.00 Configuración por defecto : XAUUSD/Oro Marco de tiempo: M15 Zona Horaria: UTC+3 Plan Xchange: Lo último en EA Breakout multisímbolo Un Asesor Experto de Breakout simple diseñado para operadores que exigen precisión, control y una sólida gestión del riesgo. Plan Xchange es un robot de negociación totalmente automatizado que se especializa en una estrategia de ruptura basada en el tiempo. Utiliza rangos clave de negociación durante horas

Indicador de Ratio - Guía del usuario
Oferta especial Deje un comentario y obtenga el indicador Long & Short Cointegration Analyzer gratis - ¡sólo envíeme un mensaje!
Este indicador de Ratio entre activos permite monitorizar y operar la relación de precios entre dos activos seleccionados por el usuario. Calcula la relación entre los precios de dos activos, denominados Activo1 y Activo2 (por ejemplo, "GBPUSD" y "EURUSD"), y traza una media móvil de la relación junto con las Bandas de Bollinger .
FREE

El script calcula la tasa de variación del precio y su desviación. Muestra un canal típico de movimiento del precio. Transfiera el script al gráfico y éste marcará automáticamente los canales por los que puede moverse el precio en un futuro próximo. Coloque órdenes de acuerdo con los límites del canal.
El script utiliza métodos estadísticos para determinar el ritmo y la amplitud del precio. Calcula y muestra los canales y los límites del movimiento futuro basándose en ellos.
Parámetros
PLACEM

EL MEJOR copiador de operaciones de MT5 a Telegram, pero fácil de usar [MANUAL AQUÍ]
Visión General: Esta poderosa herramienta permite a los traders enviar notificaciones de operaciones en tiempo real directamente a sus canales y grupo de Telegram, asegurando que nunca se pierdan un movimiento importante del mercado. TeleBot5 es un innovador programa MQL5 diseñado para unir a la perfección su experiencia de trading en MetaTrader 5 con Telegram .
**Características principales:**
- Alertas de

## Daily High Indicador - Danilo Monteiro - MT5
## Descripción El Daily High/Low Labels es un indicador personalizado para MetaTrader 5 que muestra automáticamente los máximos y mínimos diarios en el gráfico, facilitando la rápida identificación de los niveles de precios importantes. El indicador marca los precios con etiquetas y líneas horizontales, permitiendo una clara visualización de los niveles críticos del día actual y del día anterior.
## Características principales
### 1. Etiquetado
FREE

Expert Gold Cloud, utiliza 3 posiciones con porcentaje de riesgo cuando hay señal, Si establece 1% , entonces 3 posiciones x 1% = 3% de riesgo. 3 Posición con 1:1, 1:2, 1:10 RR. BEP y trailing stop se ejecutará si el primer TP alcanzado. Esto no es siempre ganar asesor de expertos, pero si en el momento adecuado, se le dará un buen beneficio, por favor, siga Riskpercent 1-3. Este experto no utiliza Martingala o posiciones de cobertura peligrosas.
Atributos: Funciona mejor en XAUUSD H1 , (QQQ.NA
FREE

El sistema Predator es un robot de trading totalmente automatizado. El robot puede abrir operaciones automáticamente, el usuario puede activar o desactivar esta opción en las entradas. El robot genera señales, las señales tienen un precio de entrada indicado por la línea azul, Take profit representado por una línea horizontal limón, Stop loss está representado por la línea horizontal roja. El robot tiene un filtro de tendencia. El robot tiene un filtro de sesión de negociación. El robot muestra

Este indicador se basa en las Bandas de Bollinger y las medias móviles, y utiliza el ADX para obtener el punto de inflexión de la tendencia del mercado y mostrar una señal.
Está pensado básicamente para su uso con pares de divisas y futuros con alta volatilidad. En nuestras pruebas lo utilizamos en XAUUSD, 5m y 15m. La tasa de ganancia es superior al 80% con 50 pips de stop loss y 50 pips de ganancia o más.
El indicador es también un indicador simple que le permite activar o desactivar las al
FREE

Presentamos el EA de Forex sobre Ondas de Elliott - Optimizando el Beneficio con un Capital Mínimo La Teoría de las Ondas de Elliott es uno de los principios fundamentales del análisis técnico en cualquier mercado. La mayoría de los operadores tienen como objetivo operar dentro de la tendencia principal del mercado. Sin embargo, a través del análisis basado en IA, he probado y validado que predecir exactamente cuándo comienza y termina una tendencia principal es prácticamente imposible. Mis algo

Asesor automático para el instrumento Bitcoin . Timeframe H1. Terminal MT5 Creé este Asesor específicamente para una empresa de accesorios. Todos los esfuerzos de cinco años fueron para crear un producto seguro. El Asesor se compone de 8 pequeños Asesores y es una Cartera lista.
Atención : El Asesor utiliza dos grandes estrategias de negociación (!): Trading por Tendencias; Trading por Patrones Estacionales (ciclos temporales) El Asesor NO utiliza estrategias tóxicas : Estrategia Disponibilida

SmartTradeEURUSD es un Asesor Experto diseñado específicamente para operar el par EURUSD sólo en velas diarias , garantizando una alta precisión y estabilidad. Aprovechando las últimas tecnologías de aprendizaje automático, el asesor analiza los datos del mercado para tomar decisiones de trading óptimas. Los ajustes clave son extremadamente sencillos : los niveles de stop-loss y take-profit (en puntos), así como el tamaño de la posición, permiten una gestión flexible del riesgo y del volumen. Si
AutoFib: Advanced Fibonacci Retracement para MetaTrader 5 Automatice el análisis de Fibonacci para tomar decisiones de trading más inteligentes AutoFib simplifica el análisis de Fibonacci identificando automáticamente los niveles clave de soporte y resistencia directamente en sus gráficos MT5. Tanto si es nuevo en el análisis de Fibonacci como si es un trader avanzado, AutoFib mejora su capacidad para identificar posibles retrocesos, continuaciones y niveles de precios críticos. Características

Se trata de un indicador de tendencia avanzado diseñado para identificar con precisión los retrocesos y el inicio de los movimientos tendenciales. Con esta herramienta, podrá recibir señales de alta calidad para entrar y salir del mercado, minimizando los puntos de entrada falsos y aumentando la rentabilidad de las operaciones. El indicador es adecuado para cualquier activo (pares de divisas, acciones, índices) e intervalos de tiempo, desde gráficos de minutos hasta diarios.
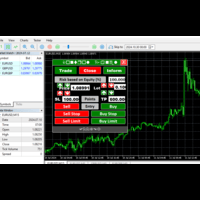
Asistente de Trader Manual y Gestión de Riesgo rápido y fácil de usar Le ofrece un entorno de negociación en el que puede realizar pruebas tanto en la Cuenta Activa como en el Probador de Estrategias. Adecuado para el comercio en vivo, gestión de riesgos y también le da las mismas capacidades de mercado en la estrategia de probador Le proporciona capacidades de edición sencillas y estrategias de salida que puede probar. EN PROMOCIÓN
FREE

EuroGuard EA - La solución definitiva para operar Presentamos EuroGuard EA , una herramienta de trading de última generación diseñada por traders profesionales con más de 7 años de experiencia en el mercado de divisas. Este Asesor Experto aprovecha un algoritmo único y adaptable que se destaca en la navegación a través de todas las condiciones del mercado, desde la volatilidad extrema a las tendencias estables. EuroGuard EA ha sido probado rigurosamente en varios escenarios y ha proporcionado c
FREE

Breve descripción:
FTMO Protector PRO MT5 es un EA diseñado para proteger su cuenta financiada gestionando el riesgo y asegurando el cumplimiento de las reglas de trading de la Prop Firm. Este EA monitoriza automáticamente los niveles de capital, cierra las operaciones cuando se alcanzan los objetivos de beneficios o los límites de reducción, y proporciona una visualización de las métricas clave de la cuenta . El EA funciona con todos los diferentes proveedores de servicios de Prop Firm.
Resu

Este indicador te ayudará a rastrear el rendimiento de tus operaciones, incluso las operaciones de scalping. Puedes usarlo con el árabe y muchos otros traders.
Este indicador muestra información relevante sobre su cuenta de trading directamente en el gráfico. Se posiciona en una de las cuatro esquinas de la pantalla y muestra detalles como: Símbolo: El símbolo del activo que está actualmente en el gráfico. Ganancias/Pérdidas: El total de ganancias o pérdidas en dólares para el símbolo actu
FREE

EuroBlade es un asesor experto que utiliza el método martingala.
Este asesor experto funciona bajo las siguientes condiciones
Par de divisas: EURUSD Depósito mínimo: 800 USD Apalancamiento mínimo: 1:100 Plazo de funcionamiento: 1H
Alcanzó un tipo de interés del 1,922% en la prueba retrospectiva desde principios de 2018 hasta noviembre de 2024. El método de martingala es una técnica de trading arriesgada, pero EuroBlade cubre el riesgo manteniendo las posiciones de venta y de compra al mismo
FREE

Descripción del código del indicador SuperTrend Este código define un indicador personalizado para la plataforma MetaTrader 5 llamado SuperTrend. El indicador se basa en el Average True Range (ATR) para identificar tendencias alcistas y bajistas en el mercado. Secciones del código: Información del indicador: Define el nombre del indicador, copyright, enlace, versión, etc. Configura el indicador para que se muestre en una ventana separada y tenga 9 buffers internos y 2 plots visibles. Establece l
FREE

El Asesor Experto "Pantalla de tiempo restante" muestra el tiempo restante hasta el cierre de la vela actual en una pantalla digital. El tiempo se muestra en días, horas, minutos y segundos. segundos. Características: Cálculo del tiempo: Calcula el tiempo restante hasta el cierre de la vela actual basándose en el actual del gráfico. Pantalla digital: Muestra el tiempo restante en formato digital . Fuente y tamaño personalizables: Permite seleccionar la fuente (Arial, Arial Black, Aptos Display,
FREE

Visión general
Este Asesor Experto (EA) para MetaTrader 5 es una herramienta robusta diseñada para optimizar la gestión del dinero y el riesgo. Permite a los usuarios calcular el tamaño de las posiciones en función del saldo de la cuenta, el porcentaje de riesgo deseado y los parámetros de la operación, como el stop loss y los puntos de entrada. Además, ofrece una visión clara de la relación recompensa-riesgo y permite la inclusión de la comisión del broker, recalculando los datos en consecuen
FREE

Indicador Ventana Alligator: Potencie sus análisis en MetaTrader con la Ventana Alligator. Este indicador coloca el clásico Alligator de Bill Williams en una ventana independiente, lo que permite una visión más clara y organizada. Ideal para los operadores que buscan precisión y eficacia en sus operaciones, la Ventana Alligator proporciona una visión nítida y facilita la identificación de tendencias sin contaminar el gráfico principal. Pruébela ahora y lleve sus estrategias de negociación al sig
FREE
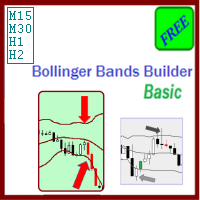
El asesor experto Bollinger Bands Builder Basic es una estrategia de trading gratuita y configurable que utiliza el indicador de las Bandas de Bollinger como su principal técnica proveedora de señales.
Al igual que sus productos hermanos del grupo de asesores expertos, este sistema tiene como objetivo garantizar un drawdown bajo y evitar la exposición a altos riesgos a través de:
el uso de órdenes stop loss colocadas automáticamente para todas las operaciones lanzadas; permitiendo un máximo de
FREE
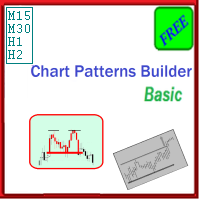
El asesor experto Chart Patterns Builder Basic es una nueva adición a la familia de productos de estrategias de trading automatizadas, que ya contiene el Price Action Builder Basic y el Bollinger Bands Builder Basic . Si bien comparte la funcionalidad general con los otros expertos, este experto se basa en la detección de algunos patrones gráficos de negociación conocidos para identificar sus señales de compra/venta.
Detalles técnicos:
Actualmente se admiten los siguientes patrones gráficos:
-
FREE

Macro Sniper EA sigue una estrategia de scalping breakout. Las operaciones se colocan a una hora específica del día, cuando se registra la mayor actividad comercial cada día (en promedio). Este rango de tiempo se calcula automáticamente y se ajusta en el caso de los cambios de horario de verano. Lo único es que para el backtesting, los 2 primeros parámetros tienen que establecerse en relación con el desfase horario del servidor respecto a GMT, por ejemplo: si su servidor está configurado en GMT+

TrendFusionXplorer consta de tres potentes indicadores de análisis de tendencias -TRP , PMax y OTT- desarrollados por Kivanc Ozbilgic. Cada indicador muestra los niveles de soporte y resistencia de la tendencia basándose en sus propiedades y metodología únicas. TrendFusionXplorer ayuda a determinar los puntos de entrada y salida de los mercados y también se puede utilizar para establecer niveles de stop-loss (SL) y take-profit (TP) en posiciones abiertas.
Especificaciones
1. Trend Reversal Pr

Funcionalidades - Abrir una orden Después de cerrar la vela - Abrir órdenes de compra y venta simultáneamente - Punto de equilibrio Y TP SL personalizables - Implementa funciones de Martingala y Cobertura
Recomendaciones - Pares de divisas: Principales pares de divisas - Pares de divisas recomendados: EURUSD - No recomendado : XAUUSD - Plazos: 5M / 15M / 1H - Depósito mínimo: $2000 por par de divisas *Recomendamos $10000 - Apalancamiento: Mínimo 1:100, recomendado 1:500 - Tipo de cuenta: ECN,

GOLD SAFE LOTS V 1.1 es un Asesor Experto diseñado específicamente para el comercio de oro. El funcionamiento se basa en la apertura de órdenes utilizando el GOLD SAFE LOTS , por lo que el EA funciona según la estrategia "Trend Follow", es decir, siguiendo la tendencia.
MARCO DE TIEMPO 15 MINUTOS
CADA LOTE TIENE STOP LOSS Y TAKE PROFIT PUEDE CAMBIAR EL TAMAÑO DEL LOTE DESDE LOS PARÁMETROS Stop Loss y Take Profit
Diferentes condiciones de entrada y salida
Sin sistemas Martingale o Grid
NO

¡Hola a todos! Si usted está utilizando el indicador de media móvil en la ventana del indicador RSI y siempre se pregunta si podría haber una manera de obtener alertas en su teléfono inteligente cuando los dos indicadores de obtener un cruce que sería genial, ¿verdad? Entonces usted ha encontrado la herramienta adecuada para ello. Este indicador no es más que una mezcla de indicador MA y el indicador RSI en una ventana de indicador, así como que le dará alertas de cruces en su aplicación para te
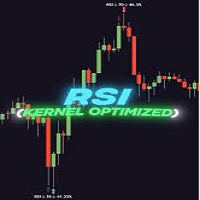
GENERAL OVERVIEW
¡Presentamos nuestro nuevo Indicador RSI Optimizado KDE! Este indicador añade un nuevo aspecto al conocido indicador RSI, con la ayuda del algoritmo KDE (Kernel Density Estimation), estima la probabilidad de que una vela sea un pivote o no. Para más información sobre el proceso, consulte la sección "¿CÓMO FUNCIONA? Características del nuevo Indicador RSI Optimizado de KDE :
Un nuevo enfoque para la detección de pivotes
Algoritmo KDE personalizable
RSI en tiempo real y panel
" VISIÓN GENERAL
Un Clasificador de Distancia Lorentziana (CDL) es un algoritmo de clasificación de Aprendizaje Automático capaz de categorizar datos históricos de un espacio de características multidimensional. Este indicador demuestra cómo la Clasificación Lorentziana también puede utilizarse para predecir la dirección de futuros movimientos de precios cuando se utiliza como métrica de distancia para una novedosa implementación de un algoritmo de Vecinos Cercanos Aproximados (RNA). Este indi
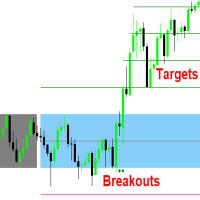
Este indicador mide y muestra el rango de precios creado a partir del primer período dentro de una nueva sesión de negociación, junto con las rupturas de precios de ese rango y los objetivos asociados a la amplitud del rango. El Rango de Apertura puede ser una poderosa herramienta para hacer una clara distinción entre los días de negociación con rango y con tendencia. El uso de una estructura rígida para dibujar un rango proporciona una base consistente para hacer juicios y comparaciones que ayu
Libere todo el potencial del trading con MACD PROject Expert Advisor (EA) , una herramienta automatizada altamente personalizable basada en el popular indicador MACD. El EA está diseñado con filtros robustos, lo que permite a los operadores gestionar los riesgos a través de ajustes flexibles como el tamaño del lote, stop-loss, take-profit y filtros de sesión. Ofrece múltiples opciones de confirmación de tendencia y métodos de trailing stop, por lo que es adecuado para diversas condiciones de me

El Sniper Trading Bot es un sistema de trading automatizado de alta precisión diseñado para capturar puntos óptimos de entrada y salida utilizando la estrategia "Sniper", que se centra en configuraciones de alta probabilidad. Este bot está específicamente diseñado para operar con XAUUSD, un activo altamente volátil. Está optimizado para el marco de tiempo de 30 minutos (M30) para proporcionar una visión eficaz de las tendencias del precio del oro a corto y medio plazo. Puede realizar un seguimie

Este indicador traza automáticamente líneas de tendencia, niveles de Fibonacci, zonas de soporte y resistencia, e identifica patrones BOS (ruptura de estructura) y CHOCH (cambio de carácter) en el gráfico. Con sólo colocarlo en el gráfico, se encarga de las tareas de análisis técnico esenciales para los operadores, proporcionando una herramienta de trading ágil y eficaz.

Smart Trend Suite Pro - Indicador de Tendencia Avanzado con Cuadro de Mando y Alertas Visión general: Smart Trend Suite Pro es un potente indicador de detección de tendencias que ofrece a los operadores un conjunto completo de herramientas para un análisis de tendencias preciso y perspectivas procesables. Diseñado para la versatilidad y la precisión, Smart Trend Suite Pro se adapta perfectamente a múltiples marcos de tiempo y condiciones de mercado, por lo que es adecuado para diversos estilos d
FREE

Desbloquee el comercio rentable de divisas con la precisión Aumente el rendimiento de sus operaciones con este experto asesor de operaciones de Forex, optimizado para USD/JPY con datos de tick de 15 minutos. Este EA combina potentes indicadores técnicos y gestión de riesgos para maximizar el potencial de beneficios y limitar el riesgo. Diseñado para operadores que valoran el crecimiento constante y las estrategias automatizadas, este EA reúne metodologías probadas para entradas y salidas largas
Resumen: Esta estrategia está diseñada para operar con el par de divisas EUR/USD utilizando una sofisticada combinación de indicadores técnicos. Su objetivo es automatizar el proceso de negociación mediante el análisis de las condiciones del mercado sobre la base de diversas métricas y la ejecución de operaciones siguiendo las reglas de la estrategia definida. Características principales: Indicadores utilizados : 1 . Rango Porcentual Williams (WPR) : Se utiliza para el comercio de impulso. 2 . M

Honest EA es lo que su nombre sugiere. Es un EA que negocia el índice USTEC con múltiples estrategias. Normalmente opera periodos cortos en la dirección de la tendencia. El EA tiene una tasa de ganancias de alrededor del 50% y un factor de beneficio superior a 1,4. Estas cifras son consistentes a lo largo de los últimos 13 años. EA está diseñado para funcionar en USTEC H1. Símbolos correlacionados podrían funcionar (como QQQ). Entradas: Lotes de entrada: el tamaño del volumen base Entry Lots per

NO GRID | NO MARTINGALE | 1:1 RELACIÓN RIESGO-RECOMPENSA | NO AI STUNT | ¡Bienvenido a GOLD Ranger EA!
GOLD Ranger EA está diseñado específicamente para operar el par XAUUSD en mercados de baja volatilidad, proporcionando un enfoque más seguro y controlado para el comercio de oro. Construido sin IA compleja o estrategias arriesgadas, es un sistema sencillo y fiable, por las personas que están operando en forex como un equipo de más de 9 años. Señal en vivo: Alto riesgo (2% por operación) https

Ranger spot EA trabaja en el principio de ruptura de rango de tiempo (donde el precio de apertura de los mercados a menudo establece la tendencia del día). En este caso, la estrategia consiste en identificar y capitalizar las rupturas de precios que se producen cerca de la apertura del mercado. El EA tiene filtros específicos que incluyen pero no se limitan a trailing loss, filtro de día de la semana, entradas de rango y gestión de lotes.

Visión general
Swag Expert Advisor Pro es una herramienta de negociación avanzada diseñada para ayudarle a tomar decisiones informadas de compra y venta en el mercado de divisas. Este asesor experto analiza los movimientos de los precios en relación con las Medias Móviles Exponenciales (EMA) para identificar los puntos de entrada óptimos, asegurándose de que se mantiene por delante de las tendencias del mercado. Características principales Análisis EMA: Ejecuta órdenes de compra cuando el preci
¿Sabe usted por qué MetaTrader Market es el mejor lugar para vender estrategias comerciales e indicadores técnicos? Con nosotros, el desarrollador no tiene que perder tiempo y fuerzas en publicidad, protección del programa y ajustes de cuentas con los compradores. Todo eso ya está hecho.
Está perdiendo oportunidades comerciales:
- Aplicaciones de trading gratuitas
- 8 000+ señales para copiar
- Noticias económicas para analizar los mercados financieros
Registro
Entrada
Si no tiene cuenta de usuario, regístrese
Para iniciar sesión y usar el sitio web MQL5.com es necesario permitir el uso de Сookies.
Por favor, active este ajuste en su navegador, de lo contrario, no podrá iniciar sesión.