Nuevos indicadores técnicos para MetaTrader 4 - 136
GUME Simple Entry indica los puntos de entrada de compra y venta de todos los instrumentos analizando el movimiento del mercado. Está diseñado para indicar puntos de entrada para cualquier par de divisas y todos los periodos de negociación. Está optimizado para M5 para scalping y M15 y periodos superiores para operaciones a largo plazo. También está optimizado para EURUSD, GBPUSD, GBPJPY, EURJPY y XAUUSD. Está diseñado para mostrar una flecha de color hacia arriba o hacia abajo para la señal de

El indicador muestra los niveles alto/bajo/apertura/cierre de otros períodos de tiempo (y no estándar): año, 6 meses, 4 meses, 3 meses, 2 meses, mes, semana, día, horas H3-H6-H8-H12 M45 M90. También puede configurar el turno para abrir velas y construir velas virtuales. Los "separadores de períodos" para uno de estos períodos de tiempo están disponibles en forma de líneas verticales. Las alertas se pueden configurar para rupturas de los niveles actuales o anteriores (ruptura de la línea Máxima/

Advanced Stochastic Scalper - es un indicador profesional basado en el popular oscilador estocástico. Advanced Stochastic Scalper es un oscilador con niveles dinámicos de sobrecompra y sobreventa, mientras que en el oscilador estocástico estándar, estos niveles son estáticos y no cambian. Esto permite a Advanced Stochastic Scalper adaptarse a los constantes cambios del mercado. Cuando aparece una señal de compra o de venta, se dibuja una flecha en el gráfico y se activa una alerta que le permite
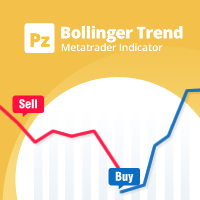
Una implementación personal del famoso indicador de bandas de Bollinger como mecanismo de seguimiento de tendencia, que utiliza una media móvil y la desviación estándar para definir qué es una tendencia y cuándo cambia. Las bandas de Bollinger se utilizan normalmente sólo como un indicador de sobreventa/sobrecompra, pero en mi opinión, el enfoque de trading es más completo utilizando la variante de tendencia como estrategia de salida. [ Guía de instalación | Guía de actualización | Solución de p
FREE
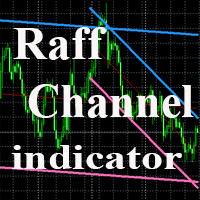
El indicador traza un canal de tendencia utilizando la técnica de Gilbert Raff. El eje del canal es una regresión de primer orden. Las líneas superior e inferior muestran la distancia máxima a la que la línea Close se ha alejado de la línea del eje. Por lo tanto, las líneas superior e inferior pueden considerarse líneas de resistencia y soporte, respectivamente. Una versión similar del indicador para el terminal MT5
Por regla general, la mayoría de los movimientos del precio se producen dentro
FREE

Una ayuda sencilla pero eficaz que le permitirá seguir las tendencias tanto globales como locales del mercado. El indicador combina el trabajo de dos osciladores: Estocástico y RSI. Ambos indicadores pueden ajustarse a cualquier marco temporal.
Ventajas de uso Multitimeframe - puede ajustar ambos indicadores a los marcos temporales deseados. Para obtener los puntos de entrada, puede utilizar el sistema de triple pantalla de Elder. Altamente personalizable - puede configurar no sólo los parámetr
FREE
El indicador Signal SASON está diseñado para generar señales de trading. Funciona para encontrar posibles puntos de entrada de operaciones. Las señales se encuentran analizando una serie de movimientos de velas y un conjunto de algoritmos. Este indicador calcula los puntos de inversión del par que esté utilizando. No tiene propiedades engañosas como el repintado.
Reglas y características Cuando llega una señal, se recomienda utilizar el nivel de take profit y stop loss. Utiliza timeframe M15 y
Heterodyne Heterodino es un oscilador basado en el indicador de índice de fuerza (RSI). El valor actual de las lecturas del indicador se compara con los valores máximo y mínimo del indicador para el período especificado y se calcula el valor promedio. Las lecturas del indicador también se suavizan utilizando el método de media móvil (MA). Una señal de compra es el cruce de un nivel dado por el indicador de abajo hacia arriba, una señal de venta es un cruce de un nivel dado por el indicador de
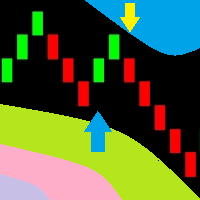
Ahora puede utilizar los gráficos de precios convencionales para mostrar barras Renko. Este indicador puede enviar cuadros de diálogo con alertas, notificaciones push a dispositivos móviles y correos electrónicos. Puede utilizar fácilmente este indicador para crear Asesores Expertos, ya que el indicador utiliza buffers.
Parámetros del indicador Tamaño Renko, puntos - tamaño de las barras Renko Distancia de las flechas, puntos - distancia de las flechas de señal Alertas - true/false - utilizar a

Con el indicador MACD Multi Time Frame, puede detectar divergencias de plazos superiores mientras busca entradas precisas en plazos inferiores. Esta versión GRATUITA del indicador sólo funciona en EURUSD y GBPUSD. La versión completa del indicador se puede encontrar aquí: MACD Multi Cuadro de Tiempo Esta entrada del blog le ofrece GRATIS el Análisis de Divergencia MACD en TIEMPO REAL y consejos sobre cómo operar con las divergencias: Análisis de Divergencia MACD EN TIEMPO REAL El MACD Multi Time
FREE

Muestra en el gráfico el histograma de dos medias móviles. Permite configurar alertas cuando ocurren los cruces de medias. Se puede utilizar con cualquier timeframe, las medias móviles se pueden configurar así como la apariencia y los colores del histograma.
Los ajustes/parámetros son Periodo para la media móvil rápida Periodo para la media móvil lenta Tipo de media móvil Precio utilizado para las medias móviles Alertas en los cruces Anchura de las barras del histograma. Color histograma alcis
FREE

Este indicador es una visión original de los volúmenes. Se sabe que los volúmenes muestran la cantidad de compradores y vendedores durante un cierto período de tiempo. Una vela se utiliza un período de tiempo. Los volúmenes en una vela alta muestran los compradores. Los volúmenes en una vela Baja muestran a los vendedores. Una vela Abierta muestra el Delta. Delta indica quién era dominante en una vela dada, compradores o vendedores.
Parámetros de entrada Distancia - distancia del texto de los v
FREE

Special Trend Oscillator es un indicador diseñado para detectar puntos de cambio de tendencia y medir la potencia de la tendencia actual. Este indicador es un modelo diferente del indicador MACD. El indicador tiene dos canales. El canal azul es la línea superior de la tendencia alcista. La línea roja del canal es la línea inferior de la tendencia bajista. Compre cuando la línea de tendencia alcance la línea roja. Venda cuando la línea de tendencia alcance la línea azul. Nuestros productos más po

El indicador tiene las siguientes características Tendencia Predictiva (Histograma) - utiliza un cálculo avanzado de probabilidad predictiva y estadística más regresión lineal para conocer la posible tendencia. Debe utilizarse con al menos 3 marcos temporales para una lectura más precisa de la tendencia: D1, H4, H1. En algunos casos (subjetivos), se puede utilizar M5 para una lectura más precisa. Velocidad (Línea de puntos) - La línea de puntos verde indica una velocidad de movimiento del precio

Harmonic Master Scanner es una herramienta dinámica que ayuda a los operadores de armónicos a identificar y dibujar patrones armónicos en el gráfico. Harmonic Master Scanner es un software diseñado para trabajar en MetaTrader 4. Harmonic Master Scanner funciona basado en el indicador Zigzag original de MetaTrader 4 y en los elementos estándar de los patrones armónicos. Este software puede enviarle alertas y correos electrónicos cuando se detecta un patrón armónico en cualquier gráfico. El punto

Este indicador de marco de tiempo múltiple y símbolo múltiple identifica formaciones superiores / inferiores dobles o triples o una ruptura del escote siguiente (superior / inferior confirmada). Ofrece filtros RSI, pin bar, envolvente, pinzas, estrella matutina / vespertina, así como opciones de filtro de divergencia MACD, Awesome (AO) o RSI que permiten filtrar solo las configuraciones más fuertes. El indicador también se puede utilizar en modo de gráfico único. Lea más sobre esta opción

Este panel está diseñado para la búsqueda visual rápida de los patrones de acción del precio en varios instrumentos simultáneamente. Es posible añadir y eliminar instrumentos. Al hacer clic en el botón de señal, se puede pasar rápidamente al gráfico con el patrón y el marco temporal identificados. El panel busca 8 patrones de velas: PIN-BAR, EXTERNAL BAR, INSIDE BAR, DOJI, LEVEL, HIGH/LOW OF N BAR, FAKEY, ONE-WAY N BAR. Cualquiera de los patrones se puede desactivar haciendo clic en su título. T

Chart Time: - El Indicador Hora del Gráfico es muy simple y fácil, pero puede ser muy importante controlar el tiempo antes de abrir cualquier operación manual. Este indicador muestra el tiempo en el gráfico entre 3 opciones diferentes. Parámetros de entrada : - Mostrar Tiempo : Seleccione todas las opciones de tiempo que desee ver. Hora local (Hora del equipo personal), Hora del servidor (Hora del intermediario) o Hora GMT. Recomendaciones: - Use solo un Indicador de tiempo de gráfico p
FREE
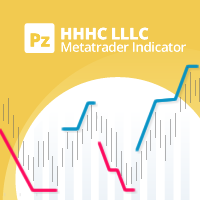
Una implementación personal de un famoso principio de tendencia conocido como higher high, higher close, lower low, lower close (HHHC - HHHL). Utiliza únicamente la acción del precio para determinar la dirección de la tendencia, los cambios de tendencia y las zonas de retroceso. [ Guía de instalación | Guía de actualización | Solución de problemas | FAQ | Todos los productos ] Periodo de ruptura personalizable Colores y tamaños personalizables No repinta ni retropinta Implementa alertas de todo
FREE

El indicador KFX High and Tight Flag pattern forma parte del Asesor Experto manual KFX Pattern. El indicador muestra el nivel de entrada (breakout) con el objetivo de beneficio y el stop loss. La estrategia se basa en el libro de Thomas Bulkowski, Encyclopedia of Chart Patterns segunda edición. Las Banderas Altas y Bajas son el Patrón Gráfico de mejor rendimiento tanto en mercados alcistas como bajistas. Son el patrón perfecto para seguir la tendencia. Adecuado para todos los pares de divisas, o
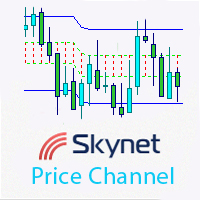
Este indicador muestra un canal de precios equidistante, identifica tendencias a corto plazo y encuentra automáticamente los mejores niveles para los bordes superior e inferior del canal. Está optimizado para los principales plazos y pares de divisas.
Ventajas visualización de tendencias a corto plazo ajuste automático de los bordes superior e inferior del canal adecuado para estrategias de scalping basadas en un rebote desde los bordes del canal
Parámetros smooth - coeficiente de suavizado de

Con este sistema puede detectar operaciones de alta probabilidad en dirección a tendencias fuertes. ¡Puede beneficiarse de los movimientos stop hunt iniciados por el dinero inteligente!
Información importante Cómo puede maximizar el potencial del escáner, por favor lea aquí: www.mql5.com/en/blogs/post/718109 Lea también el blog sobre el uso del indicador: Trading profesional con fuerte impulso Esta versión GRATUITA del indicador funciona sólo en EURUSD y GBPUSD. La versión completa del indicado
FREE
Se trata de un indicador de propósito general que muestra líneas de color en intervalos de precios fijos y personalizables, introducidos como parámetros. Ofrece intervalos de precios universales, constantes y familiares que permiten un análisis de precios rápido y preciso de un par de divisas. Con los parámetros por defecto, este indicador implementa La Teoría de los Cuartos , como fue descrita originalmente por Ilian Yotov . [ Guía de instalación | Guía de actualización | Solución de problemas
FREE
El indicador KFX Bulls and Bears consolida los indicadores de muestra Bulls y Bears Power en un solo indicador. Este indicador es una modificación de un conocido indicador Bulls/Bears power de Elder. Mide la distancia entre el precio extremo y los promedios móviles.
Parámetros Fuente - elija entre Cierre, Apertura, Máximo, Mínimo, Mediana, Precio Típico o Ponderado. Periodos - periodo para calcular las medias móviles. Tipo de MA - Seleccione entre Simple, Exponencial, Suavizada o Lineal Pondera

Este indicador incluye varios tipos de medias móviles. El indicador contiene el siguiente conjunto de medias móviles: CA (Media móvil acumulativa) MIN (Mínimo del período) MAX (Máximo del período) SMA (Media móvil simple) EMA (Media móvil exponencial) DMA (Media móvil exponencial doble) TMA (Media móvil exponencial triple) LWMA (Media móvil ponderada lineal) SMM (Media móvil simple) SMMA (Media móvil suavizada) HMA (Media móvil Hull) NoLagMa La lista de medias móviles se ampliará con nuevas vers
FREE
La desviación típica con niveles es una modificación del indicador Desviación típica, complementada con los niveles de Máximos y Mínimos previstos. Los niveles se trazan utilizando el indicador Bandas de soporte y resistencia , que determina los niveles Máximo y Mínimo más cercanos al valor actual del indicador basándose en los valores históricos de los extremos.
Parámetros período de desviación estándar - período del indicador de desviación estándar. período del detector de extremos - período
FREE

Difícil de encontrar y escasa en frecuencia, las divergencias son uno de los escenarios comerciales más confiables. Este indicador busca y escanea las divergencias regulares y ocultas automáticamente usando su oscilador favorito. [ Guía de instalación | Guía de actualización | Solución de problemas | FAQ | Todos los productos ]
Fácil de comerciar
Encuentra divergencias regulares y ocultas Admite muchos osciladores bien conocidos Implementa señales comerciales basadas en rupturas Muestra nive

Este indicador visualiza la intersección de dos medias móviles. (SМА, EMA, SMMA, LWMA). Ha sido creado para visibilidad de señales y notificación sobre intersecciones de Medias Móviles. Media móvil es simplemente el valor promediado del precio para el marco de tiempo seleccionado (TF).
Por lo tanto, las medias móviles se utilizan en una amplia variedad de marcos temporales, desde 1 minuto hasta un año e incluso décadas.
Posibles tipos de medias móviles en el indicador SMA (Media móvil simple);
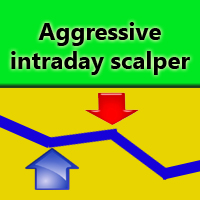
El scalper intradía agresivo es un sistema mecánico de scalping intradía que muestra las señales de apertura y cierre de operaciones como flechas en el gráfico. Cuando surge una señal, el indicador envía notificaciones por correo electrónico y push. Así, usted no tiene que permanecer junto al monitor analizando el mercado y esperando una señal. El scalper intradía agresivo lo hará por usted. El sistema ha sido desarrollado para aquellos comerciantes que no tienen su propio sistema de comercio y
Este indicador le ayuda a Escanear símbolos que están en la Ventana de Observación del Mercado (en demo Max 15 Symbol) y filtrar tendencias con alertas. Funciona basado en el indicador más popular "Bandas de Bollinger" que es utilizado por muchos comerciantes para el comercio: Cuando el color de la caja cambia a "Verde " o "Rojo ", le indica el cambio de tendencia para la entrada larga y corta. También recibirá una alerta en la pantalla. Cuando cambia a "Verde ", le indica que la tendencia va ha
FREE

Modificación del indicador Estocástico con varios tipos de alertas añadidas para ayudarle en su búsqueda de mejores oportunidades en el mercado.
Características del producto Alerta por email Alerta sonora Notificación Push (Las alertas pueden ser enviadas a su teléfono móvil) Señales en el gráfico Cuadro de alerta
Parámetros del indicador Notificación Push - Esta opción permite a su MetaTrader 4 enviar alertas a su teléfono inteligente (IOS o Android). Alerta por correo electrónico - Configure

Con el indicador MACD Multi Time Frame puede detectar divergencias de plazos más altos mientras busca entradas precisas en plazos más bajos. Esta entrada del blog le da en tiempo real MACD Divergence Analysis de forma gratuita y consejos sobre cómo el comercio de las divergencias: Análisis de Divergencia MACD en Tiempo Real El MACD Multi Time Frame le da una muy buena visión general de lo que está sucediendo en plazos superiores sin necesidad de cambiar al plazo superior. Por ejemplo, siempre ve

Nuestro indicador utiliza un patrón de velas de acción de precio único llamado Engulfing, este indicador representa el comportamiento de la acción del precio en su gráfico metatrader4. El indicador busca el patrón envolvente más valioso y lo identifica como niveles de soporte y resistencia.
Parámetros del indicador Barras a calcular: máximo de barras a buscar. Opción de Alerta: Verdadero / Falso. Vela bajista: color de la vela bajista detectada. Vela alcista: color de la vela alcista detectada.

GTAS FidTdi es un indicador de tendencia que utiliza una combinación de volatilidad y niveles potenciales de retroceso. Este indicador fue creado por Bernard Prats Desclaux, proprietary trader y ex gestor de fondos de cobertura, fundador de E-Winvest.
Descripción El indicador se representa como una envolvente roja o verde por encima o por debajo de los precios.
Modo de empleo Detección de la tendencia Cuando la envolvente es verde, la tendencia es alcista. Cuando es roja, la tendencia es bajis
FREE

GTAS S-Trend es un indicador de momentum que ayuda a determinar tendencias utilizando una combinación de MACD, RSI y medias móviles. Este indicador fue creado por Bernard Prats Desclaux, proprietary trader y ex gestor de fondos de cobertura, fundador de E-Winvest.
Descripción El indicador oscila entre -65 y +65 con una zona neutra entre -25 y +25 alrededor de una línea de equilibrio 0. La tendencia S entre -25 y +25 indica zonas de congestión con un sesgo alcista entre 0 y +25, y un sesgo bajis
FREE
GTAS Power es un indicador de impulso que ayuda a determinar tendencias profundas mediante la combinación de medias móviles. Este indicador fue creado por Bernard Prats Desclaux, proprietary trader y ex gestor de fondos de cobertura, fundador de E-Winvest.
Descripción El indicador se representa como un histograma verde o rojo alrededor de una línea de equilibrio 0.
Modo de empleo Cuando GTAS Power es verde, la tendencia profunda es alcista. Cuando es rojo, la tendencia profunda es bajista. Est
FREE

Este indicador está diseñado para detectar las mejores divergencias entre precio/MACD y precio/RSI. MACD y RSI producen con mucho las mejores señales de divergencia por lo tanto este indicador se centra en esas dos divergencias. Esta es la versión GRATUITA del indicador: https://www.mql5.com/en/market/product/28375
Información Importante Cómo puede maximizar el potencial del escáner, por favor lea aquí: www.mql5.com/en/blogs/post/718074
La versión gratuita sólo funciona con EURUSD y GBPUSD. Es
FREE

Este indicador está diseñado para detectar las mejores divergencias entre precio/MACD y precio/RSI. MACD y RSI producen las mejores señales de divergencia por lo tanto este indicador se centra en esas dos divergencias. Este indicador escanea para usted hasta 30 instrumentos y hasta 8 marcos temporales en busca de divergencias alcistas y bajistas. Sólo tiene que añadir el indicador a un único gráfico . El indicador escaneará automáticamente todos los instrumentos y plazos configurados.
Informaci

Este indicador muestra los niveles y puntos de señal del patrón Doji. El indicador permite a los operadores determinar fácilmente la posible ubicación de un rebote del precio. Doji es una vela con el precio de apertura y cierre iguales, o casi iguales. También debe tener sombras de aproximadamente el mismo tamaño en ambos lados. Doji denota el equilibrio entre compradores y vendedores, o la ausencia de jugadores importantes, o la prueba de nivel. Este patrón puede significar tanto una inversión

Este indicador calcula la fuerza de las principales divisas (EUR, USD, CAD, GBP, CHF, NZD, USD, JPY) y muestra los 4 pares de divisas más fuertes que se encuentran actualmente en una tendencia de alta probabilidad para el día o para la semana.
Uso El indicador muestra 8 pares de divisas con una dirección de tendencia (por ejemplo, "EURUSD-ABAJO") y clasificados según su fuerza, siendo 1 el más fuerte. Habrá 4 pares para intradía y 4 pares para intra semana. Si un par de divisas se encuentra ent
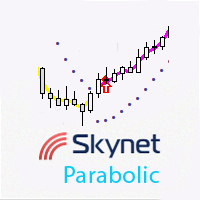
Este indicador muestra los puntos de entrada para comprar y vender, con notificaciones push adicionales. Se basa en el clásico indicador SAR Parabólico, el modelo de suavización de precios y ciertos métodos matemáticos para una mayor variabilidad en la búsqueda de puntos de entrada al mercado.
Ventajas Menos entradas erróneas en comparación con el uso de indicadores clásicos de ruptura y confirmación de tendencia. Las señales no se redibujan. Gran número de parámetros personalizables. Visualiza

EFW Pattern Trader es un potente escáner de patrones para operar en Forex y Bolsa. La detección de patrones en EFW Pattern Trader utiliza la Teoría de la Onda Fractal, que captura el interminable movimiento ascendente y descendente del mercado. Por lo tanto, EFW Pattern Trader puede ser considerado como un robusto indicador de la acción del precio. Cualquier patrón en EFW Pattern Trader puede ser backtested visualmente en su probador de estrategia. El backtesting visual con el patrón le mostrará
El indicador Roll está diseñado para encontrar extremos locales y determinar la tendencia actual. El indicador se basa en los valores de volumen y volatilidad. El cálculo del indicador puede modificarse activando el parámetro Modificación y eligiendo una de las opciones de cálculo disponibles en CalcMode . Para poder determinar la tendencia actual utilizando este indicador, debe aumentar el valor del parámetro OsPeriod y disminuir los valores de DynamicLevelPeriod y ShiftDynamicLevel . El indica

Determinar la tendencia actual es una de las tareas más importantes para un operador, independientemente de su estilo de negociación. Linear Trend puede ayudarle en esta tarea. Linear Trend es un indicador de determinación de tendencia que utiliza un algoritmo de cálculo original. El indicador es adecuado para cualquier par de divisas y marco temporal. No cambia sus lecturas. El producto aplica tres métodos seleccionados por un determinado parámetro y una modificación adicional de los resultados
El indicador le ayudará a encontrar los niveles de soporte y resistencia, aumentar el número de confirmaciones de los niveles más fuertes. Este no es un indicador multi-marco de tiempo que se refiere a la información de otros marcos de tiempo. Pero permite mostrar niveles fuertes de soporte y resistencia donde el precio respeta una marca dos o más veces. Cómo operar: Para marcos temporales más pequeños hasta M30 recomiendo al menos 3 confirmaciones. Esto filtra niveles más fuertes con movimiento

Este indicador le ayuda a Escanear símbolos que están en la Ventana de Observación del Mercado y filtrar tendencias con alertas. Funciona basado en el efectivo indicador "SUPERTREND" que es usado por muchos operadores para operar: Cuando el color del recuadro cambia a "Verde " o "Rojo" , le indica un cambio de tendencia para entrar en largo o en corto. También recibirá una alerta en la pantalla. Cuando cambia a "Verde ", le indica que la tendencia va hacia arriba, y usted puede tomar la entrada
FREE

Index Hub está diseñado para crear indicadores multidivisa utilizando hasta 14 pares de divisas y cualquiera de los 6 indicadores: Estocástico, WPR, RVI, RSI, Fuerza y CCI. Un ejemplo con tres pares y el indicador CCI: CCI(USDCAD)+CCI(USDJPY)+CCI(USDCHF) / 3 = CCI(Index Hub).
Aplicación Index Hub es adecuado para los siguientes tipos de trading: basket trading, scalping y estrategias de arbitraje. Por ejemplo, si necesita utilizar el Estocástico con fines de scalping, establezca dos indicadores

El indicador técnico Currency Strength 7 es una poderosa herramienta diseñada para ayudar a los operadores a medir la fortaleza de las siete monedas más populares. Al analizar la fortaleza de AUD, USD, EUR, GBP, JPY, CHF y CAD, este indicador proporciona información valiosa sobre la dinámica de las divisas. Representa la fuerza de la moneda en el gráfico mediante líneas, lo que permite a los operadores evaluar rápidamente la fuerza relativa de las diferentes monedas. Una de las característic

BillWill El indicador se basa en materiales extraídos del libro: Bill Williams. Caos comercial. Técnicas expertas para maximizar los beneficios. Las lecturas del indicador en la parte superior de cada barra se calculan en función de la posición de los precios de apertura y cierre en relación con un tercio de la barra. La barra está dividida en tres partes, el tercio inferior de la barra es el número tres (3), el tercio medio de la barra es el número dos (2), el tercio superior de la barra es e
FREE

Sidus El indicador es una estrategia comercial. Basado en 3 indicadores estándar: dos promedios móviles (MA) y un índice relativo a la fuerza (RSI). Las señales del indicador son el cruce de las medias móviles y el posicionamiento simultáneo del indicador RSI con respecto al nivel 50. Si la media móvil rápida está por encima de la media móvil lenta y el indicador RSI está por encima del nivel 50, se asumen compras. Si el promedio de movimiento rápido está por debajo del promedio de movimiento
El indicador muestra flechas de entrada al mercado basadas en RSI, MFI, DeMarker, CCI y Multi Stochastic.
Entradas period - valores de todos los indicadores utilizados. Enable_Alert - notificaciones de audio y texto en un cambio de tendencia. Send_Notifications - notificaciones push a dispositivos móviles. E-mail alert - notificaciones por correo electrónico. Asegúrese de configurar los parámetros de correo electrónico en la configuración del terminal.
Características El indicador no se vuelve

Este indicador escanea para usted hasta 30 instrumentos de negociación y hasta 8 marcos temporales en busca de patrones de inversión de alta probabilidad: Dobles Tops/Bottoms con falsas rupturas . Por favor, lea también la entrada del blog "Operativa Profesional con Dobles Máximos/Bajos y Divergencias " que explica los conceptos detrás del indicador ULTIMO de Dobles Máximos/Bajos y cómo puede utilizar un enfoque profesional descendente. Esta versión GRATUITA del escáner escanea sólo EURUSD y GBP
FREE
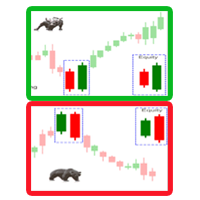
Un indicador de cambio de tendencia basado en el patrón de velas. Un patrón de velas es un movimiento en los precios que se muestra gráficamente en un gráfico de velas que el operador puede predecir un movimiento particular del mercado. Patrón envolvente: Un patrón de inversión que puede ser bajista o alcista, dependiendo de si aparece al final de una tendencia alcista (patrón envolvente bajista) o una tendencia bajista (patrón envolvente alcista). El indicador Envolvente de Esparta es una varia
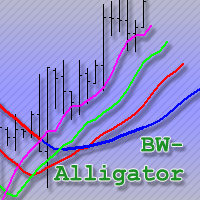
Una versión mejorada del clásico indicador Alligator de Bill Williams.
Descripción El indicador técnico Alligator es una combinación de medias móviles (líneas de equilibrio). La línea azul (Alligator Jaw) es una media móvil suavizada de 13 periodos, desplazada 8 barras hacia el futuro; La línea roja (Dientes de cocodrilo) es una media móvil suavizada de 8 periodos, desplazada 5 barras hacia el futuro; La línea verde (Labios de cocodrilo) es una media móvil suavizada de 5 periodos, desplazada 3

El indicador Master Pivot es un generador muy interesante de niveles estáticos basados en la variación porcentual histórica. Los niveles son completamente personalizables cambiando los números de entrada. El periodo también se puede modificar para seleccionar el Time Frame preferido. El color es flexible para que pueda cambiar de color con facilidad, se recomienda un color rojo superior e inferior verde para un estilo contrarian, por el contrario en lugar de un estilo seguidor de la tendencia. E

El objetivo principal del indicador es determinar los puntos más óptimos de entrada y salida de una operación. El indicador consta de tres partes. La primera son flechas que muestran los puntos de entrada/salida del mercado más eficientes. La flecha hacia arriba es una señal de compra, la flecha hacia abajo es una señal de venta. El indicador contiene un algoritmo de análisis analítico que incluye un conjunto de lecturas de indicadores estándar, así como un algoritmo personalizado. La segunda pa

El GTAS BSI es un indicador diseñado para proporcionar la dirección de la tendencia y señales de compra/venta, utilizando una combinación de indicadores de impulso. Este indicador fue creado por Bernard Prats Desclaux, proprietary trader y ex gestor de fondos de cobertura, fundador de E-Winvest.
Descripción El indicador BSI se representa como un histograma bajo el gráfico de precios. Un valor de +100 (verde) indica una tendencia alcista. El valor -100 (rojo) indica una tendencia bajista. Cuando
FREE

El indicador mide volúmenes en diferentes gráficos e instrumentos. Su principal ventaja es la posibilidad de comparar distintos brokers. Cuanto menos Volumen Medio y Tick / Segundo , más fiable es el broker. Hay un comentario en la esquina superior izquierda Datos del comentario: Tick/Segundo - número de ticks por segundo para un instrumento seleccionado Middle Volume - volúmenes medios en la penúltima barra Este indicador permite realizar un seguimiento relativo de la actividad del mercado para
FREE
El indicador BinaryFiesta ha sido desarrollado y adaptado específicamente para operar con opciones binarias a corto plazo. El algoritmo del indicador analiza numerosos factores antes de generar una señal. El indicador se instala de la forma convencional. El indicador consta de una ventana de información, que muestra el nombre del instrumento de negociación, los niveles de soporte y resistencia, y la propia señal (COMPRA , VENTA o ESPERA ). La señal va acompañada de un sonido y una alerta emergen

Se trata de un indicador sencillo que muestra si las direcciones de la tendencia global y local coinciden. Utiliza dos marcos temporales, uno "local" y otro "global" de orden superior. El indicador sólo muestra la acción del precio y no tiene retardo. Genera una onda cuadrada (línea verde), la señal de salida es superior a cero si la tendencia del precio es alcista, e inferior a cero para la tendencia bajista. La línea roja muestra la tendencia de un marco temporal de orden superior (la tendenci

Sweep Trend El indicador marca en el gráfico, en forma de rectángulo, partes volátiles del movimiento del precio de acuerdo con la configuración especificada.
Descripción de la configuración TrendPips - valor de filtro en puntos TrendBars - valor de filtro en número de barras signal_shift: cambio relativo a la barra actual en un número específico de períodos hacia atrás, para señales CountBars: el número de barras para mostrar el indicador Color_1: uno de los colores de los rectángulos altern
FREE
El controvertido sistema de 5 pasos que utilizan los operadores profesionales para alcanzar el éxito en sus operaciones.
Reversal Pro combina eficazmente la acción del precio, la ubicación ideal y estadísticas fiables en un algoritmo inteligente. Entender el mercado en esta perspectiva única le permite reconocer reversiones profesionalmente.
Descubra el secreto de los operadores profesionales
Obtenga acceso instantáneo www.mql5.com/en/blogs/post/716077 ¡Copia y Pega lo que los traders profes

xCalper Triad funciona como una herramienta de exploración de objetivos. Su algoritmo calcula las zonas de nivel de precios con gran precisión y al instante. Por defecto, se identifican automáticamente y el operador normalmente sólo establece parámetros visuales. Explore una nueva perspectiva en el análisis de la acción del precio añadiendo Triad a su configuración y sorpréndase.
Características principales Niveles objetivo automáticos y exclusivos Representación de velas diarias en todos los p

Este indicador está diseñado para operar con órdenes stop pendientes en los niveles calculados. Estos niveles están marcados con los nombres "STOP DE COMPRA" y "STOP DE VENTA", y las correspondientes etiquetas de precio. Además, el indicador informa al usuario sobre la dirección de negociación preferida mediante una flecha, así como otros medios de notificación disponibles, que pueden personalizarse.
Parámetros Tipo de Cálculo - tipo de cálculos: Precio Cierre - basado en los precios de Cierre.

Este indicador está diseñado para detectar patrones de inversión de alta probabilidad: Dobles Tops/Bottoms con rupturas falsas . Esta es la versión GRATUITA del indicador: https://www.mql5.com/en/market/product/26371 La versión gratuita sólo funciona con EURUSD y GBPUSD. Por favor, lea también la entrada del blog "Operando Profesionalmente con Dobles Tops/Bottoms y Divergencias " que explica los conceptos detrás del indicador ULTIMATE Double Top/Bottom y cómo puede utilizar un enfoque profesiona
FREE

Si está utilizando el análisis de spreads de volumen, ya sea principiante o experto, este sistema le proporcionará muchas funciones y le ayudará en su análisis. Por favor, vea el video para ver todas las características.
Características Con un clic encontrará todos los patrones VSA en su gráfico . Barras sin precio de apertura. Indicador de volumen de fácil lectura. Lector de barras (Tipo de barra - Tipo de cierre - Tipo de volumen - Tipo de spread). Niveles diarios y semanales (Pivote - Camari
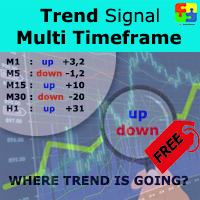
Versión gratuita. Sólo funciona con EURUSD. ¿Quiere saber siempre de un vistazo hacia dónde se dirige el precio? ¿Está cansado de mirar hacia atrás y adelante entre diferentes marcos de tiempo para entenderlo? Este indicador puede ser justo lo que estabas buscando. Trend Signal Multitimeframe le muestra si el precio actual es mayor o menor que N. velas atrás, en los diferentes marcos de tiempo. También muestra cuántos pips por encima o por debajo está el precio actual comparado con N. velas atr
FREE
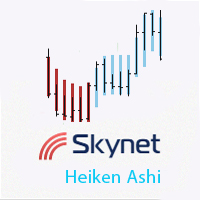
Este indicador muestra la dirección de la tendencia a corto plazo y las zonas planas del mismo modo que el indicador Heiken Ashi clásico, pero no se traza utilizando velas ni una media móvil, sino el indicador Skynet Moving Average.
Ventajas sin retardo, o con un ligero retardo si se utiliza el parámetro "suave". parámetros personalizables para cualquier dato de precios y plazos. visualización de la tendencia plana y a corto plazo. a diferencia del indicador clásico Heiken Ashi, la frecuencia d
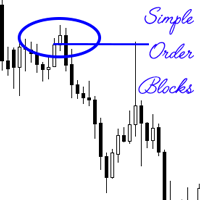
Un bloque de órdenes, también conocido como bloque de órdenes, es una orden significativa de venta o compra de un gran número de valores. Los utilizan a menudo los operadores institucionales, y es una forma diferente de ver el soporte y la resistencia. Estos niveles se utilizan temporalmente, antes de que se creen nuevos niveles y zonas de interés. El indicador simple de bloque de órdenes intenta encontrar los bloques de órdenes, que en la mayoría de los casos son entradas óptimas para operar. L

El indicador muestra los posibles puntos de entrada en una tendencia, mostrando el nivel de compra, el nivel de venta y el punto de oro que determinará dónde salir de la operación o seguir sus paradas. Si se detecta una entrada, el indicador muestra una flecha que apunta hacia abajo para posiciones cortas y hacia arriba para posiciones largas. Cuando el punto de oro se pasa durante una operación, comenzará a dibujar los puntos potenciales para el seguimiento, es entonces hasta usted cómo manejar
Compruebe lo fácil y sencillo que es comprar un robot en la MetaTrader AppStore, la tienda de aplicaciones para la plataforma MetaTrader.
El Sistema de pago MQL5.community permite efectuar pagos con ayuda de PayPal, tarjeta bancaria y los sistemas de pago más populares. Además, le recomendamos encarecidamente testar el robot comercial antes de la compra, para así hacerse una idea más completa sobre él.
Está perdiendo oportunidades comerciales:
- Aplicaciones de trading gratuitas
- 8 000+ señales para copiar
- Noticias económicas para analizar los mercados financieros
Registro
Entrada
Si no tiene cuenta de usuario, regístrese
Para iniciar sesión y usar el sitio web MQL5.com es necesario permitir el uso de Сookies.
Por favor, active este ajuste en su navegador, de lo contrario, no podrá iniciar sesión.