·
3

Vladimir Pastushak
- Trader-Programmer at https//trading-go.net/
- Russia
- 115671
|
13+ years
experience
|
50
products
|
852
demo versions
|
|
0
jobs
|
0
signals
|
0
subscribers
|
👋 My name is Vladimir Pastushak. I am a trader and programmer with more than 20 years of experience in financial markets and developing software solutions for trading automation.
💻 Over the years, I have developed numerous trading algorithms, Expert Advisors, and tools for MetaTrader 4 and MetaTrader 5, continuously testing my ideas in practice.
📊 In my work, I value logic and transparency rather than bold promises: the logic of the algorithm, code quality, detailed trading system configuration, and the ability to objectively evaluate its behavior under different market conditions are important to me.
🔍 All my developments are based on my own practical experience and are tested before publication.
⚙️ I strive to create tools that allow traders to understand how they work, see the available settings, and independently evaluate whether a particular solution is suitable for them.
Set files and demo versions of the products with a 30-day working period.
VR Proton - https://trading-go.net/mqp_proton_zip
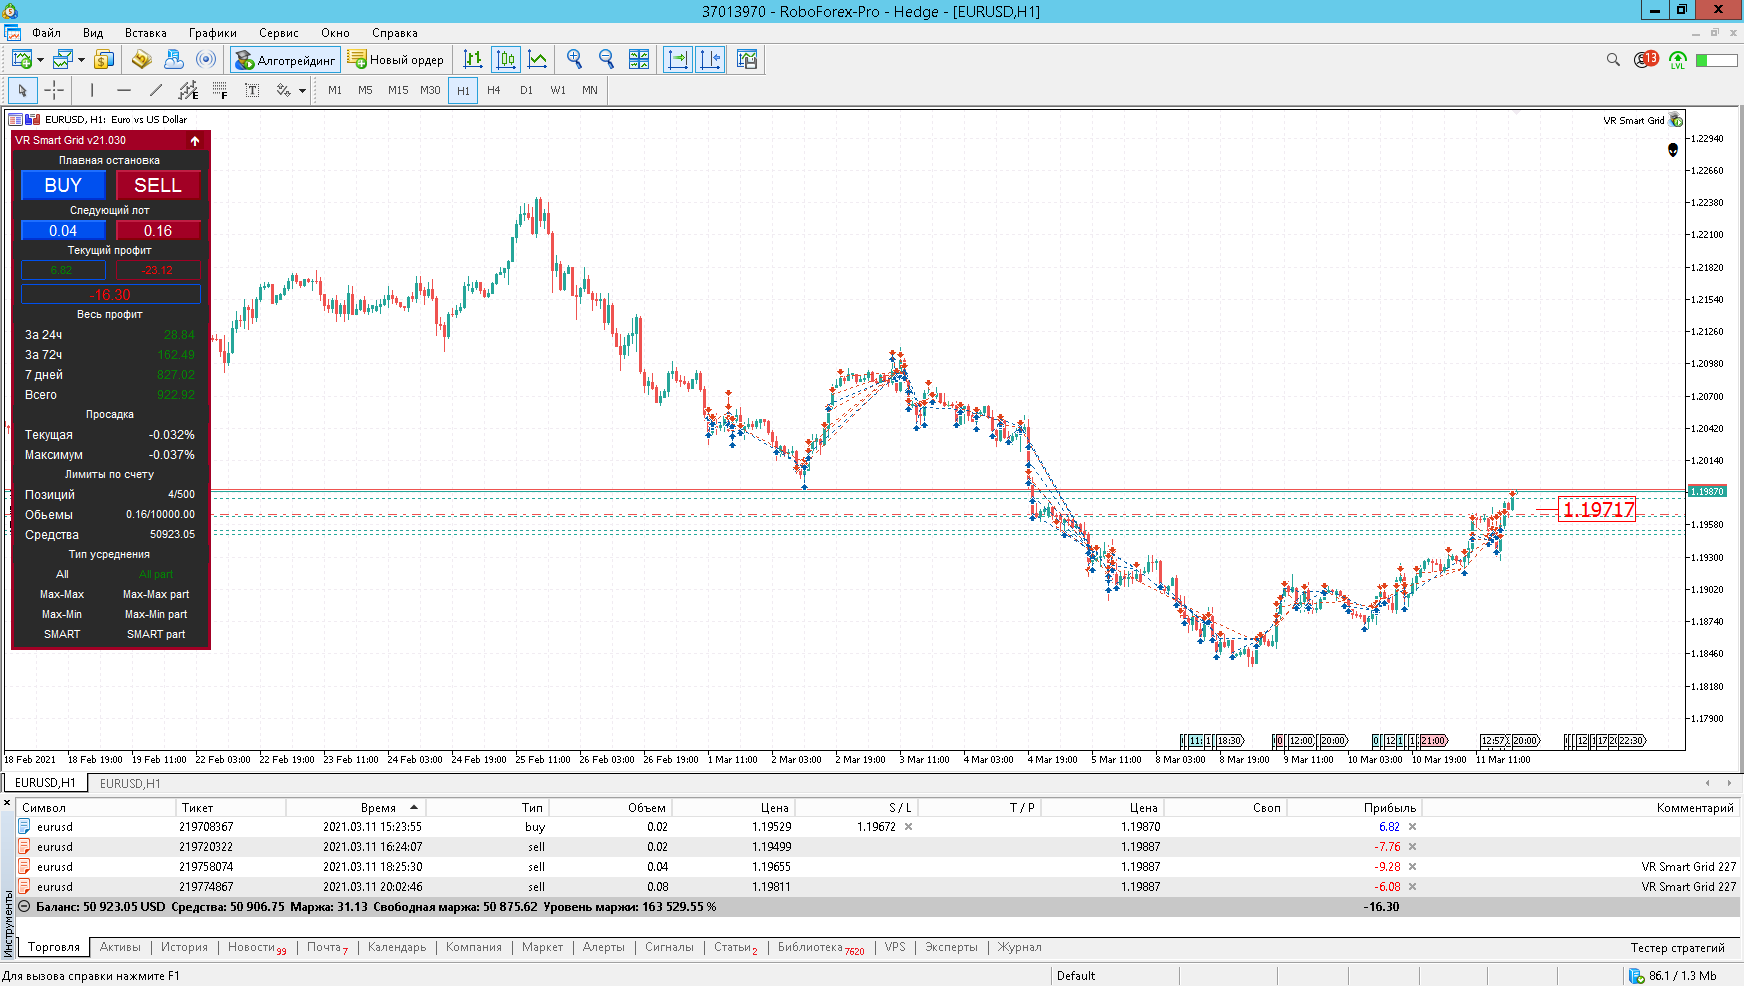
VR Smart Grid - https://trading-go.net/mqp_smart_grid_zip
VR Lollipop - https://trading-go.net/mqp_lollipop_zip
VR Locker - https://trading-go.net/mqp_locker_zip
VR Black Box - https://trading-go.net/mqp_black_box_zip
VR Watch list and Linker – https://trading-go.net/mqp_watch_list_and_linker_zip
VR Trade Panel - https://trading-go.net/mqp_trade_panel_zip
The broker I work with:
RoboForex https://trading-go.net/mqrb
🔥 Everything about trading + Education on Telegram: https://t.me/tgforexen
💥 By purchasing products from official sources, you will receive:
1️⃣ Gifts, bonuses, and other programs.
2️⃣ The opportunity to use programs for free.
3️⃣ Settings and set files for free.
4️⃣ Free technical support.
5️⃣ All updates for free.
💥 Visit my personal website: https://trading-go.net/
💻 Over the years, I have developed numerous trading algorithms, Expert Advisors, and tools for MetaTrader 4 and MetaTrader 5, continuously testing my ideas in practice.
📊 In my work, I value logic and transparency rather than bold promises: the logic of the algorithm, code quality, detailed trading system configuration, and the ability to objectively evaluate its behavior under different market conditions are important to me.
🔍 All my developments are based on my own practical experience and are tested before publication.
⚙️ I strive to create tools that allow traders to understand how they work, see the available settings, and independently evaluate whether a particular solution is suitable for them.
Set files and demo versions of the products with a 30-day working period.
VR Proton - https://trading-go.net/mqp_proton_zip
VR Smart Grid - https://trading-go.net/mqp_smart_grid_zip
VR Lollipop - https://trading-go.net/mqp_lollipop_zip
VR Locker - https://trading-go.net/mqp_locker_zip
VR Black Box - https://trading-go.net/mqp_black_box_zip
VR Watch list and Linker – https://trading-go.net/mqp_watch_list_and_linker_zip
VR Trade Panel - https://trading-go.net/mqp_trade_panel_zip
The broker I work with:
RoboForex https://trading-go.net/mqrb
🔥 Everything about trading + Education on Telegram: https://t.me/tgforexen
💥 By purchasing products from official sources, you will receive:
1️⃣ Gifts, bonuses, and other programs.
2️⃣ The opportunity to use programs for free.
3️⃣ Settings and set files for free.
4️⃣ Free technical support.
5️⃣ All updates for free.
💥 Visit my personal website: https://trading-go.net/