
|
13+ years
experience
|
201
products
|
252
demo versions
|
|
1
jobs
|
0
signals
|
0
subscribers
|
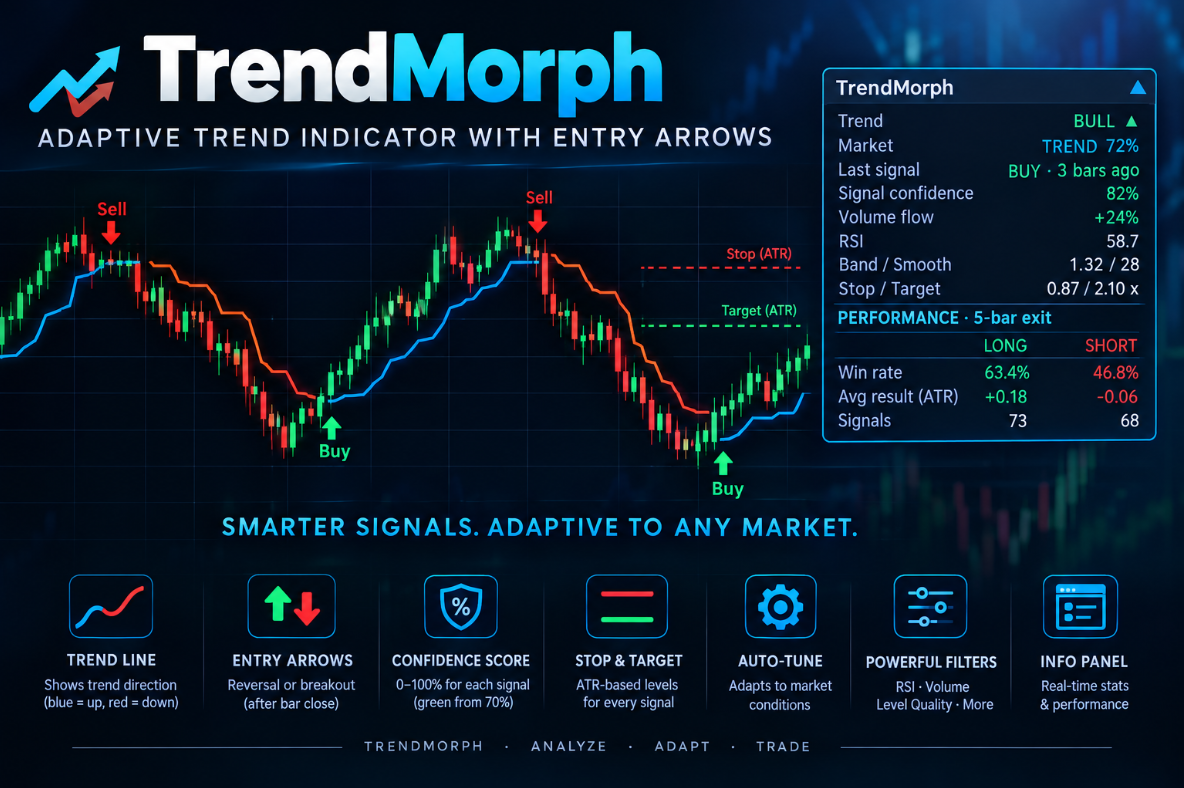
TrendMorph — adaptive trend indicator with entry arrows What it is TrendMorph shows trend direction with a colored line, marks reversal points with Buy/Sell arrows, and gives every signal a confidence score together with Stop/Target levels. The indicator can adapt the sensitivity of its line to the current market state, so the same settings work in both quiet and volatile conditions. An information panel is displayed on the chart and all key values are available in buffers for Expert Advisors
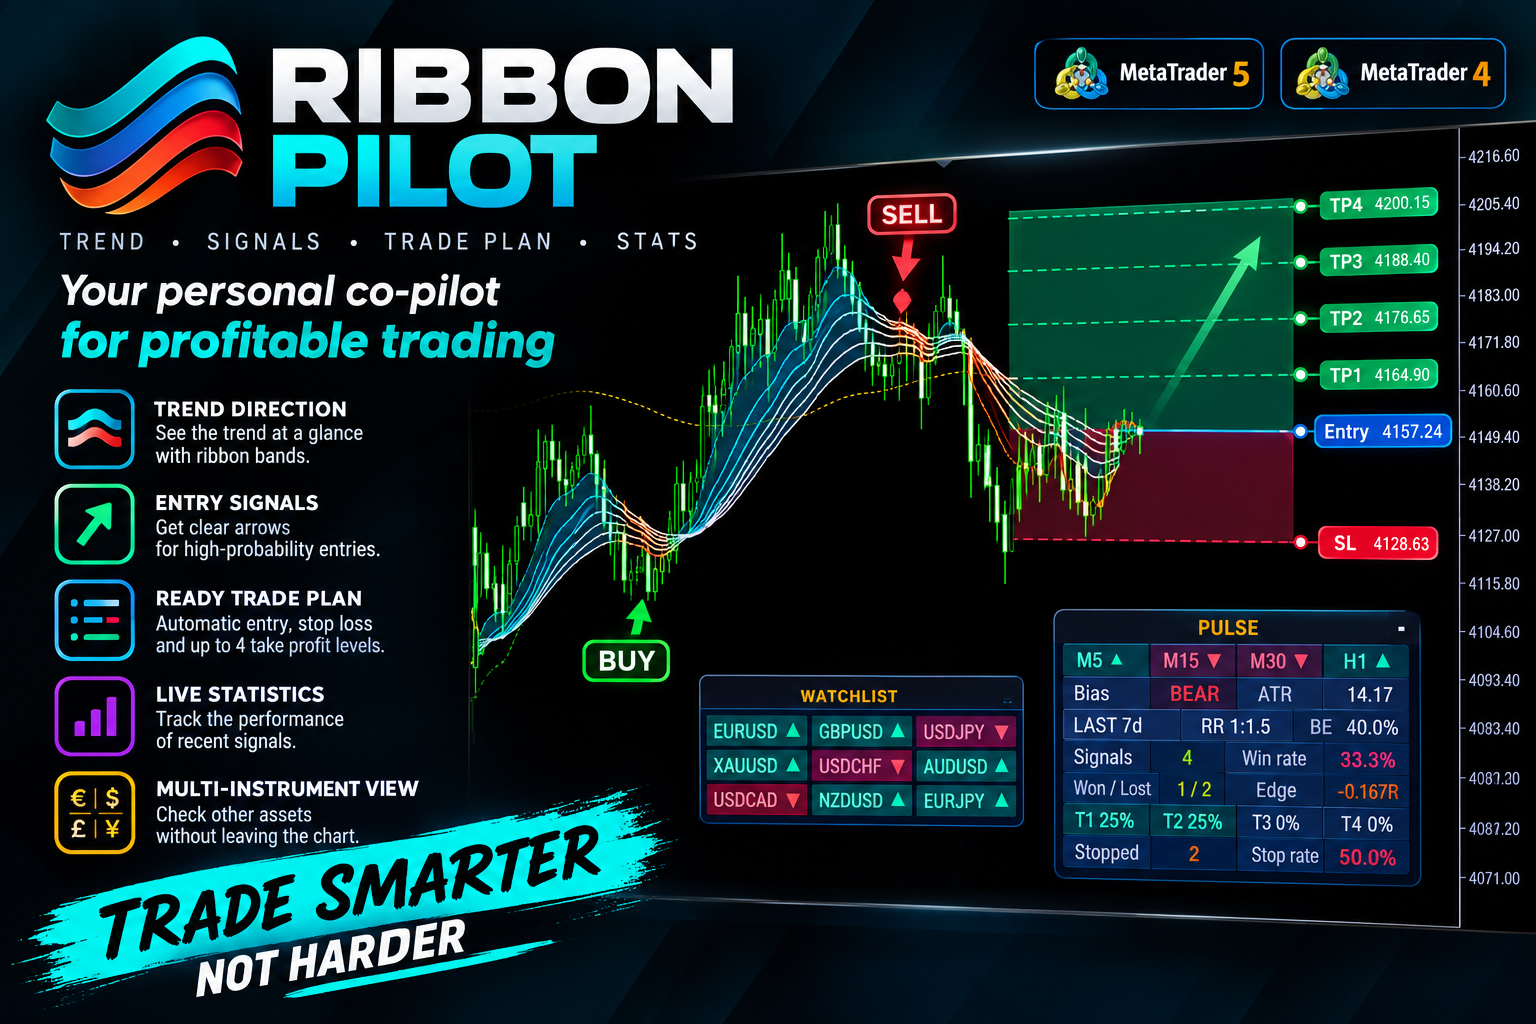
Ribbon Pilot — Trend Ribbon with Trade Zones, Signal History and Watchlist What it is for Ribbon Pilot is a MetaTrader 4 chart indicator that shows the trend direction at a glance, marks entry signals with arrows and draws a ready trade plan at once: entry, stop and up to four profit targets. It also keeps statistics on recent signals and lets you scan other instruments without leaving the chart. MT5-version: https://www.mql5.com/en/market/product/201869 How it works A ribbon of eight
Ribbon Pilot — Trend Ribbon with Trade Zones, Signal History and Watchlist What it is for Ribbon Pilot is a MetaTrader 5 chart indicator that shows the trend direction at a glance, marks entry signals with arrows and draws a ready trade plan at once: entry, stop and up to four profit targets. It also keeps statistics on recent signals and lets you scan other instruments without leaving the chart. MT4-version: https://www.mql5.com/en/market/product/201908 How it works A ribbon of eight
ValueOrbit shows where the "fair" price of the current period sits and how far the market has moved away from it. It is a context tool: it draws a central Value Core line with three pairs of orbit shells (±1σ, ±2σ, ±3σ) around it, and the dashboard reports how stretched price is. It does not generate entry signals. MT5-version: https://www.mql5.com/en/market/product/201292 How it works The Value Core is a reference level that builds up from the start of each period (session, week or month)
ValueOrbit shows where the "fair" price of the current period sits and how far the market has moved away from it. It is a context tool: it draws a central Value Core line with three pairs of orbit shells (±1σ, ±2σ, ±3σ) around it, and the dashboard reports how stretched price is. It does not generate entry signals. MT4-version: https://www.mql5.com/en/market/product/201304 How it works The Value Core is a reference level that builds up from the start of each period (session, week or month)
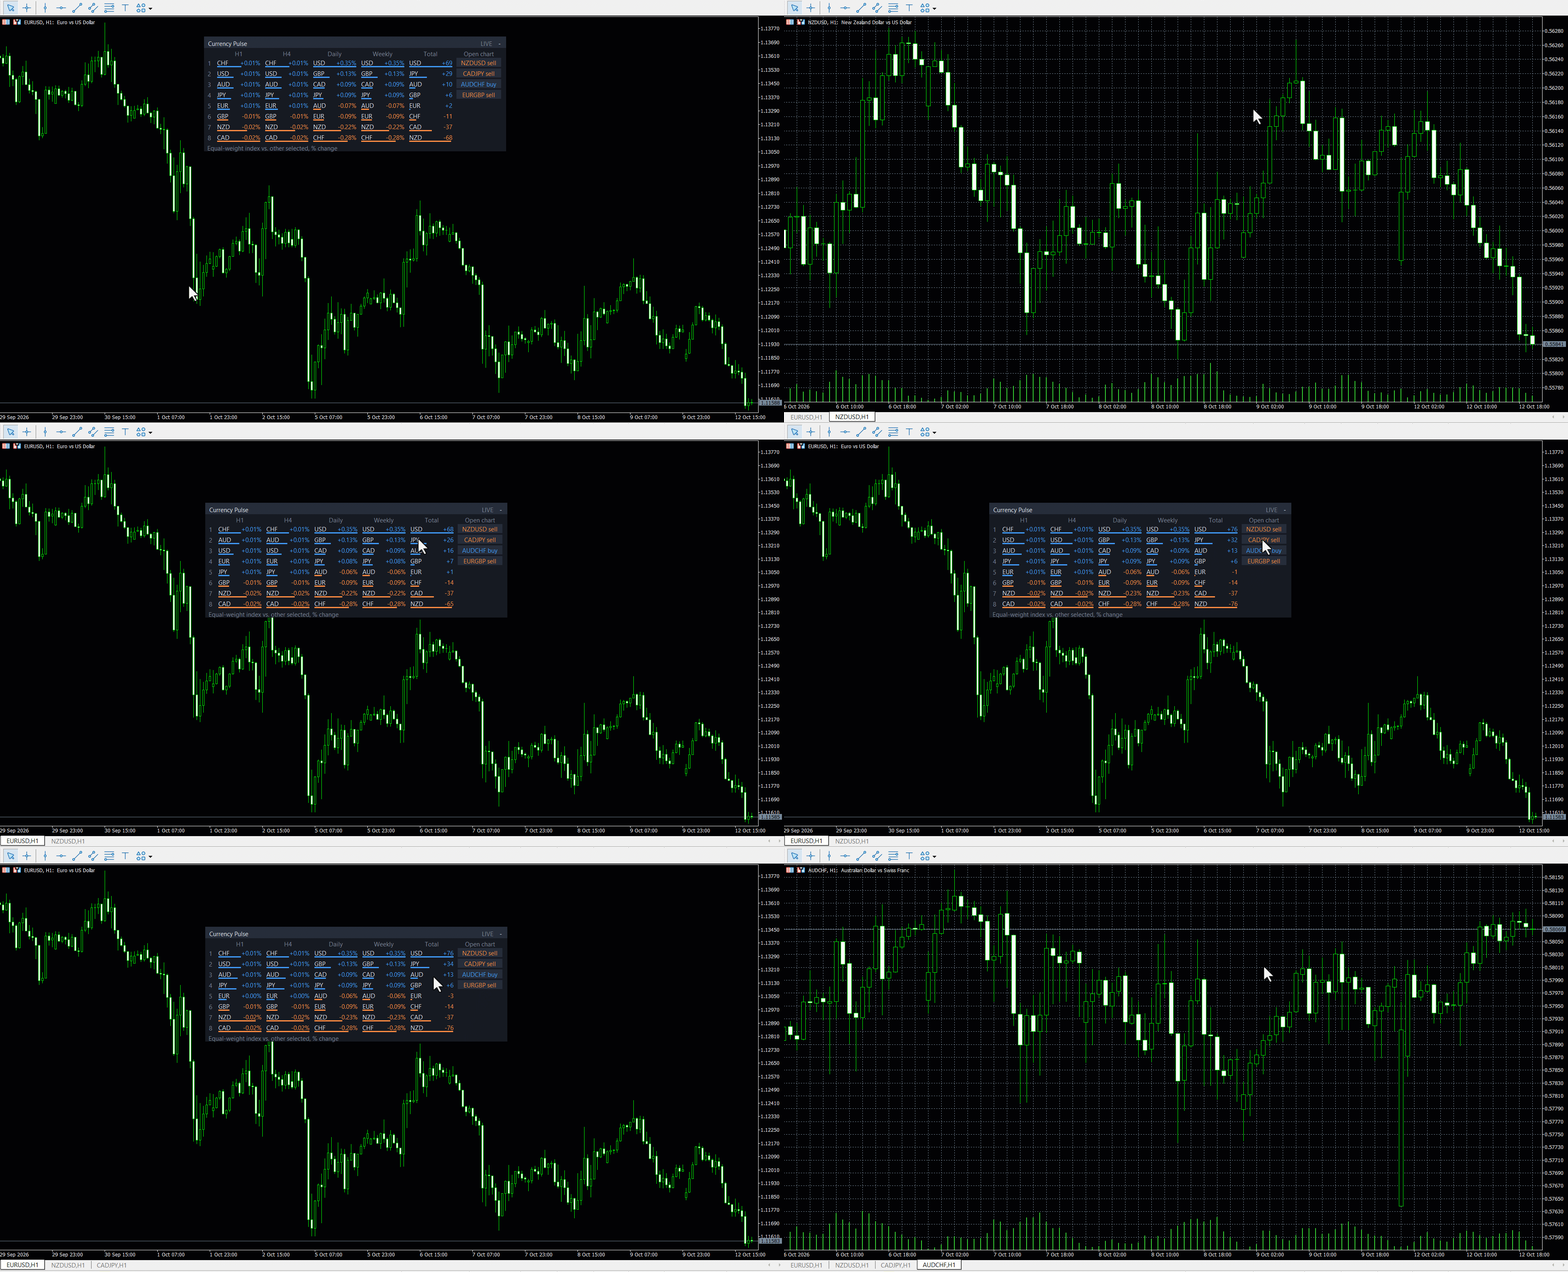
Currency Pulse — currency strength ranking board for MetaTrader 4 What it is for Currency Pulse shows, in one compact panel on your chart, which currencies are strong and which are weak right now, on several timeframes at once. From that ranking the indicator points out the pairs with the widest divergence between currencies: buy the strong one, sell the weak one. The indicator does not depend on the symbol of the chart it is attached to. MT5 -version:
Currency Pulse — currency strength ranking board for MetaTrader 5 What it is for Currency Pulse shows, in one compact panel on your chart, which currencies are strong and which are weak right now, on several timeframes at once. From that ranking the indicator points out the pairs with the widest divergence between currencies: buy the strong one, sell the weak one. The indicator does not depend on the symbol of the chart it is attached to. MT4 -version
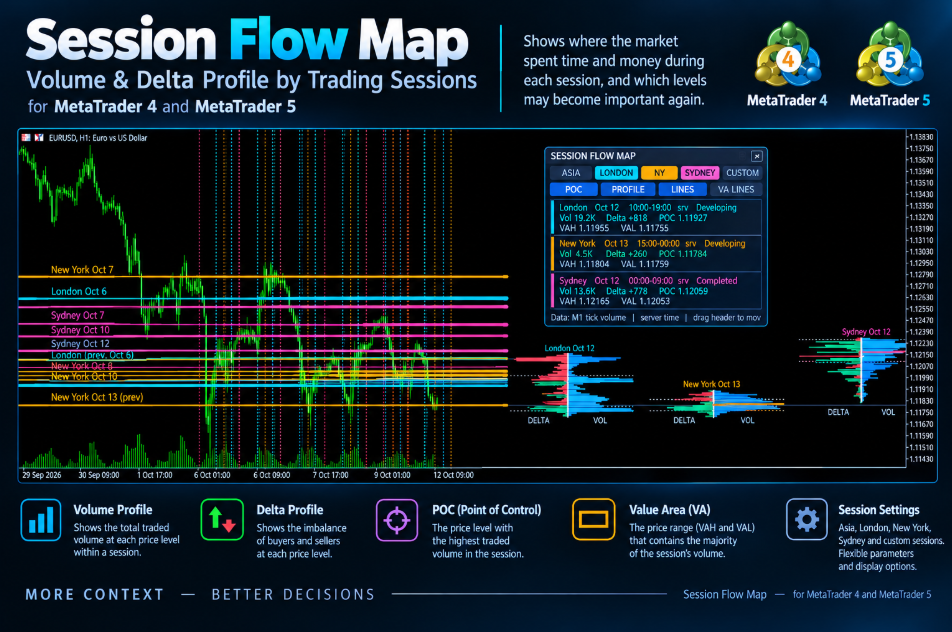
SessionFlowMap — Multi-Session Volume & Delta Profile with POC Levels SessionFlowMap builds a volume profile and a delta profile (buy/sell imbalance) for the sessions of the forex day: Asia, London, New York, plus an optional Sydney and a custom session. For every session it finds the POC (Point of Control — the price with the highest traded volume) and the Value Area (VAH and VAL — the range that holds most of the volume) and projects these levels forward as horizontal lines. You can see at
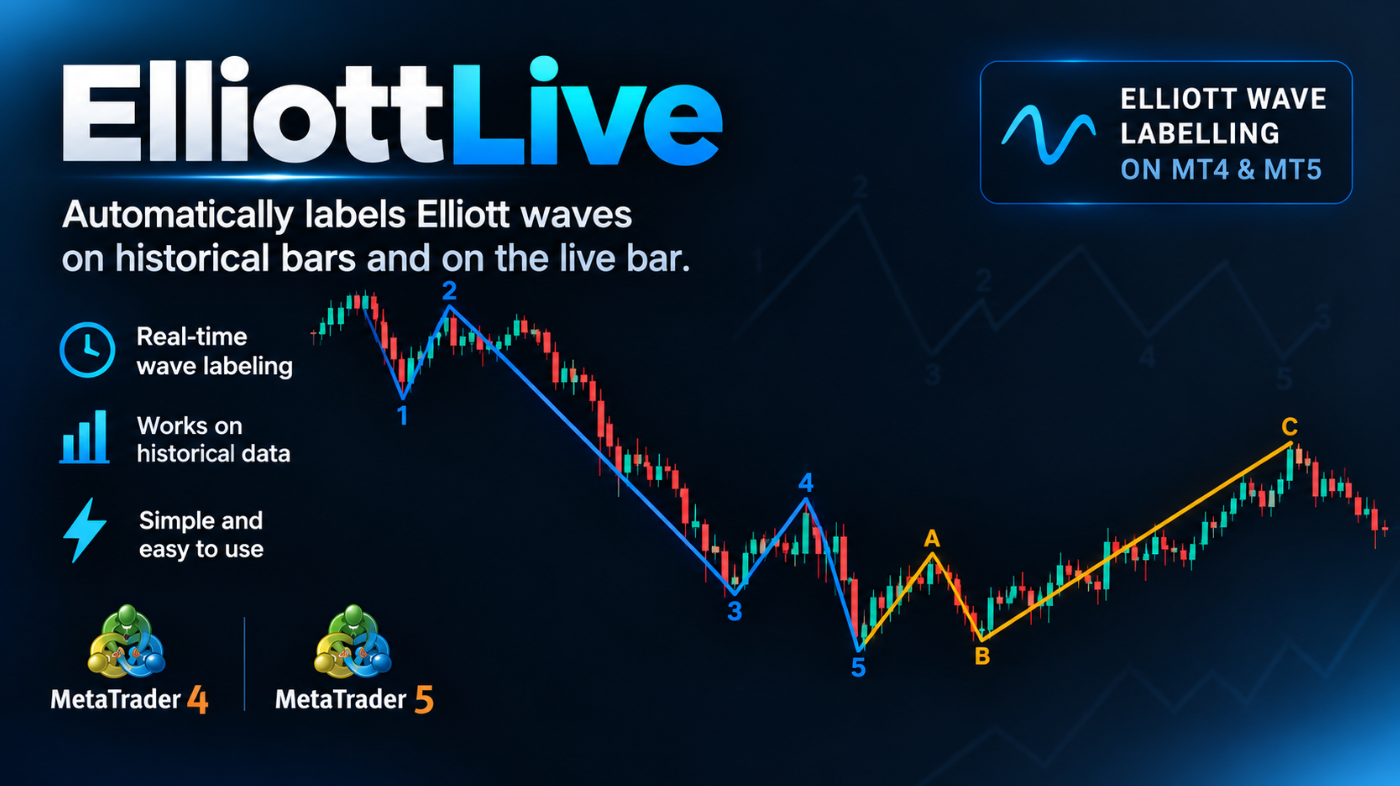
Elliott Live is a MetaTrader 5 indicator that automatically labels Elliott waves on historical bars and on the live bar. Completed waves are drawn with solid lines; the wave that is still forming is drawn dotted with a question mark (for example, "3?"), together with Fibonacci targets and an invalidation level. MT5-version: https://www.mql5.com/en/market/product/200604 How it works The indicator first builds swings (ZigZag). A reversal is registered when price pulls back from an extreme by
Elliott Live is a MetaTrader 5 indicator that automatically labels Elliott waves on historical bars and on the live bar. Completed waves are drawn with solid lines; the wave that is still forming is drawn dotted with a question mark (for example, "3?"), together with Fibonacci targets and an invalidation level. MT4-version: https://www.mql5.com/en/market/product/200613 How it works The indicator first builds swings (ZigZag). A reversal is registered when price pulls back from an extreme by