Young Ho Seo / Profile
- Information
|
12+ years
experience
|
62
products
|
1213
demo versions
|
|
4
jobs
|
0
signals
|
0
subscribers
|
Harmonic Pattern Indicator - Repainting + Japanese Candlestick Pattern Scanner + Automatic Channel + Many more
https://www.mql5.com/en/market/product/4488
https://www.mql5.com/en/market/product/4475
https://algotrading-investment.com/portfolio-item/harmonic-pattern-plus/
Non Repainting and Non Lagging Harmonic Pattern Indicator – Customizable Harmonic + Japanese Candlestic Pattern Scanner + Advanced Channel + Many more
https://www.mql5.com/en/market/product/41993
https://www.mql5.com/en/market/product/41992
https://algotrading-investment.com/portfolio-item/profitable-pattern-scanner/
Supply Demand Indicator – Multiple Timeframe Scanning Added + Non Repainting + Professional Indicator
https://www.mql5.com/en/market/product/40076
https://www.mql5.com/en/market/product/40075
https://algotrading-investment.com/portfolio-item/ace-supply-demand-zone/
Momentum Indicator – Path to Volume Spread Analysis
https://www.mql5.com/en/market/product/30641
https://www.mql5.com/en/market/product/30621
https://algotrading-investment.com/portfolio-item/excessive-momentum-indicator/
Elliott Wave Indicator for the Power User
https://www.mql5.com/en/market/product/16479
https://www.mql5.com/en/market/product/16472
https://algotrading-investment.com/portfolio-item/elliott-wave-trend/
Forex Prediction - Turn Support and Resistance to the Advanced Strategy
https://www.mql5.com/en/market/product/49170
https://www.mql5.com/en/market/product/49169
https://algotrading-investment.com/portfolio-item/fractal-pattern-scanner/
MetaTrader 4 and MetaTrader 5 Product Page: https://www.mql5.com/en/users/financeengineer/seller#products
Free Forex Prediction with Fibonacci Analysis: https://algotrading-investment.com/2020/10/23/forex-prediction-with-fibonacci-analysis/
Free Harmonic Pattern Signal: https://algotrading-investment.com/2020/12/17/harmonic-pattern-signal-for-forex-market/
============================================================================================================================
Here are the trading education books. We recommend reading these books if you are a trader or investor in Forex and Stock market. In the list below, we put the easy to read book on top. Try to read the easy to read book first and try to read the harder book later to improve your trading and investment.
First Link = amazon.com, Second Link = Google Play Books, Third Link = algotrading-investment.com, Fourth Link = Google Books
Technical Analysis in Forex and Stock Market (Supply Demand Analysis and Support Resistance)
https://www.amazon.com/dp/B09L55ZK4Z
https://play.google.com/store/books/details?id=pHlMEAAAQBAJ
https://algotrading-investment.com/portfolio-item/technical-analysis-in-forex-and-stock-market/
https://books.google.co.kr/books/about?id=pHlMEAAAQBAJ
Science Of Support, Resistance, Fibonacci Analysis, Harmonic Pattern, Elliott Wave and X3 Chart Pattern (In Forex and Stock Market Trading)
https://www.amazon.com/dp/B0993WZGZD
https://play.google.com/store/books/details?id=MME3EAAAQBAJ
https://algotrading-investment.com/portfolio-item/science-of-support-resistance-fibonacci-analysis-harmonic-pattern/
https://books.google.co.kr/books/about?id=MME3EAAAQBAJ
Profitable Chart Patterns in Forex and Stock Market (Fibonacci Analysis, Harmonic Pattern, Elliott Wave, and X3 Chart Pattern)
https://www.amazon.com/dp/B0B2KZH87K
https://play.google.com/store/books/details?id=7KrQDwAAQBAJ
https://algotrading-investment.com/portfolio-item/profitable-chart-patterns-in-forex-and-stock-market/
https://books.google.com/books/about?id=7KrQDwAAQBAJ
Guide to Precision Harmonic Pattern Trading (Mastering Turning Point Strategy for Financial Trading)
https://www.amazon.com/dp/B01MRI5LY6
https://play.google.com/store/books/details?id=8SbMDwAAQBAJ
http://algotrading-investment.com/portfolio-item/guide-precision-harmonic-pattern-trading/
https://books.google.com/books/about?id=8SbMDwAAQBAJ
Scientific Guide to Price Action and Pattern Trading (Wisdom of Trend, Cycle, and Fractal Wave)
https://www.amazon.com/dp/B073T3ZMBR
https://play.google.com/store/books/details?id=5prUDwAAQBAJ
https://algotrading-investment.com/portfolio-item/scientific-guide-to-price-action-and-pattern-trading/
https://books.google.com/books/about?id=5prUDwAAQBAJ
Predicting Forex and Stock Market with Fractal Pattern: Science of Price and Time
https://www.amazon.com/dp/B086YKM8BW
https://play.google.com/store/books/details?id=VJjiDwAAQBAJ
https://algotrading-investment.com/portfolio-item/predicting-forex-and-stock-market-with-fractal-pattern/
https://books.google.com/books/about?id=VJjiDwAAQBAJ
Trading Education Book 1 in Korean (Apple, Google Play Book, Google Book, Scribd, Kobo)
https://books.apple.com/us/book/id1565534211
https://play.google.com/store/books/details?id=HTgqEAAAQBAJ
https://books.google.co.kr/books/about?id=HTgqEAAAQBAJ
https://www.scribd.com/book/505583892
https://www.kobo.com/ww/en/ebook/8J-Eg58EDzKwlpUmADdp2g
Trading Education Book 2 in Korean (Apple, Google Play Book, Google Book, Scribd, Kobo)
https://books.apple.com/us/book/id1597112108
https://play.google.com/store/books/details?id=shRQEAAAQBAJ
https://books.google.co.kr/books/about?id=shRQEAAAQBAJ
https://www.scribd.com/book/542068528
https://www.kobo.com/ww/en/ebook/X8SmJdYCtDasOfQ1LQpCtg
Markets can be stressful sometimes. If then, take a break and escape into a good story. 📖
When the charts get crazy, give your mind a break.
Discover free web novels you can read anytime, anywhere—at no cost.
👉 Search for: jikji.me
www.jikji.me
About Young Ho Seo
Young Ho Seo is an Engineer, Financial Trader, and Quantitative Developer, working on Trading Science and Investment Engineering since 2011. He is the creator of many technical indicators, price patterns and trading strategies used in the financial market. He is also teaching the trading practice on how to use the Supply Demand Analysis, Support, Resistance, Trend line, Fibonacci Analysis, Harmonic Pattern, Elliott Wave Theory, Chart Patterns, and Probability for Forex and Stock Market. His works include developing scientific trading principle and mathematical algorithm in the work of Benjamin Graham, Everette S. Gardner, Benoit Mandelbrot, Ralph Nelson Elliott, Harold M. Gartley, Richard Shabacker, William Delbert Gann, Richard Wyckoff and Richard Dennis. You can find his dedicated works on www.algotrading-investment.com . His life mission is to connect financial traders and scientific community for better understanding of this world and crowd behaviour in the financial market. He wrote many books and articles, which are helpful for understanding the technology and application behind technical analysis, statistics, time series forecasting, fractal science, econometrics, and artificial intelligence in the financial market.
If you are interested in our software and training, just visit our main website: www.algotrading-investment.com
https://www.mql5.com/en/market/product/4488
https://www.mql5.com/en/market/product/4475
https://algotrading-investment.com/portfolio-item/harmonic-pattern-plus/
Non Repainting and Non Lagging Harmonic Pattern Indicator – Customizable Harmonic + Japanese Candlestic Pattern Scanner + Advanced Channel + Many more
https://www.mql5.com/en/market/product/41993
https://www.mql5.com/en/market/product/41992
https://algotrading-investment.com/portfolio-item/profitable-pattern-scanner/
Supply Demand Indicator – Multiple Timeframe Scanning Added + Non Repainting + Professional Indicator
https://www.mql5.com/en/market/product/40076
https://www.mql5.com/en/market/product/40075
https://algotrading-investment.com/portfolio-item/ace-supply-demand-zone/
Momentum Indicator – Path to Volume Spread Analysis
https://www.mql5.com/en/market/product/30641
https://www.mql5.com/en/market/product/30621
https://algotrading-investment.com/portfolio-item/excessive-momentum-indicator/
Elliott Wave Indicator for the Power User
https://www.mql5.com/en/market/product/16479
https://www.mql5.com/en/market/product/16472
https://algotrading-investment.com/portfolio-item/elliott-wave-trend/
Forex Prediction - Turn Support and Resistance to the Advanced Strategy
https://www.mql5.com/en/market/product/49170
https://www.mql5.com/en/market/product/49169
https://algotrading-investment.com/portfolio-item/fractal-pattern-scanner/
MetaTrader 4 and MetaTrader 5 Product Page: https://www.mql5.com/en/users/financeengineer/seller#products
Free Forex Prediction with Fibonacci Analysis: https://algotrading-investment.com/2020/10/23/forex-prediction-with-fibonacci-analysis/
Free Harmonic Pattern Signal: https://algotrading-investment.com/2020/12/17/harmonic-pattern-signal-for-forex-market/
============================================================================================================================
Here are the trading education books. We recommend reading these books if you are a trader or investor in Forex and Stock market. In the list below, we put the easy to read book on top. Try to read the easy to read book first and try to read the harder book later to improve your trading and investment.
First Link = amazon.com, Second Link = Google Play Books, Third Link = algotrading-investment.com, Fourth Link = Google Books
Technical Analysis in Forex and Stock Market (Supply Demand Analysis and Support Resistance)
https://www.amazon.com/dp/B09L55ZK4Z
https://play.google.com/store/books/details?id=pHlMEAAAQBAJ
https://algotrading-investment.com/portfolio-item/technical-analysis-in-forex-and-stock-market/
https://books.google.co.kr/books/about?id=pHlMEAAAQBAJ
Science Of Support, Resistance, Fibonacci Analysis, Harmonic Pattern, Elliott Wave and X3 Chart Pattern (In Forex and Stock Market Trading)
https://www.amazon.com/dp/B0993WZGZD
https://play.google.com/store/books/details?id=MME3EAAAQBAJ
https://algotrading-investment.com/portfolio-item/science-of-support-resistance-fibonacci-analysis-harmonic-pattern/
https://books.google.co.kr/books/about?id=MME3EAAAQBAJ
Profitable Chart Patterns in Forex and Stock Market (Fibonacci Analysis, Harmonic Pattern, Elliott Wave, and X3 Chart Pattern)
https://www.amazon.com/dp/B0B2KZH87K
https://play.google.com/store/books/details?id=7KrQDwAAQBAJ
https://algotrading-investment.com/portfolio-item/profitable-chart-patterns-in-forex-and-stock-market/
https://books.google.com/books/about?id=7KrQDwAAQBAJ
Guide to Precision Harmonic Pattern Trading (Mastering Turning Point Strategy for Financial Trading)
https://www.amazon.com/dp/B01MRI5LY6
https://play.google.com/store/books/details?id=8SbMDwAAQBAJ
http://algotrading-investment.com/portfolio-item/guide-precision-harmonic-pattern-trading/
https://books.google.com/books/about?id=8SbMDwAAQBAJ
Scientific Guide to Price Action and Pattern Trading (Wisdom of Trend, Cycle, and Fractal Wave)
https://www.amazon.com/dp/B073T3ZMBR
https://play.google.com/store/books/details?id=5prUDwAAQBAJ
https://algotrading-investment.com/portfolio-item/scientific-guide-to-price-action-and-pattern-trading/
https://books.google.com/books/about?id=5prUDwAAQBAJ
Predicting Forex and Stock Market with Fractal Pattern: Science of Price and Time
https://www.amazon.com/dp/B086YKM8BW
https://play.google.com/store/books/details?id=VJjiDwAAQBAJ
https://algotrading-investment.com/portfolio-item/predicting-forex-and-stock-market-with-fractal-pattern/
https://books.google.com/books/about?id=VJjiDwAAQBAJ
Trading Education Book 1 in Korean (Apple, Google Play Book, Google Book, Scribd, Kobo)
https://books.apple.com/us/book/id1565534211
https://play.google.com/store/books/details?id=HTgqEAAAQBAJ
https://books.google.co.kr/books/about?id=HTgqEAAAQBAJ
https://www.scribd.com/book/505583892
https://www.kobo.com/ww/en/ebook/8J-Eg58EDzKwlpUmADdp2g
Trading Education Book 2 in Korean (Apple, Google Play Book, Google Book, Scribd, Kobo)
https://books.apple.com/us/book/id1597112108
https://play.google.com/store/books/details?id=shRQEAAAQBAJ
https://books.google.co.kr/books/about?id=shRQEAAAQBAJ
https://www.scribd.com/book/542068528
https://www.kobo.com/ww/en/ebook/X8SmJdYCtDasOfQ1LQpCtg
Markets can be stressful sometimes. If then, take a break and escape into a good story. 📖
When the charts get crazy, give your mind a break.
Discover free web novels you can read anytime, anywhere—at no cost.
👉 Search for: jikji.me
www.jikji.me
About Young Ho Seo
Young Ho Seo is an Engineer, Financial Trader, and Quantitative Developer, working on Trading Science and Investment Engineering since 2011. He is the creator of many technical indicators, price patterns and trading strategies used in the financial market. He is also teaching the trading practice on how to use the Supply Demand Analysis, Support, Resistance, Trend line, Fibonacci Analysis, Harmonic Pattern, Elliott Wave Theory, Chart Patterns, and Probability for Forex and Stock Market. His works include developing scientific trading principle and mathematical algorithm in the work of Benjamin Graham, Everette S. Gardner, Benoit Mandelbrot, Ralph Nelson Elliott, Harold M. Gartley, Richard Shabacker, William Delbert Gann, Richard Wyckoff and Richard Dennis. You can find his dedicated works on www.algotrading-investment.com . His life mission is to connect financial traders and scientific community for better understanding of this world and crowd behaviour in the financial market. He wrote many books and articles, which are helpful for understanding the technology and application behind technical analysis, statistics, time series forecasting, fractal science, econometrics, and artificial intelligence in the financial market.
If you are interested in our software and training, just visit our main website: www.algotrading-investment.com

Young Ho Seo
Rolling Ball Effect and Harmonic Pattern Trading
We use turning point strategy because of their high reward/risk ratio. Higher rewards/risk ratio means relatively lower winning rate comparing to other lower rewards/risk trading setup. As an extreme example, in scalping, you can achieve over 90% of winning rate if you have the target profit of 1 pip against 20 or 30 pips risk. However, it does not mean that scalping is better technique than other strategies. With scalping, you have to increase frequency of trading to achieve the same profit level as other techniques do. In addition, few losing trades will risk your account quickly. In harmonic pattern trading, higher rewards/risk ratio will reduce your winning rate dramatically. It is hard to say exact winning rate. Roughly, your chance to be successful is somewhere between 10% and 60%. Of course, it can be higher depending on your discipline and rewards/risk ratio. When we trade with turning points, we can be wrong many times. However, few winning trades will offset your loss and will offer you profits. Several losing trades will never impose a lot of pressure on your account when you are taking reasonable risk for each trade. Turning point strategy has nice operating characteristics for trader. Unlimited profit range is the key merit on why the turning point strategy is loved by many traders (Figure 11-1). In addition, the required frequency of trading is much less than other trading strategy. This sort of strategy will fit to the life style of many of us. Having said that, many traders do not understand the skills and discipline required for turning point strategy. In essence, the key to apply successful turning point strategy is reducing number of losing trades.
Figure 11-1: Profit range of turning point strategy compared to others.
To reduce number of losing trades and to increase your winning rate, you must understand the rolling ball effect. What is rolling ball effect? To explain the rolling ball effect in harmonic pattern context, let us start with some example of bullish harmonic patterns. We will be using bullish trading example thoroughly in this chapter. For selling case, please turn the logic explained here the other way around.
Figure 11-2: Schematic diagram of rolling ball on the slope.
Most of time the bullish turning point will come after heavy selling period. In the case of global turning point, it would come after intensive selling (Figure 11-3). In the case of continuation and local turning point, the turning point will come after some selling (Figure 11-4). When we look back this in chart, it seems everything is ok. However, if we are standing at the time before the turning point happens, this is not fun to be honest. Especially we have just sent some large buying orders when all bearish investors think this might be suiciding. Even in this fearful moment, we still do this because we know that there are people waiting to enter buy when price is sufficiently discounted. However, this is only half of our equation.
To win, you have to understand the other half of equation. The other half of equation is that it is not easy to stop the rolling ball on the slope as shown in Figure 11-2. Even the rolling ball reaches end of the slope, we cannot expect the rolling ball to be stopped right at the end because the rolling ball has the built up momentum in the rolling direction. Instead, it usually takes several hard attempts to stop them or they will role until they lose all the momentum by the friction of surface and air and other obstacles on its way. This rolling ball effect is the typical cause behind the failed harmonic patterns. Less sophisticated trader does not see this rolling ball effect. They are almost careless about the built-up momentum of the selling market. If you miss this point, you will be joining the 90/90/90 club, 90% of the traders losing 90% of their money within 90 days.
Figure 11-3: Global turning point example after heavy selling pressure.
Figure 11-4: Local turning point example.
To deal with this rolling ball effect, sometimes, you can employ the multiple entry technique for harmonic pattern trading. In multiple entry technique, you will split your order into two or three smaller. At first, you will open first entry with the order size of half or one third of one full order. Then you will monitor how the market is responding. If market is going down further, this means that the rolling ball effect is still not cleared yet. As price is going down further, the harmonic pattern can fail. During this process, this might be losing trade or this might be breakeven if you are skilled. At the same time, you have to check if the market is showing some intent to become bullish or not for your future second entry. If the market showed some intent to become bullish, then you can wait for the second opportunity. It is important to have sufficient price distance between your first and second entry though. Second entry must be well below outside the Pattern Completion Interval of the first entry to account for the rolling ball effect. If we meet the turning point in our first entry, it is the best scenario. In such scenario, make sure that you are using maximum profit range to account for the reduced position size. Even if our first entry did not go well, we still have the second chance. Now, you might be wondering how many entries are recommended in multiple entry. Typically, two is recommended and three is the maximum I can suggest. If you split your order into too many pieces, then you profit size is getting smaller too. I do not recommend going over more than three typically. Two is good choice and three is the maximum.
Figure 11-5: Multiple entry demonstration with AB=CD pattern.
Sometimes, there are people doing exactly opposite to multiple entries recommended here. That is they are taking multiple exits. For your information, multiple exit technique can not deal with the rolling ball effect if the entry of two orders are identical. Multiple exits with same entry isn’t efficient technique because the end result is more or less the same with single entry with the averaged take profit between two take profits. For example, some trader sets two take profits at 0.381 and 0.618 Fibonacci projected level from D point. The results of this will become close or identical to one take profit at 0.500 Fibonacci projected level in long run. I do not recommend this sort of multiple exit setup. However, if you must do this sort of multiple exit setup, then I recommend using Potential Continuation Zone, instead of simple Fibonacci projection. Potential Continuation Zone, introduced in this book, is much better predictor of turning point after the D point is confirmed. Hence, you can use two Potential Continuation Zone sensibly to place your two take profit targets. In addition, if you are going to employ two orders, try to differ the entries to account for the rolling ball effect. If you are differing the entries of the two orders, then it will become the multiple entry technique we have been explaining here.
Figure 11-6: Multiple exit demonstration with AB=CD pattern.
Figure 11-7: Single exit setup equivalent to multiple exit setup in Figure 11-4.
About this Article
This article is the part taken from the draft version of the Book: Guide to Precision Harmonic Pattern Trading (Mastering Turning Point Strategy for Financial Trading). This article is only draft and it will be not updated to the completed version on the release of the book. However, this article will serve you to gather the important knowledge in financial trading. This article is also recommended to read before using Harmonic Pattern Plus, Harmonic Pattern Scenario Planner and X3 Chart Pattern Scanner, which is available for MetaTrader or Optimum Chart.
Below is the landing page for Harmonic Pattern Plus, Harmonic Pattern Scenario Planner and X3 Chart Pattern Scanner in MetaTrader. All these products are also available from www.mql5.com too.
https://algotrading-investment.com/portfolio-item/harmonic-pattern-plus/
https://algotrading-investment.com/portfolio-item/harmonic-pattern-scenario-planner/
https://algotrading-investment.com/portfolio-item/profitable-pattern-scanner/
Below is the landing page for Optimum Chart (Standalone Charting and Analytical Platform).
https://algotrading-investment.com/2019/07/23/optimum-chart/
We use turning point strategy because of their high reward/risk ratio. Higher rewards/risk ratio means relatively lower winning rate comparing to other lower rewards/risk trading setup. As an extreme example, in scalping, you can achieve over 90% of winning rate if you have the target profit of 1 pip against 20 or 30 pips risk. However, it does not mean that scalping is better technique than other strategies. With scalping, you have to increase frequency of trading to achieve the same profit level as other techniques do. In addition, few losing trades will risk your account quickly. In harmonic pattern trading, higher rewards/risk ratio will reduce your winning rate dramatically. It is hard to say exact winning rate. Roughly, your chance to be successful is somewhere between 10% and 60%. Of course, it can be higher depending on your discipline and rewards/risk ratio. When we trade with turning points, we can be wrong many times. However, few winning trades will offset your loss and will offer you profits. Several losing trades will never impose a lot of pressure on your account when you are taking reasonable risk for each trade. Turning point strategy has nice operating characteristics for trader. Unlimited profit range is the key merit on why the turning point strategy is loved by many traders (Figure 11-1). In addition, the required frequency of trading is much less than other trading strategy. This sort of strategy will fit to the life style of many of us. Having said that, many traders do not understand the skills and discipline required for turning point strategy. In essence, the key to apply successful turning point strategy is reducing number of losing trades.
Figure 11-1: Profit range of turning point strategy compared to others.
To reduce number of losing trades and to increase your winning rate, you must understand the rolling ball effect. What is rolling ball effect? To explain the rolling ball effect in harmonic pattern context, let us start with some example of bullish harmonic patterns. We will be using bullish trading example thoroughly in this chapter. For selling case, please turn the logic explained here the other way around.
Figure 11-2: Schematic diagram of rolling ball on the slope.
Most of time the bullish turning point will come after heavy selling period. In the case of global turning point, it would come after intensive selling (Figure 11-3). In the case of continuation and local turning point, the turning point will come after some selling (Figure 11-4). When we look back this in chart, it seems everything is ok. However, if we are standing at the time before the turning point happens, this is not fun to be honest. Especially we have just sent some large buying orders when all bearish investors think this might be suiciding. Even in this fearful moment, we still do this because we know that there are people waiting to enter buy when price is sufficiently discounted. However, this is only half of our equation.
To win, you have to understand the other half of equation. The other half of equation is that it is not easy to stop the rolling ball on the slope as shown in Figure 11-2. Even the rolling ball reaches end of the slope, we cannot expect the rolling ball to be stopped right at the end because the rolling ball has the built up momentum in the rolling direction. Instead, it usually takes several hard attempts to stop them or they will role until they lose all the momentum by the friction of surface and air and other obstacles on its way. This rolling ball effect is the typical cause behind the failed harmonic patterns. Less sophisticated trader does not see this rolling ball effect. They are almost careless about the built-up momentum of the selling market. If you miss this point, you will be joining the 90/90/90 club, 90% of the traders losing 90% of their money within 90 days.
Figure 11-3: Global turning point example after heavy selling pressure.
Figure 11-4: Local turning point example.
To deal with this rolling ball effect, sometimes, you can employ the multiple entry technique for harmonic pattern trading. In multiple entry technique, you will split your order into two or three smaller. At first, you will open first entry with the order size of half or one third of one full order. Then you will monitor how the market is responding. If market is going down further, this means that the rolling ball effect is still not cleared yet. As price is going down further, the harmonic pattern can fail. During this process, this might be losing trade or this might be breakeven if you are skilled. At the same time, you have to check if the market is showing some intent to become bullish or not for your future second entry. If the market showed some intent to become bullish, then you can wait for the second opportunity. It is important to have sufficient price distance between your first and second entry though. Second entry must be well below outside the Pattern Completion Interval of the first entry to account for the rolling ball effect. If we meet the turning point in our first entry, it is the best scenario. In such scenario, make sure that you are using maximum profit range to account for the reduced position size. Even if our first entry did not go well, we still have the second chance. Now, you might be wondering how many entries are recommended in multiple entry. Typically, two is recommended and three is the maximum I can suggest. If you split your order into too many pieces, then you profit size is getting smaller too. I do not recommend going over more than three typically. Two is good choice and three is the maximum.
Figure 11-5: Multiple entry demonstration with AB=CD pattern.
Sometimes, there are people doing exactly opposite to multiple entries recommended here. That is they are taking multiple exits. For your information, multiple exit technique can not deal with the rolling ball effect if the entry of two orders are identical. Multiple exits with same entry isn’t efficient technique because the end result is more or less the same with single entry with the averaged take profit between two take profits. For example, some trader sets two take profits at 0.381 and 0.618 Fibonacci projected level from D point. The results of this will become close or identical to one take profit at 0.500 Fibonacci projected level in long run. I do not recommend this sort of multiple exit setup. However, if you must do this sort of multiple exit setup, then I recommend using Potential Continuation Zone, instead of simple Fibonacci projection. Potential Continuation Zone, introduced in this book, is much better predictor of turning point after the D point is confirmed. Hence, you can use two Potential Continuation Zone sensibly to place your two take profit targets. In addition, if you are going to employ two orders, try to differ the entries to account for the rolling ball effect. If you are differing the entries of the two orders, then it will become the multiple entry technique we have been explaining here.
Figure 11-6: Multiple exit demonstration with AB=CD pattern.
Figure 11-7: Single exit setup equivalent to multiple exit setup in Figure 11-4.
About this Article
This article is the part taken from the draft version of the Book: Guide to Precision Harmonic Pattern Trading (Mastering Turning Point Strategy for Financial Trading). This article is only draft and it will be not updated to the completed version on the release of the book. However, this article will serve you to gather the important knowledge in financial trading. This article is also recommended to read before using Harmonic Pattern Plus, Harmonic Pattern Scenario Planner and X3 Chart Pattern Scanner, which is available for MetaTrader or Optimum Chart.
Below is the landing page for Harmonic Pattern Plus, Harmonic Pattern Scenario Planner and X3 Chart Pattern Scanner in MetaTrader. All these products are also available from www.mql5.com too.
https://algotrading-investment.com/portfolio-item/harmonic-pattern-plus/
https://algotrading-investment.com/portfolio-item/harmonic-pattern-scenario-planner/
https://algotrading-investment.com/portfolio-item/profitable-pattern-scanner/
Below is the landing page for Optimum Chart (Standalone Charting and Analytical Platform).
https://algotrading-investment.com/2019/07/23/optimum-chart/
Young Ho Seo
Automatic Resizing your Stop Loss and Take Profit Level with Harmonic Pattern Plus (Harmonic Pattern Scenario Planner)
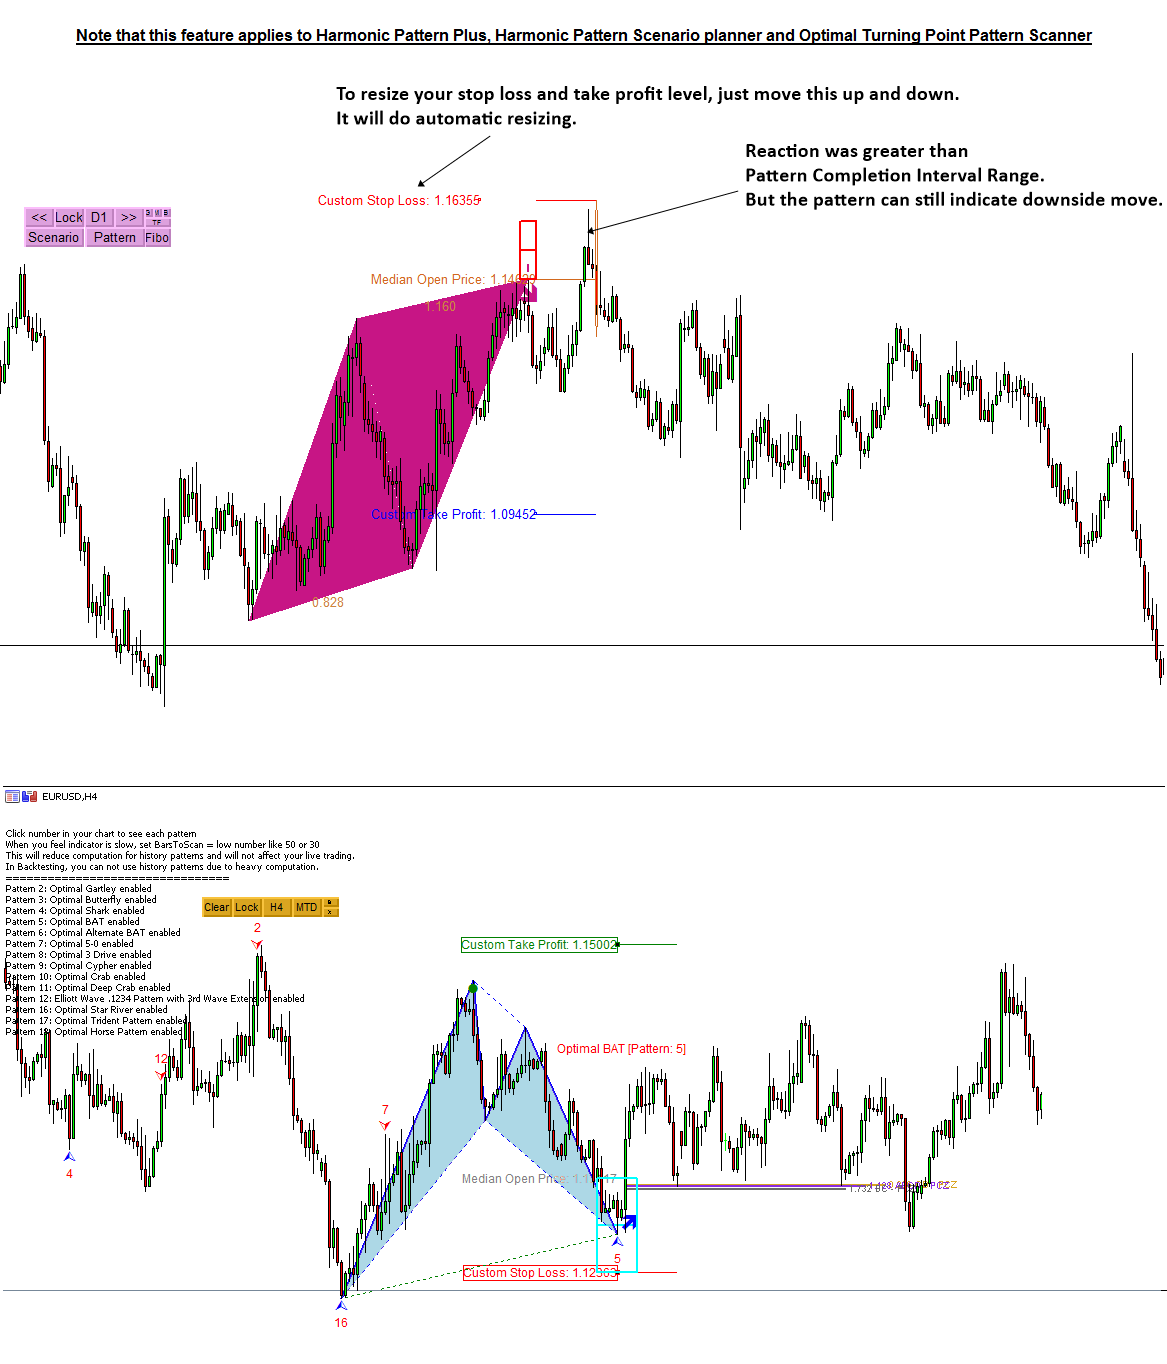
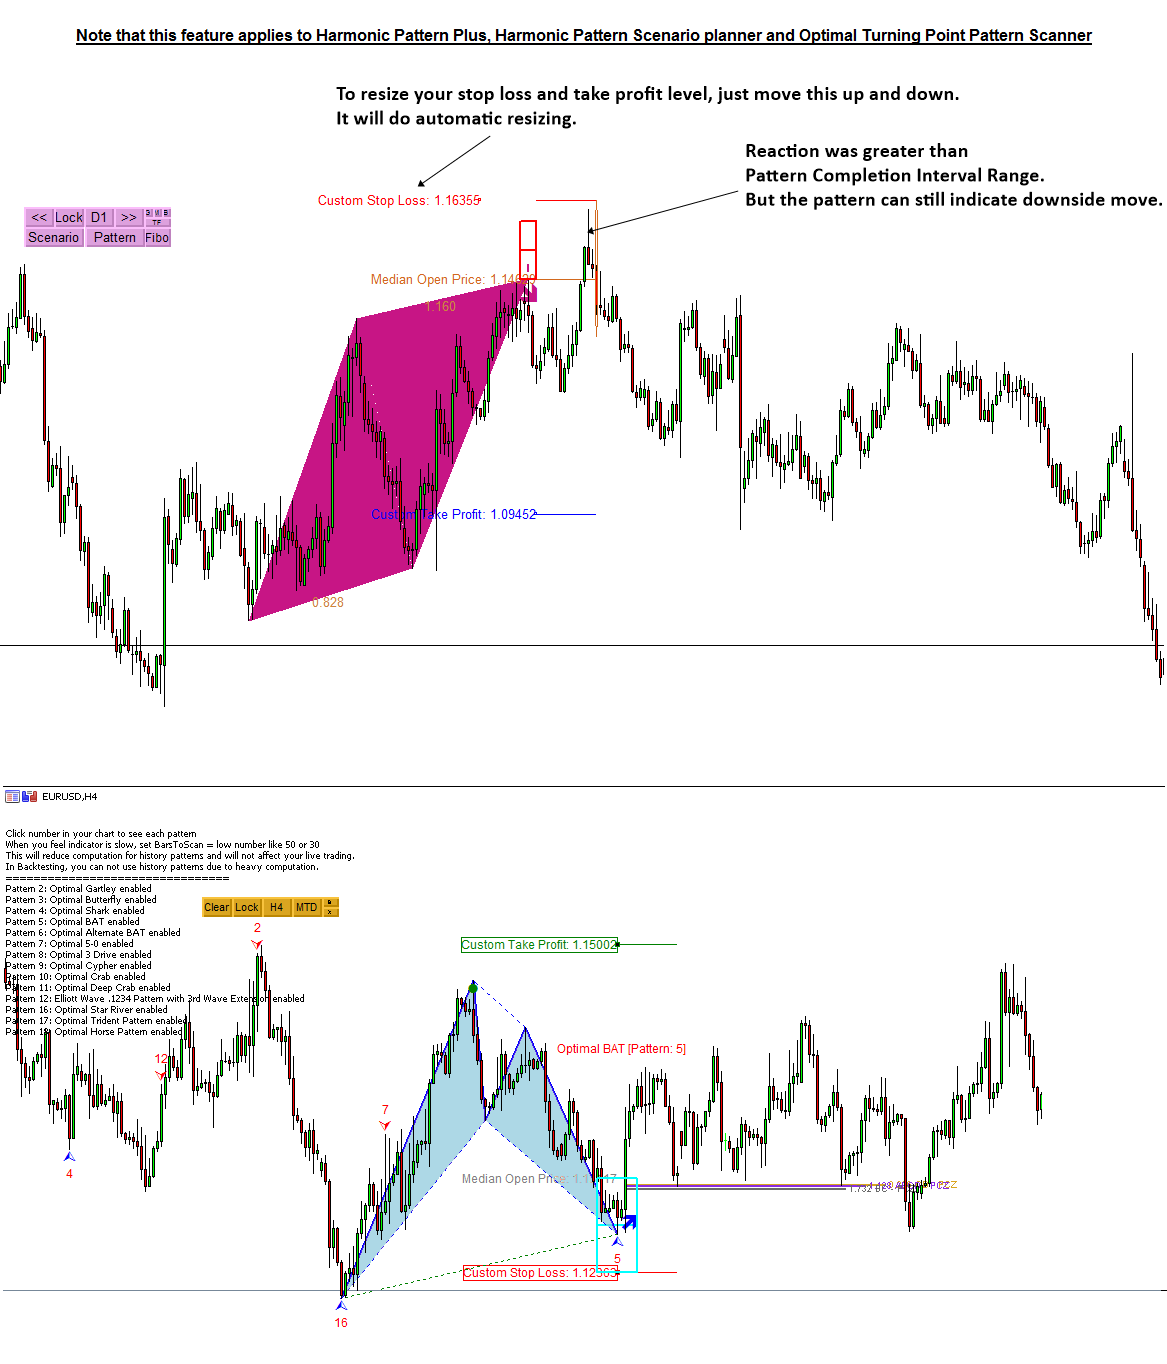
Having understood all the concept behind the Pattern Completion Interval, you might observe that sometime price can react outside the pattern completion interval. Sure, there is nothing perfect in the world. As long as you understand the pros and cons of using large stop loss size, it is still fine to control your own stop loss size.
However, we still prefer to express stop loss size in terms of pattern completion interval range for convenience. For example, if the original stop loss size was equal to 1 x pattern completion interval, you can certainly use 1.5 x pattern completion interval or 2 x pattern completion interval.
Another consideration before you are using pattern completion interval, if you can enter the market at the competitive price, then you can feel less guilty when you increase your stop loss size because you are still remaining good rewards/Risk ratio. On the other hands, if you have entered market at not so competitive price, then you might be cautious when you increase your stop loss size.
The same feature applies to X3 Chart Pattern Scanner (Non Repainting and Non Lagging Harmonic Pattern and Elliott Wave pattern scanner.)
In addition, you can watch the YouTube Video titled feel what is the automated harmonic pattern indicator like. For your information, we provides two YouTube videos with title and links below.
YouTube “Harmonic Pattern Indicator”: https://youtu.be/CzYUwk5qeCk
YouTube “Non Repainting Non Lagging Harmonic Pattern Indicator”: https://youtu.be/uMlmMquefGQ
Harmonic Pattern Plus
https://www.mql5.com/en/market/product/4488
https://www.mql5.com/en/market/product/4475
https://algotrading-investment.com/portfolio-item/harmonic-pattern-plus/
Harmonic Pattern Scenario Planner
https://www.mql5.com/en/market/product/6101
https://www.mql5.com/en/market/product/6240
https://algotrading-investment.com/portfolio-item/harmonic-pattern-scenario-planner/
X3 Chart Pattern Scanner
https://www.mql5.com/en/market/product/41993
https://www.mql5.com/en/market/product/41992
https://algotrading-investment.com/portfolio-item/profitable-pattern-scanner/
Having understood all the concept behind the Pattern Completion Interval, you might observe that sometime price can react outside the pattern completion interval. Sure, there is nothing perfect in the world. As long as you understand the pros and cons of using large stop loss size, it is still fine to control your own stop loss size.
However, we still prefer to express stop loss size in terms of pattern completion interval range for convenience. For example, if the original stop loss size was equal to 1 x pattern completion interval, you can certainly use 1.5 x pattern completion interval or 2 x pattern completion interval.
Another consideration before you are using pattern completion interval, if you can enter the market at the competitive price, then you can feel less guilty when you increase your stop loss size because you are still remaining good rewards/Risk ratio. On the other hands, if you have entered market at not so competitive price, then you might be cautious when you increase your stop loss size.
The same feature applies to X3 Chart Pattern Scanner (Non Repainting and Non Lagging Harmonic Pattern and Elliott Wave pattern scanner.)
In addition, you can watch the YouTube Video titled feel what is the automated harmonic pattern indicator like. For your information, we provides two YouTube videos with title and links below.
YouTube “Harmonic Pattern Indicator”: https://youtu.be/CzYUwk5qeCk
YouTube “Non Repainting Non Lagging Harmonic Pattern Indicator”: https://youtu.be/uMlmMquefGQ
Harmonic Pattern Plus
https://www.mql5.com/en/market/product/4488
https://www.mql5.com/en/market/product/4475
https://algotrading-investment.com/portfolio-item/harmonic-pattern-plus/
Harmonic Pattern Scenario Planner
https://www.mql5.com/en/market/product/6101
https://www.mql5.com/en/market/product/6240
https://algotrading-investment.com/portfolio-item/harmonic-pattern-scenario-planner/
X3 Chart Pattern Scanner
https://www.mql5.com/en/market/product/41993
https://www.mql5.com/en/market/product/41992
https://algotrading-investment.com/portfolio-item/profitable-pattern-scanner/
Young Ho Seo
Using Spread Chart from the Pairs Trading Station in MetaTrader
From Pairs Trading Station in MetaTrader version, you can access the Spread Chart, which is mathematically processed to show the distance between two financial instruments (or between two assets).
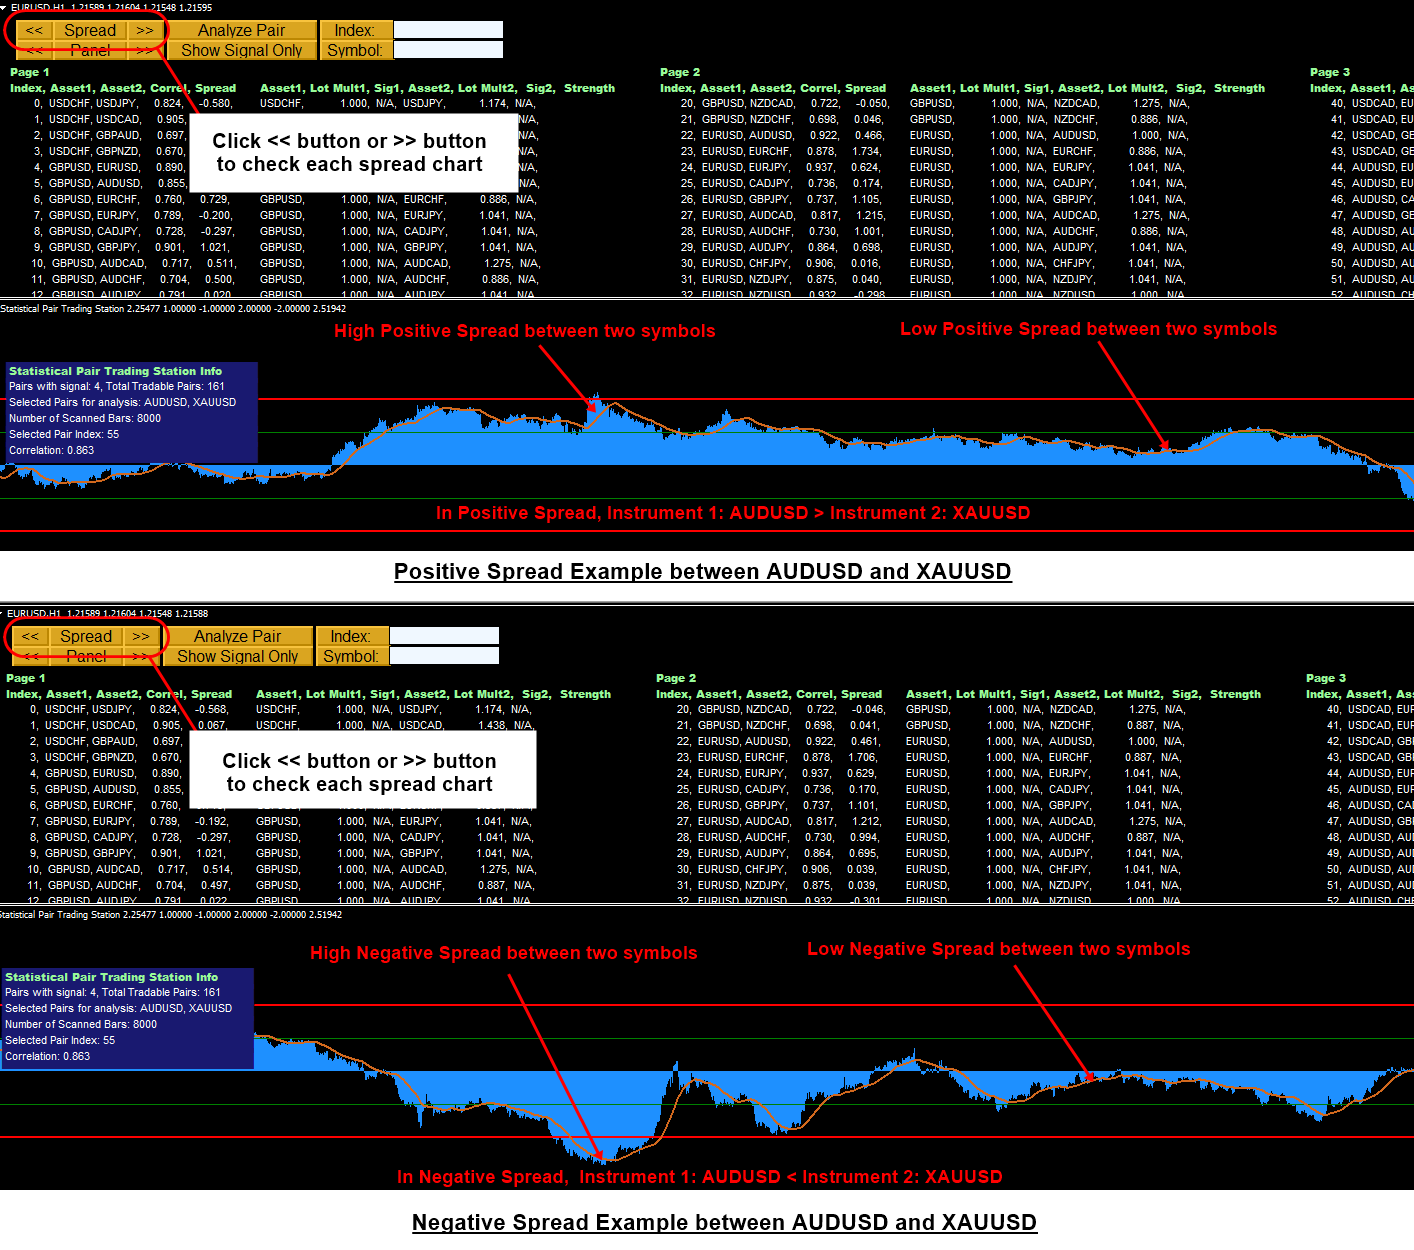
You can access the Spread Chart by clicking << button or >> button near the Spread button.
Here is the brief guide on how to interpret the Spread Chart. In this example, we use AUDUSD and XAUUSD as asset 1 and asset 2. The absolute magnitude of these two assets are compared in the normalized sense to compare apple to apple and pear to pear. Two cases exist including the positive spread and negative spread.
In positive spread, AUDUSD (i.e. asset 1) is greater than XAUUSD (i.e. asset 2). Higher the positive spread means that AUDUSD is much greater than XAUUSD in the normalized sense. If the positive spread is small, then the difference between AUDUSD and XAUUSD is also small.
In negative spread, AUDUSD (i.e. asset 2) is smaller than XAUUSD (i.e. asset 2). Higher the negative spread means that AUDUSD is much smaller than XAUUSD in the normalized sense. If the negative spread is small, then the difference between AUDUSD and XAUUSD is also small.
Further you can access more detailed trading operation with below Pairs Trading Manual.
https://algotrading-investment.com/2015/11/14/introduction-to-pair-trading-station_ati/
In addition, you can watch this YouTube Video titled as How to use Pairs Trading Station
https://youtu.be/fAE9pByxZDA
To help you understand the spread chart, we also attach the screenshot.
Pair Trading Station is very unique trading system based on Statistical Arbritage trading principle. Below is the direct link to Pair Trading Station for MetaTrader 4 and MetaTrader 5 platform:
https://algotrading-investment.com/portfolio-item/pair-trading-station/
https://www.mql5.com/en/market/product/3303
https://www.mql5.com/en/market/product/3304
So far, we have explained the functionality of Pairs Trading Station in MetaTrader version, covering both MetaTrader 4 and MetaTrader 5. In addition, we also provide the Pairs Trading Station in Optimum Chart too with more advanced features.
https://algotrading-investment.com/2019/07/23/optimum-chart/
From Pairs Trading Station in MetaTrader version, you can access the Spread Chart, which is mathematically processed to show the distance between two financial instruments (or between two assets).
You can access the Spread Chart by clicking << button or >> button near the Spread button.
Here is the brief guide on how to interpret the Spread Chart. In this example, we use AUDUSD and XAUUSD as asset 1 and asset 2. The absolute magnitude of these two assets are compared in the normalized sense to compare apple to apple and pear to pear. Two cases exist including the positive spread and negative spread.
In positive spread, AUDUSD (i.e. asset 1) is greater than XAUUSD (i.e. asset 2). Higher the positive spread means that AUDUSD is much greater than XAUUSD in the normalized sense. If the positive spread is small, then the difference between AUDUSD and XAUUSD is also small.
In negative spread, AUDUSD (i.e. asset 2) is smaller than XAUUSD (i.e. asset 2). Higher the negative spread means that AUDUSD is much smaller than XAUUSD in the normalized sense. If the negative spread is small, then the difference between AUDUSD and XAUUSD is also small.
Further you can access more detailed trading operation with below Pairs Trading Manual.
https://algotrading-investment.com/2015/11/14/introduction-to-pair-trading-station_ati/
In addition, you can watch this YouTube Video titled as How to use Pairs Trading Station
https://youtu.be/fAE9pByxZDA
To help you understand the spread chart, we also attach the screenshot.
Pair Trading Station is very unique trading system based on Statistical Arbritage trading principle. Below is the direct link to Pair Trading Station for MetaTrader 4 and MetaTrader 5 platform:
https://algotrading-investment.com/portfolio-item/pair-trading-station/
https://www.mql5.com/en/market/product/3303
https://www.mql5.com/en/market/product/3304
So far, we have explained the functionality of Pairs Trading Station in MetaTrader version, covering both MetaTrader 4 and MetaTrader 5. In addition, we also provide the Pairs Trading Station in Optimum Chart too with more advanced features.
https://algotrading-investment.com/2019/07/23/optimum-chart/
Young Ho Seo
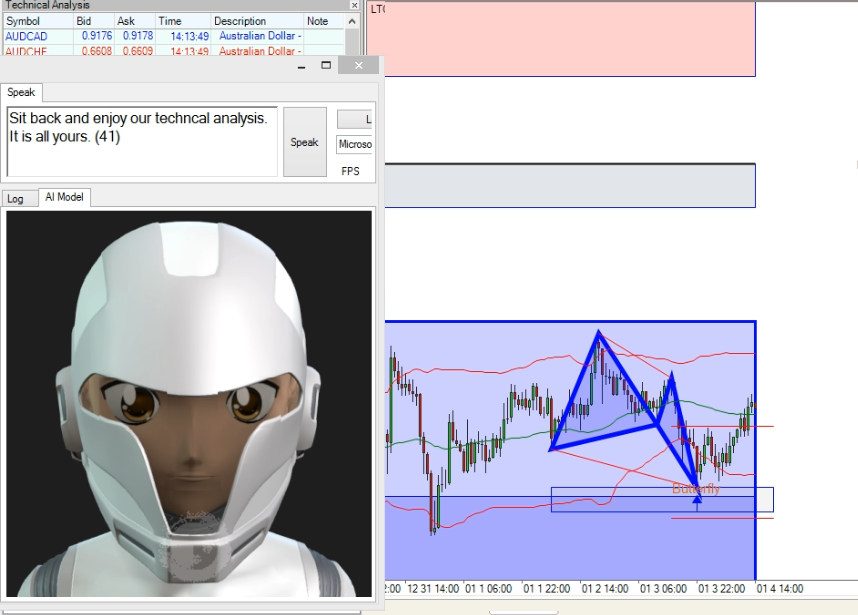
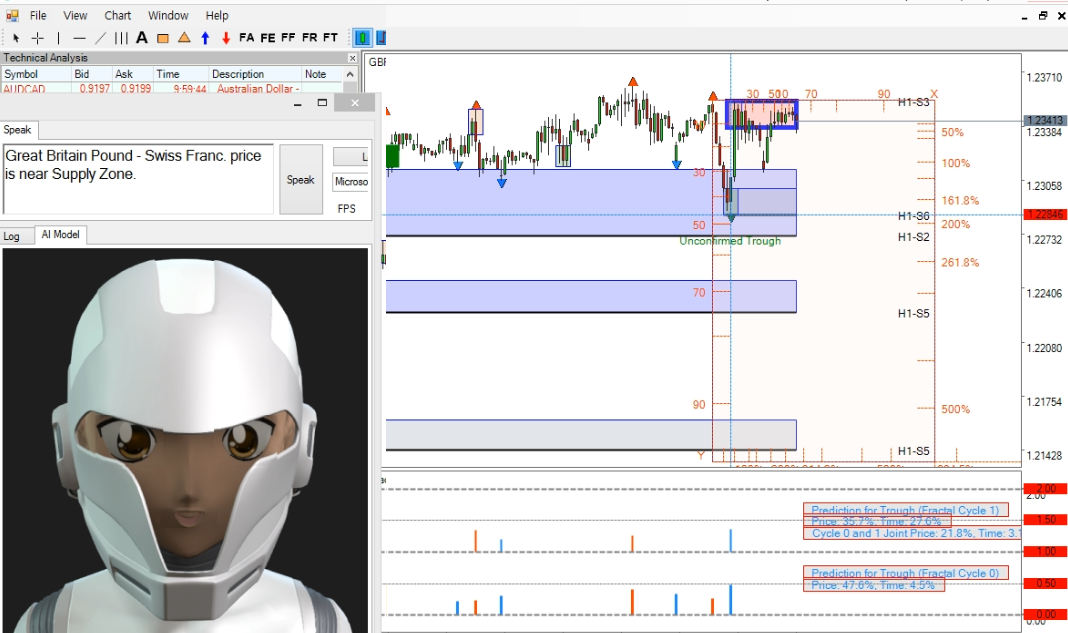
Artificial Intelligence Does Technical Analysis for You. You can just seat back and enjoy the technical analysis presented by the robot. This video provides the forex analysis you can use for your day trading with forex market. Make sure to subscribe to our YouTube Channel so you can receive immediate alert for new Forex Prediction upload.
YouTube: https://youtu.be/F1yF0v0R6dU
Young Ho Seo
Scan Supply Demand Zone Across All Timeframe
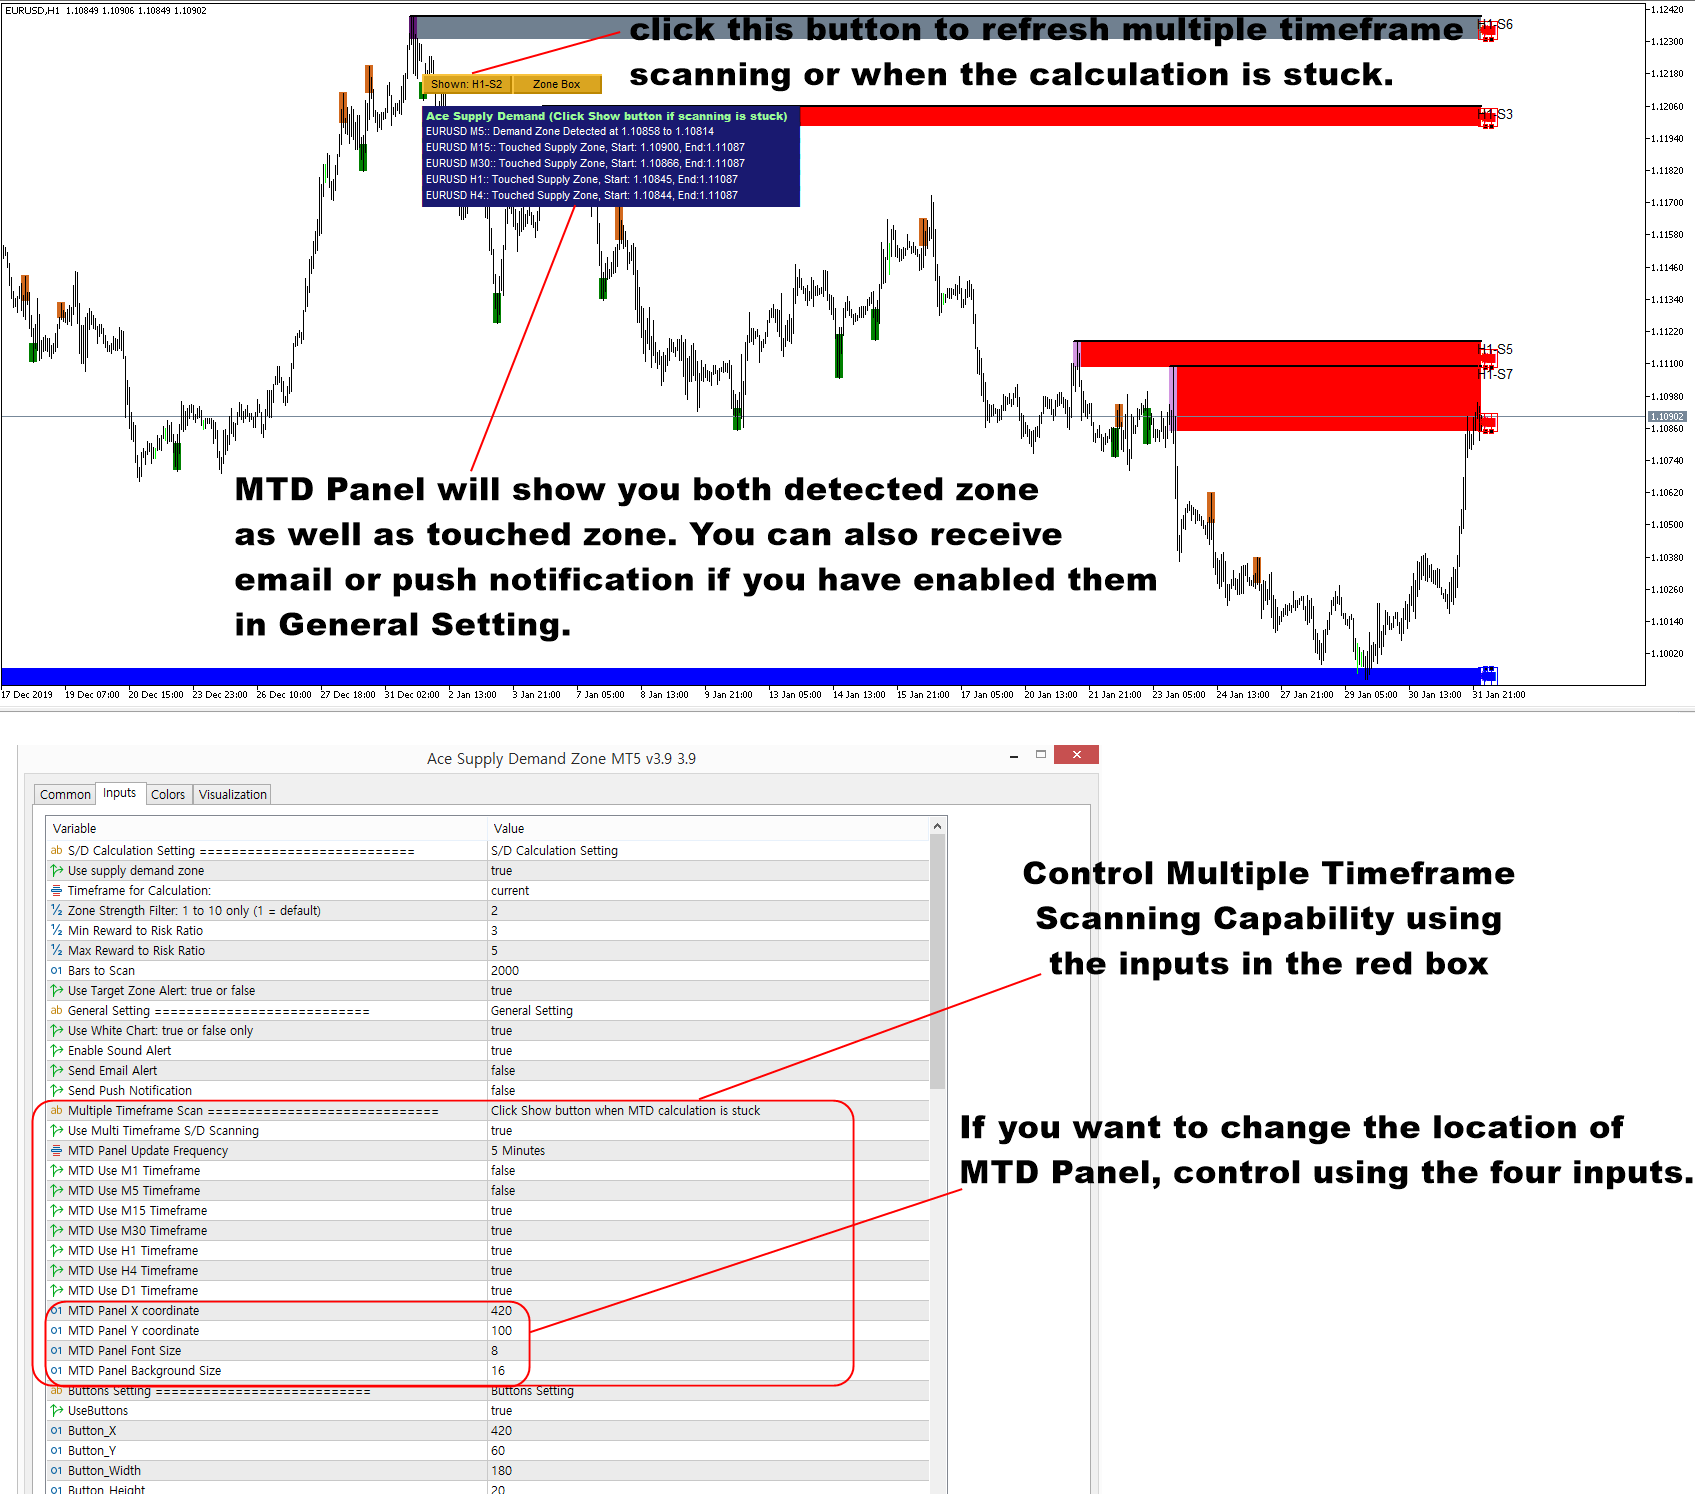
In Ace Supply Demand Zone indicator, you can scan the supply and demand zone across all timeframe for your Forex trading. This is a powerful feature included in Ace Supply Demand Zone indicator. Controlling the Multiple Timeframe scanning is similar to our other MetaTrader products like Harmonic Pattern Plus or X3 Chart Pattern Scanner. You can control them from the inputs under the Multiple Timeframe Scanning. With the inputs, you can enable or disable multiple timeframe scanning. You can also choose to switch on or off specific timeframe from your dashboard. In addition, you can also control how frequently the indicator should scan. The default value for update frequency is M5 timeframe. However, you can use M1 for update frequency if you need to scan them more frequently.
If you enabled email or push notification in the inputs under General Setting, then you can also receive the alert for the detected supply and demand zone as well as the touched supply and demand zone. The thing you need to understand about multiple timeframe scanning is that it requires multiple computation too per each timeframe. The computation can be heavier up to 7 times or more when you enabled M1 to D1 timeframes. Hence, due to data loading issues, the calculation might be stuck sometimes. In that case, just click Show button to refresh all the calculation. Of course, it is possible to switch off the multiple timeframe scanning if you only want to trade one timeframe.
Ace Supply Demand Zone in MetaTrader 4 and MetaTrader 5
In addition, we provide the YouTube video for Ace Supply Demand Zone Indicator. Hence, you can watch this YouTube Video to learn the basic operation with the supply demand zone indicator.
YouTube “Supply Demand Zone Indicator”: https://youtu.be/lr0dthrU9jo
Landing page for Ace Supply Demand Zone.
https://www.mql5.com/en/market/product/40076
https://www.mql5.com/en/market/product/40075
https://algotrading-investment.com/portfolio-item/ace-supply-demand-zone/
In Ace Supply Demand Zone indicator, you can scan the supply and demand zone across all timeframe for your Forex trading. This is a powerful feature included in Ace Supply Demand Zone indicator. Controlling the Multiple Timeframe scanning is similar to our other MetaTrader products like Harmonic Pattern Plus or X3 Chart Pattern Scanner. You can control them from the inputs under the Multiple Timeframe Scanning. With the inputs, you can enable or disable multiple timeframe scanning. You can also choose to switch on or off specific timeframe from your dashboard. In addition, you can also control how frequently the indicator should scan. The default value for update frequency is M5 timeframe. However, you can use M1 for update frequency if you need to scan them more frequently.
If you enabled email or push notification in the inputs under General Setting, then you can also receive the alert for the detected supply and demand zone as well as the touched supply and demand zone. The thing you need to understand about multiple timeframe scanning is that it requires multiple computation too per each timeframe. The computation can be heavier up to 7 times or more when you enabled M1 to D1 timeframes. Hence, due to data loading issues, the calculation might be stuck sometimes. In that case, just click Show button to refresh all the calculation. Of course, it is possible to switch off the multiple timeframe scanning if you only want to trade one timeframe.
Ace Supply Demand Zone in MetaTrader 4 and MetaTrader 5
In addition, we provide the YouTube video for Ace Supply Demand Zone Indicator. Hence, you can watch this YouTube Video to learn the basic operation with the supply demand zone indicator.
YouTube “Supply Demand Zone Indicator”: https://youtu.be/lr0dthrU9jo
Landing page for Ace Supply Demand Zone.
https://www.mql5.com/en/market/product/40076
https://www.mql5.com/en/market/product/40075
https://algotrading-investment.com/portfolio-item/ace-supply-demand-zone/
Young Ho Seo
Introduction to Advanced Price Pattern Scanner (Non Repainting)
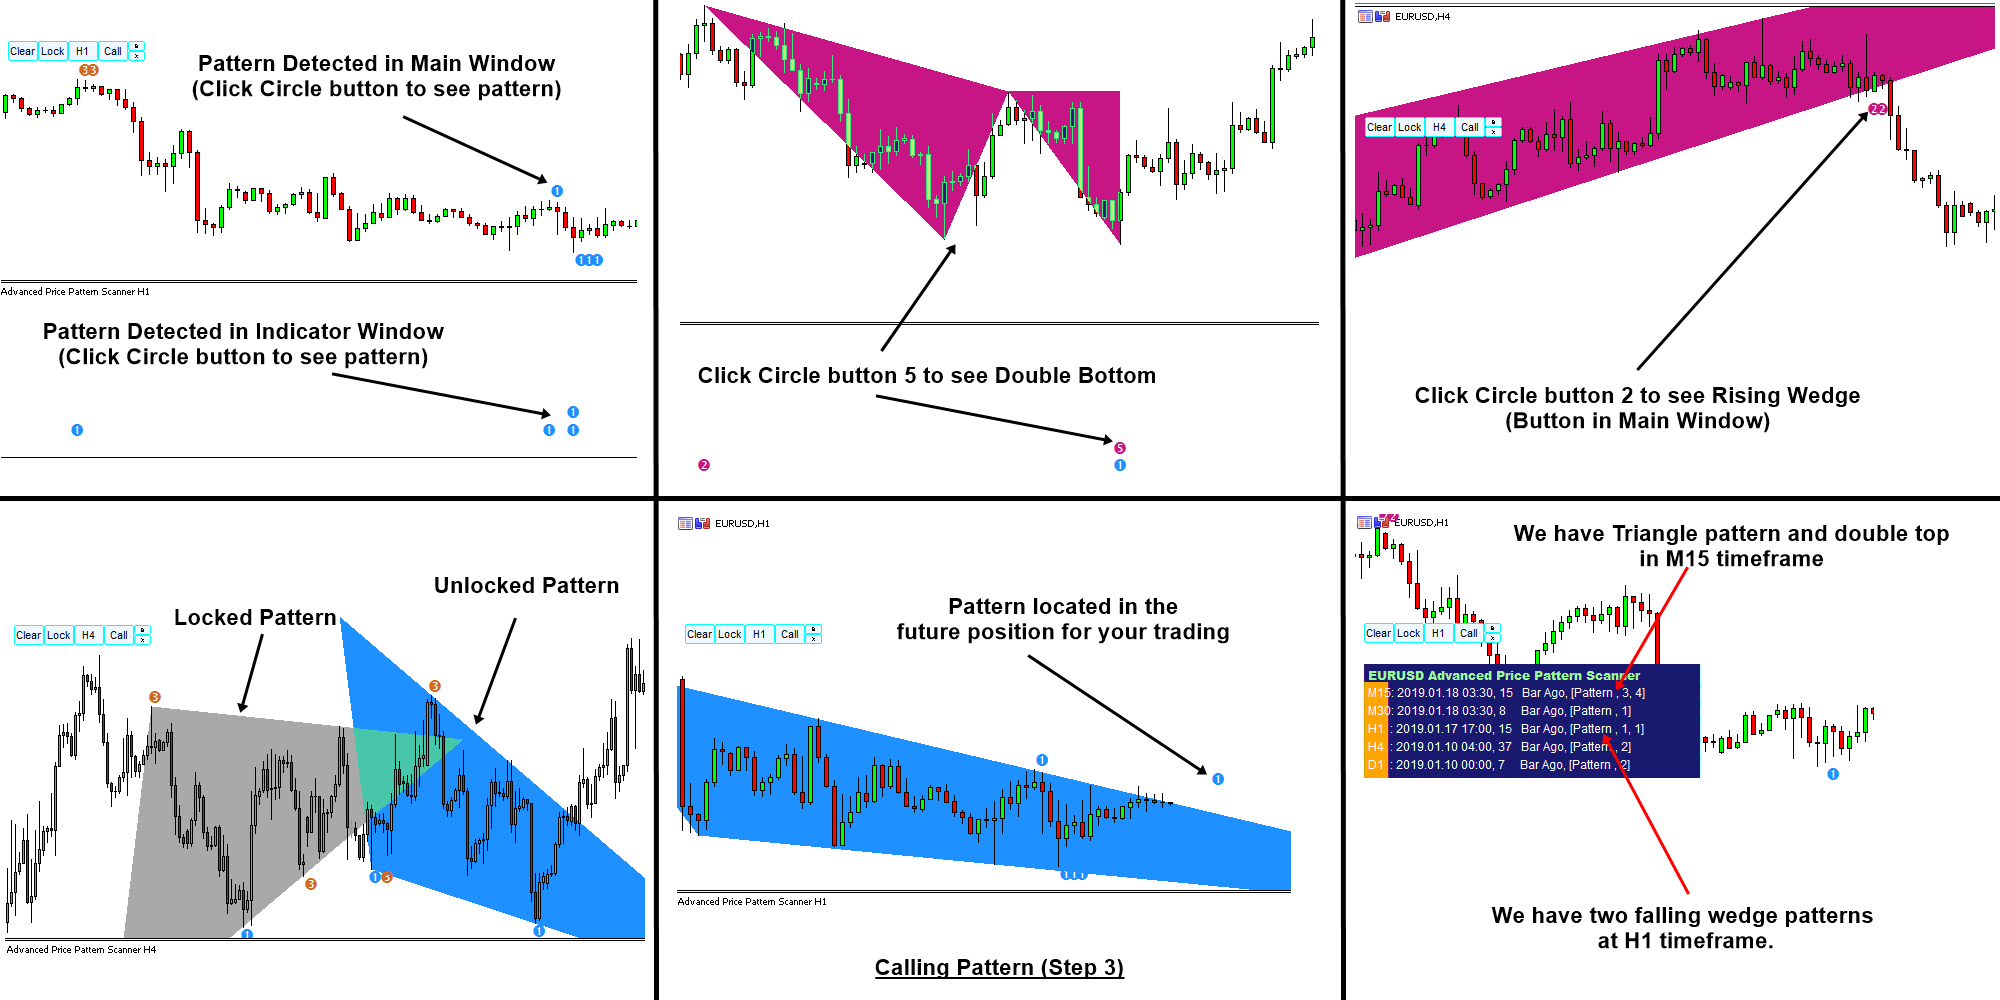
Advanced Price Pattern Scanner is the pattern scanner built upon our accumulative knowledge and insight from our financial market research many years. Advanced Price Pattern Scanner uses highly sophisticated pattern detection algorithm. However, we have designed it in the easy to use and intuitive manner. Advanced Price Pattern Scanner will show all the patterns in your chart in the most efficient format for your trading. It is non repainting pattern detector.
Detectable Patterns
Following pattern can be detected.
1) Triangle (Pattern Code = 0)
2) Falling Wedge (Pattern Code = 1)
3) Rising Wedge (Pattern Code = 2)
4) Double Top (Pattern Code = 3)
5) Double Bottom (Pattern Code = 4)
6) Head and Shoulder (Pattern Code = 5)
7) Reverse of Head and Shoulder (Pattern Code = 6)
8) Cup and Handle or Cup with Handle (Pattern Code = 7)
9) Reverse of Cup and Handle or Cup with Handle (Pattern Code = 8)
————————————————————————————-
Main Functionality
1) Pattern Detection in Indicator Window: Detected Patterns are located in the indicator window for your market analysis. To view or hide, just click the Circle button in the indicator window.
2) Pattern Detection in Main Window: Detected patterns are also located in the main window for your market analysis. To view or hide, just click the circle button in the main window.
3) Call Patterns: You can also call any patterns at the desired location in your chart. To access Call Pattern feature, click call button. Now you will have pointer in your chart. Move the pointer anywhere in your chart to located patterns, then click “Call” button again. You will see patterns corresponding to the location of pointer.
4) Multiple Timeframe Pattern Detection: You can also scan above patterns across different timeframe from one indicator. You can also switch on and off any specific timeframe per your need. Please note that Multiple Timeframe Pattern Detection requires much heavier computation.
5) Pattern Locking: You can also lock any patterns in your chart for your future use. Just click over Lock button to lock patterns in your chart.
———————————————————————————————–
Here is a Simple Video Tutorial on Advanced Price Pattern Scanner.
YouTube: https://www.youtube.com/watch?v=A1-IUr6u5Tg
Below are the links to Advanced Price Pattern Scanner.
https://algotrading-investment.com/portfolio-item/advanced-price-pattern-scanner/
https://www.mql5.com/en/market/product/24679
https://www.mql5.com/en/market/product/24678
You can also use this product together with Peak Trough Analysis tool to yield better profit. Peak Trough Analysis is free tool for everyone.
Below is how to download this free peak trough analysis indicator.
https://algotrading-investment.com/2019/08/29/how-to-download-peak-trough-analysis-tool/
Advanced Price Pattern Scanner is the pattern scanner built upon our accumulative knowledge and insight from our financial market research many years. Advanced Price Pattern Scanner uses highly sophisticated pattern detection algorithm. However, we have designed it in the easy to use and intuitive manner. Advanced Price Pattern Scanner will show all the patterns in your chart in the most efficient format for your trading. It is non repainting pattern detector.
Detectable Patterns
Following pattern can be detected.
1) Triangle (Pattern Code = 0)
2) Falling Wedge (Pattern Code = 1)
3) Rising Wedge (Pattern Code = 2)
4) Double Top (Pattern Code = 3)
5) Double Bottom (Pattern Code = 4)
6) Head and Shoulder (Pattern Code = 5)
7) Reverse of Head and Shoulder (Pattern Code = 6)
8) Cup and Handle or Cup with Handle (Pattern Code = 7)
9) Reverse of Cup and Handle or Cup with Handle (Pattern Code = 8)
————————————————————————————-
Main Functionality
1) Pattern Detection in Indicator Window: Detected Patterns are located in the indicator window for your market analysis. To view or hide, just click the Circle button in the indicator window.
2) Pattern Detection in Main Window: Detected patterns are also located in the main window for your market analysis. To view or hide, just click the circle button in the main window.
3) Call Patterns: You can also call any patterns at the desired location in your chart. To access Call Pattern feature, click call button. Now you will have pointer in your chart. Move the pointer anywhere in your chart to located patterns, then click “Call” button again. You will see patterns corresponding to the location of pointer.
4) Multiple Timeframe Pattern Detection: You can also scan above patterns across different timeframe from one indicator. You can also switch on and off any specific timeframe per your need. Please note that Multiple Timeframe Pattern Detection requires much heavier computation.
5) Pattern Locking: You can also lock any patterns in your chart for your future use. Just click over Lock button to lock patterns in your chart.
———————————————————————————————–
Here is a Simple Video Tutorial on Advanced Price Pattern Scanner.
YouTube: https://www.youtube.com/watch?v=A1-IUr6u5Tg
Below are the links to Advanced Price Pattern Scanner.
https://algotrading-investment.com/portfolio-item/advanced-price-pattern-scanner/
https://www.mql5.com/en/market/product/24679
https://www.mql5.com/en/market/product/24678
You can also use this product together with Peak Trough Analysis tool to yield better profit. Peak Trough Analysis is free tool for everyone.
Below is how to download this free peak trough analysis indicator.
https://algotrading-investment.com/2019/08/29/how-to-download-peak-trough-analysis-tool/
Young Ho Seo
Price Breakout Pattern Scanner and Smart Renko
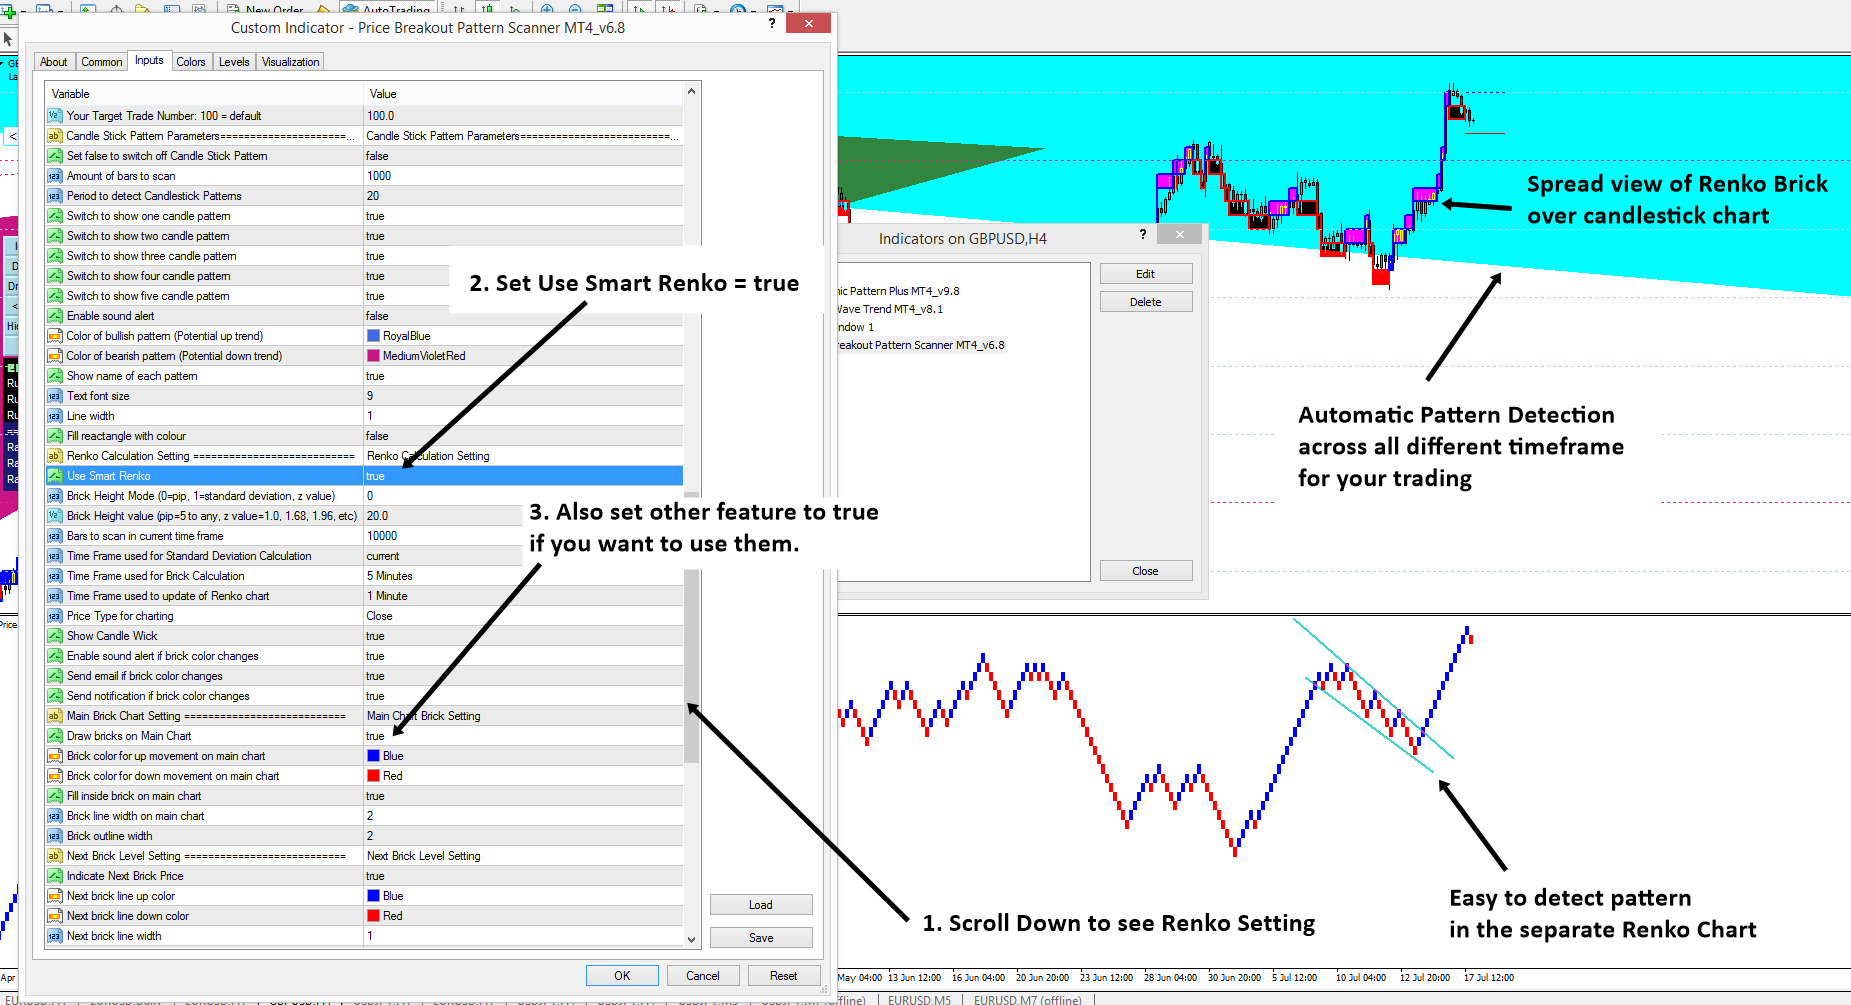
Our Price breakout pattern scanner is very unique tool in the market because it have built in feature for Smart Renko inside. There is reason for that. Smart Renko is really helpful for any pattern detection in the separate window. So they will reinforce your trading decision. Imagine that in the candlestick chart, Price Breakout Pattern Scanner is automatically detecting the patterns for you. In the indicator window, you can also detect any other important patterns readily. If you can collect evidence for your trading from both candlestick chart and renko chart, you can make very powerful trading decision.
Let us show how to switch on and off the Smart Renko chart from your price breakout pattern Scanner. Before you are using Smart Renko feature enabled, you might download sufficient history in your chart first. Once you have done it, set Use “Smart Renko = true” from your indicator setting. See the screenshots for your better understanding. Some of our customer know that there is great way of trading with Price breakout pattern scanner and our Harmonic Pattern Plus (or Harmonic Pattern Scenario Planner or Profitable Pattern Scanner).
Here are the links for the Price Breakout Pattern Scanner
https://www.mql5.com/en/market/product/4859
https://www.mql5.com/en/market/product/4858
https://algotrading-investment.com/portfolio-item/price-breakout-pattern-scanner/
Our Price breakout pattern scanner is very unique tool in the market because it have built in feature for Smart Renko inside. There is reason for that. Smart Renko is really helpful for any pattern detection in the separate window. So they will reinforce your trading decision. Imagine that in the candlestick chart, Price Breakout Pattern Scanner is automatically detecting the patterns for you. In the indicator window, you can also detect any other important patterns readily. If you can collect evidence for your trading from both candlestick chart and renko chart, you can make very powerful trading decision.
Let us show how to switch on and off the Smart Renko chart from your price breakout pattern Scanner. Before you are using Smart Renko feature enabled, you might download sufficient history in your chart first. Once you have done it, set Use “Smart Renko = true” from your indicator setting. See the screenshots for your better understanding. Some of our customer know that there is great way of trading with Price breakout pattern scanner and our Harmonic Pattern Plus (or Harmonic Pattern Scenario Planner or Profitable Pattern Scanner).
Here are the links for the Price Breakout Pattern Scanner
https://www.mql5.com/en/market/product/4859
https://www.mql5.com/en/market/product/4858
https://algotrading-investment.com/portfolio-item/price-breakout-pattern-scanner/
Young Ho Seo
Forex Analysis done by the Artificial Intelligence Jane with the Supply Demand Analysis. This video provides the forex analysis you can use for your day trading with forex market. Make sure to subscribe to our YouTube Channel so you can receive immediate alert for new Forex Prediction upload.
YouTube: https://youtu.be/M6aiuDlhV2I
Young Ho Seo
Must Read Articles for Professional Harmonic Pattern Trader
Here is the short but insightful article for Harmonic Pattern Trader. This article will explain type of Harmonic Pattern indicators and the technology around the harmonic pattern detection algorithm. If you are professional trader, then you must read these three articles before trading with them.
1) Turning Point and Trend: https://algotrading-investment.com/2019/07/06/turning-point-and-trend/
2) Pattern are good predictor of Market Turning Point: https://algotrading-investment.com/2019/07/07/patterns-are-the-good-predictor-of-market-turning-point/
3) Harmonic Pattern Indicator Types: https://algotrading-investment.com/2019/03/15/harmonic-pattern-indicator-types/
Throughout these articles, we also emphasize the importance of estimating true success rate for harmonic pattern to build the winning trading strategy.
Also below we provide the links for the automated Harmonic Pattern Detection indicator.
4) Harmonic Pattern Scenario Planner
https://www.mql5.com/en/market/product/6101
https://www.mql5.com/en/market/product/6240
https://algotrading-investment.com/portfolio-item/harmonic-pattern-scenario-planner/
5) X3 Chart Pattern Scanner
https://algotrading-investment.com/portfolio-item/profitable-pattern-scanner/
https://www.mql5.com/en/market/product/41992
https://www.mql5.com/en/market/product/41993
Here is the short but insightful article for Harmonic Pattern Trader. This article will explain type of Harmonic Pattern indicators and the technology around the harmonic pattern detection algorithm. If you are professional trader, then you must read these three articles before trading with them.
1) Turning Point and Trend: https://algotrading-investment.com/2019/07/06/turning-point-and-trend/
2) Pattern are good predictor of Market Turning Point: https://algotrading-investment.com/2019/07/07/patterns-are-the-good-predictor-of-market-turning-point/
3) Harmonic Pattern Indicator Types: https://algotrading-investment.com/2019/03/15/harmonic-pattern-indicator-types/
Throughout these articles, we also emphasize the importance of estimating true success rate for harmonic pattern to build the winning trading strategy.
Also below we provide the links for the automated Harmonic Pattern Detection indicator.
4) Harmonic Pattern Scenario Planner
https://www.mql5.com/en/market/product/6101
https://www.mql5.com/en/market/product/6240
https://algotrading-investment.com/portfolio-item/harmonic-pattern-scenario-planner/
5) X3 Chart Pattern Scanner
https://algotrading-investment.com/portfolio-item/profitable-pattern-scanner/
https://www.mql5.com/en/market/product/41992
https://www.mql5.com/en/market/product/41993
Young Ho Seo
Winning Trading Logic – Detecting Supply and Demand Unbalance
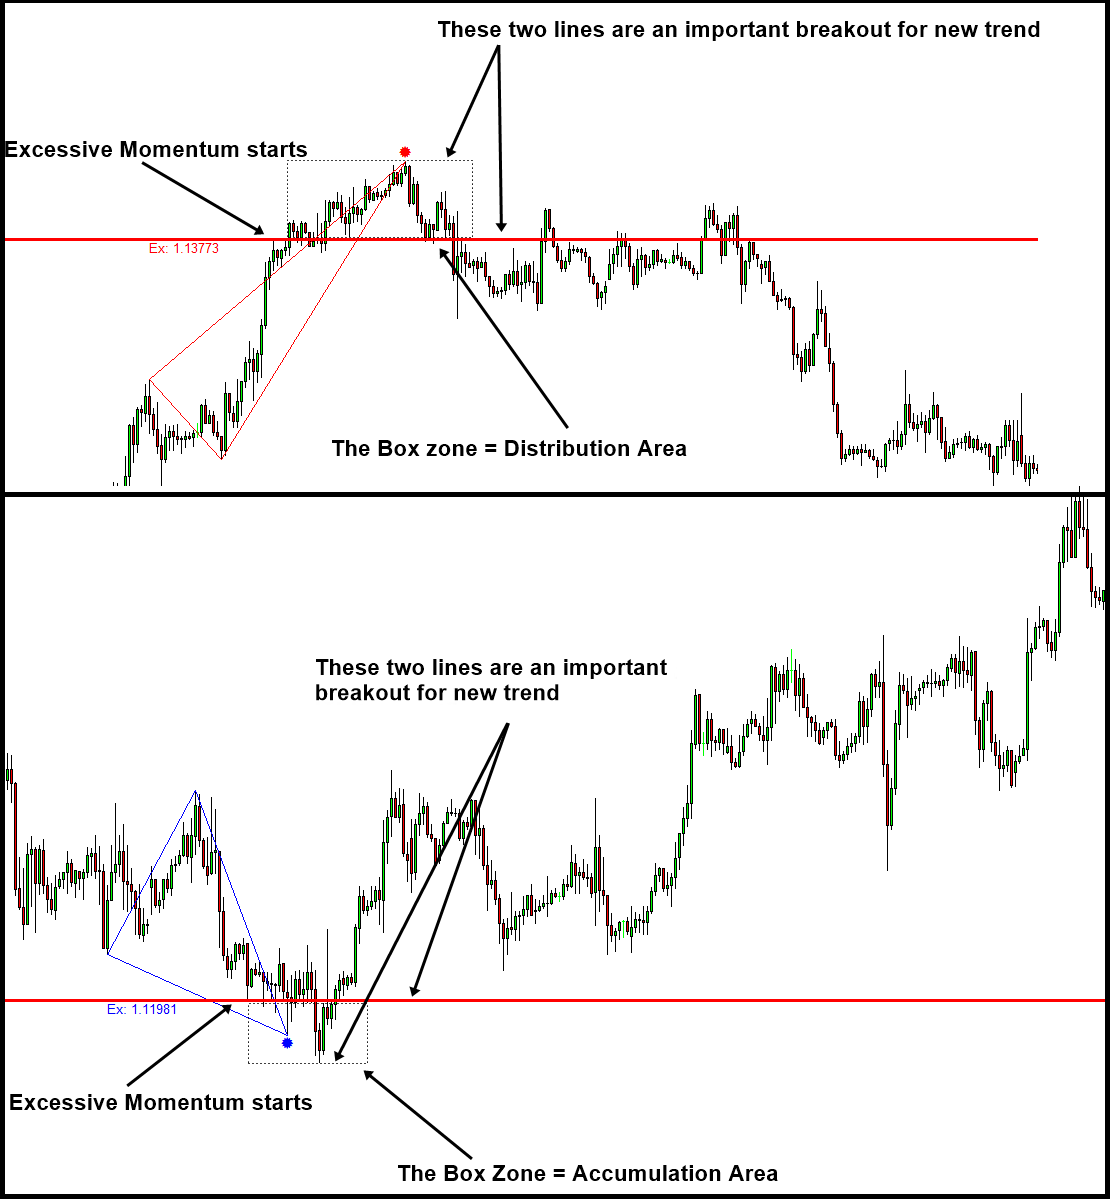
As we have pointed out in our article, detecting the supply and demand unbalance is the most important key in making profits in Financial market. The excessive momentum indicator is the automated tool to detect these unbalance in supply and demand for your trading. With excessive momentum drawn in your chart, it is much easier to predict the timing of new trend and its direction.
Here is the insightful article explaining where the profits comes and how the profits are captured with the knowledge of excessive momentum. If you really want to make money in the market, must read this article. Reading does not cost you anything.
https://algotrading-investment.com/2018/10/29/introduction-to-excessive-momentum-trading/
This Excessive Momentum Zone can be considered as either Accumulation or Distribution area in the Volume Spread Analysis. You can further find the symptoms of accumulation and distribution area using our Volume Spread Pattern Indicator (Paid and Advanced version) or Volume Spread Pattern Detector (Free and Light version). You can watch the YouTube videos to find more about the Excessive Momentum Indicator.
YouTube Video 1: https://youtu.be/oztARcXsAVA
YouTube Video 2: https://youtu.be/A4JcTcakOKw
Here is link to Excessive Momentum Indicator available on MetaTrader 4 and MetaTrader 5 platform.
https://algotrading-investment.com/portfolio-item/excessive-momentum-indicator/
https://www.mql5.com/en/market/product/30641
https://www.mql5.com/en/market/product/30621
As we have pointed out in our article, detecting the supply and demand unbalance is the most important key in making profits in Financial market. The excessive momentum indicator is the automated tool to detect these unbalance in supply and demand for your trading. With excessive momentum drawn in your chart, it is much easier to predict the timing of new trend and its direction.
Here is the insightful article explaining where the profits comes and how the profits are captured with the knowledge of excessive momentum. If you really want to make money in the market, must read this article. Reading does not cost you anything.
https://algotrading-investment.com/2018/10/29/introduction-to-excessive-momentum-trading/
This Excessive Momentum Zone can be considered as either Accumulation or Distribution area in the Volume Spread Analysis. You can further find the symptoms of accumulation and distribution area using our Volume Spread Pattern Indicator (Paid and Advanced version) or Volume Spread Pattern Detector (Free and Light version). You can watch the YouTube videos to find more about the Excessive Momentum Indicator.
YouTube Video 1: https://youtu.be/oztARcXsAVA
YouTube Video 2: https://youtu.be/A4JcTcakOKw
Here is link to Excessive Momentum Indicator available on MetaTrader 4 and MetaTrader 5 platform.
https://algotrading-investment.com/portfolio-item/excessive-momentum-indicator/
https://www.mql5.com/en/market/product/30641
https://www.mql5.com/en/market/product/30621
Young Ho Seo
Harmonic Pattern Indicator List for MetaTrader 5
Harmonic Pattern Indicator provide a mean of detecting the turning point in the market. It is one way to solve the puzzle of market geometry, which is often not solvable with technical indicators. If the harmonic pattern detection can be done automatically, I think that is very good start for any harmonic pattern trading.
Here is the list of Harmonic Pattern Indicator for your MetaTrader 5 platform, the most popular forex trading platform in the world. These harmonic pattern indicators are not only detecting harmonic pattern but they also provide the additional features to support you to win in your trading. These listed Harmonic pattern indicators here will provide the best value for the money probably.
1. Harmonic Pattern Plus for MetaTrader 5
Harmonic Pattern Plus is the harmonic pattern scanner. It can detect harmonic patterns with predefined trading entries and stops. Pattern Completion Interval, Potential Reversal Zone and Potential Continuation Zone are supported. In addition, other dozens of powerful features are added like Japanese candlestick detection, automatic channel, etc. Please visit the product page about more information.
https://www.mql5.com/en/market/product/4475
https://algotrading-investment.com/portfolio-item/harmonic-pattern-plus/
2. X3 Chart Pattern Scanner for MetaTrader 5
X3 Chart Pattern Scanner is non repainting and non lagging pattern scanner for Harmonic Pattern, Elliott Wave pattern and X3 patterns. It is the most advanced but user friendly harmonic pattern indicator. As a bonus, this tool can detect around 52 bearish and bullish Japanese candlestick patterns + advanced Channel features. This is the most advanced Harmonic and Elliott wave pattern scanner in the market.
https://www.mql5.com/en/market/product/41992
https://algotrading-investment.com/portfolio-item/profitable-pattern-scanner/
3. Harmonic Pattern Scenario Planner for MetaTrader 5
With additional features of predicting future harmonic patterns, this is the tactical harmonic pattern indicator with advanced simulation capability on top of many powerful features of harmonic pattern plus. Try this tactical harmonic pattern indicator then you will know its power.
https://www.mql5.com/en/market/product/6101
https://algotrading-investment.com/portfolio-item/harmonic-pattern-scenario-planner/
Harmonic Pattern Indicator provide a mean of detecting the turning point in the market. It is one way to solve the puzzle of market geometry, which is often not solvable with technical indicators. If the harmonic pattern detection can be done automatically, I think that is very good start for any harmonic pattern trading.
Here is the list of Harmonic Pattern Indicator for your MetaTrader 5 platform, the most popular forex trading platform in the world. These harmonic pattern indicators are not only detecting harmonic pattern but they also provide the additional features to support you to win in your trading. These listed Harmonic pattern indicators here will provide the best value for the money probably.
1. Harmonic Pattern Plus for MetaTrader 5
Harmonic Pattern Plus is the harmonic pattern scanner. It can detect harmonic patterns with predefined trading entries and stops. Pattern Completion Interval, Potential Reversal Zone and Potential Continuation Zone are supported. In addition, other dozens of powerful features are added like Japanese candlestick detection, automatic channel, etc. Please visit the product page about more information.
https://www.mql5.com/en/market/product/4475
https://algotrading-investment.com/portfolio-item/harmonic-pattern-plus/
2. X3 Chart Pattern Scanner for MetaTrader 5
X3 Chart Pattern Scanner is non repainting and non lagging pattern scanner for Harmonic Pattern, Elliott Wave pattern and X3 patterns. It is the most advanced but user friendly harmonic pattern indicator. As a bonus, this tool can detect around 52 bearish and bullish Japanese candlestick patterns + advanced Channel features. This is the most advanced Harmonic and Elliott wave pattern scanner in the market.
https://www.mql5.com/en/market/product/41992
https://algotrading-investment.com/portfolio-item/profitable-pattern-scanner/
3. Harmonic Pattern Scenario Planner for MetaTrader 5
With additional features of predicting future harmonic patterns, this is the tactical harmonic pattern indicator with advanced simulation capability on top of many powerful features of harmonic pattern plus. Try this tactical harmonic pattern indicator then you will know its power.
https://www.mql5.com/en/market/product/6101
https://algotrading-investment.com/portfolio-item/harmonic-pattern-scenario-planner/
: