|
4 years
experience
|
7
products
|
0
demo versions
|
|
1
jobs
|
0
signals
|
0
subscribers
|
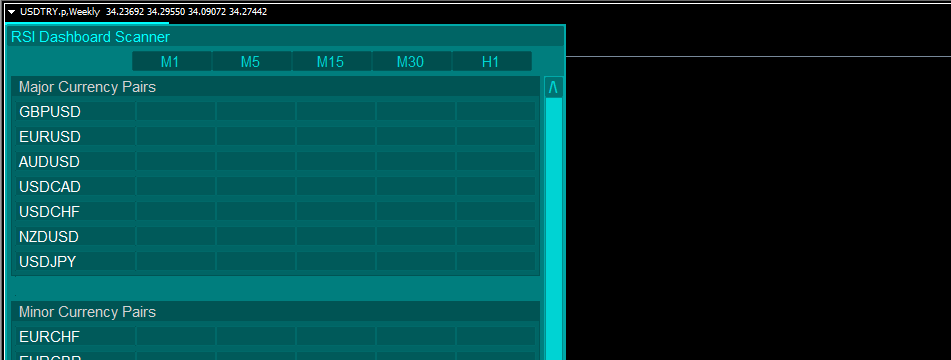
I'm a software developer who crafts tools that make trading on MT4 and MT5 easier, smoother, and a bit more fun!