Teddy Mutugi Mworia Teddy Mutugi Mworia / 个人资料
- 信息
|
3 年
经验
|
7
产品
|
0
演示版
|
|
1
工作
|
0
信号
|
0
订阅者
|
这个指标允许您通过在背景中应用两种可自定义颜色之间的平滑过渡来彻底改变图表的外观。通过这种方式,您可以创建出一个引人注目的渐变效果,为您的图表带来一种新鲜、现代的外观,使其在视觉上更加吸引人,增加了交易的乐趣与体验。 当您将该指标附加到图表上时,渐变效果将自动应用于当前图表上所有的指标窗口。这不仅提升了现有窗口的视觉效果,还会影响任何后续添加的新指标窗口,确保每一个窗口都能展现出一致且优雅的外观。 您可以根据自己的喜好选择渐变的颜色,使您的图表独一无二。这个简单而有效的工具使得交易者在进行市场分析时,可以更专注于图表的内容,而不会因为视觉上的繁杂而分散注意力。 快来尝试一下这个指标,给您的图表焕然一新吧!通过改变图表的外观,您将能够提升您的交易体验,让每一次交易都充满活力与灵感。
MT5 CCI仪表板扫描器 MT5 CCI仪表板扫描器是一种工具,帮助跟踪不同时间框架和工具的商品渠道指数(CCI)水平,并在检测到新信号时提供实时警报。它用户友好,计算能力要求低,确保在任何计算机上都能平稳运行。 主要特点 自动仪器分组 :扫描器从您的市场观察列表中收集所有仪器,并将其分类(主要、次要、外来、其他)。使用设置中的简单复选框界面,轻松选择要扫描的仪器。 可自定义时间框架选择 :选择21种不同的时间框架进行扫描。所有选定的时间框架在仪表板上显示,并为每个时间框架发送新的信号通知。 简单的CCI设置 :调整CCI设置,包括周期和应用价格,并设置买入/卖出水平。您还可以决定是根据当前蜡烛还是最近关闭的蜡烛进行扫描。 颜色自定义 :个性化仪表板的主要背景、前景和信号箭头的颜色。扫描器将确保一切看起来整洁,并且容易辨认。 灵活的信号显示 :选择仪表板显示CCI值、信号年龄或不同设计的方向箭头。 📌 如果您觉得这个扫描器有帮助,快速的评分或评论将不胜感激!如果您希望为其他指标创建类似的扫描器,随时联系我们——我很乐意提供帮助 ❤️
MT4 CCI仪表板扫描仪帮助您跟踪不同时间框架和工具的商品通道指数(CCI)水平,并在检测到新信号时提供实时警报。它用户友好,对计算能力的要求较低,确保在任何计算机上都能顺畅运行。 主要特点: 自动工具分组 :扫描仪收集您市场观察列表中的所有工具,并将其组织到类别中(主要货币、次要货币、外汇、其他)。您可以通过设置中的简单复选框界面轻松选择要扫描的工具。 可自定义时间框架选择 :从设置页面选择9个不同时间框架中的任何一个进行扫描。所有选定的时间框架将在仪表板上显示,并为每个时间框架发送新信号通知。 简单的CCI设置 :您可以调整CCI设置,包括周期和应用价格,并设置买入/卖出水平。您还可以选择是基于当前蜡烛还是最新关闭的蜡烛进行扫描。 颜色自定义 :个性化仪表板的主要背景、前景和信号箭头的颜色。扫描仪将调整所有内容,使其看起来整洁且视觉舒适。 灵活的信号显示 :选择仪表板显示CCI值、信号时长或方向箭头,以不同的设计呈现。 图表切换窗口 :点击一个工具和时间框架将打开一个图表切换窗口,您可以在其中切换当前图表或打开新图表。 仪表板可拖动

精细调整移动平均线的终极工具 这款先进的工具旨在彻底简化并优化您的移动平均线设置。借助 MA Tuner,您可以通过一个用户友好的面板轻松调整关键参数,包括周期、偏移量、计算方法和价格类型。通过这种方式,您可以即时获取详细的统计数据,了解蜡烛图与移动平均线的交互情况,包括蜡烛图穿越 MA 线的频率,以及它们相对于 MA 线的开盘价和收盘价的位置。 与标准的移动平均线指标相比,MA Tuner 提供了显著的优势。虽然它绘制的 MA 线与标准移动平均线指标相同,但 MA Tuner 让您无需每次调整周期或偏移量时都打开指标窗口。这种设计极大地提高了操作的便捷性和效率,使得您可以更加专注于交易策略的优化,而不必浪费时间在繁琐的设置调整上。MA Tuner 的功能不仅能够帮助您更好地分析市场趋势,还能在实时交易中提供及时的反馈,从而助力您的交易决策。
This indicator scans the Moving Average values for 2 Moving Averages on multiple pairs and multiple timeframes in realtime and displays a Buy signal when the fast MA is above the slow MA and a Sell signal when the fast MA is below the slow MA. -All the MA parameters(Period, Method and Applied price) can be changed from the inputs window. -You can either add your own list of pairs to scan or set the scanner to automatically use the pairs in the market watch using the Symbols Source input
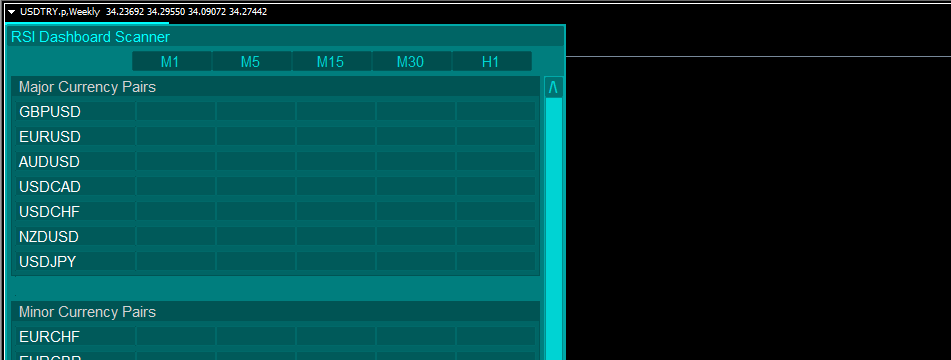
通过新版本的RSI扫描仪,提升您的交易体验,增添更多乐趣! 自动仪器分组 :扫描仪自动从您的市场观察中收集所有仪器,并将其组织为四个类别:主要货币、次要货币、外汇和其他。 可自定义信号选择 :在设置页面,您可以选择要扫描的仪器信号。 灵活的时间框架选择 :您还可以指定希望监控的信号时间框架。 RSI参数配置 :轻松设置RSI参数,包括周期和适用价格,同时定义买入和卖出水平。您可以选择使用当前蜡烛的数据,或在处理信号之前等待蜡烛关闭。 个性化颜色定制 :自定义前景、背景、买入箭头和卖出箭头的颜色。扫描仪会自动调整每个元素的颜色,以创建一个美观的界面。 箭头类型选择 :从各种箭头类型中选择以符合您的偏好。 实时警报 :在所选仪器和时间框架上接收新信号的警报(当RSI穿越买入或卖出水平时)。警报可以直接发送到您的MT4平台,以及您的手机和电子邮件。 📌 如果您觉得这个扫描器有帮助,快速的评分或评论将不胜感激!如果您希望为其他指标创建类似的扫描器,随时联系我们——我很乐意提供帮助❤️


