Alexander Fedosov / Profile
- Information
|
10+ years
experience
|
8
products
|
1109
demo versions
|
|
8
jobs
|
0
signals
|
0
subscribers
|
💎For METATRADER 5 https://www.mql5.com/en/market/mt5?Filter=alex2356
💎For METATRADER 4 https://www.mql5.com/en/market/mt4?Filter=alex2356
This robot operates based on the Parabolic SAR indicator. Verion for MetaTrader4 here . The advanced EA version includes the following changes and improvements: The EA behavior has been monitored on various account types and in different conditions (fixed/floating spread, ECN/cent accounts, etc.) The EA functionality has been expanded. Features better flexibility and efficiency, better monitoring of open positions. Works on both 4 and 5 digits brokers. The EA does not use martingale, grid or

There are multiple different approaches to market research and analysis. The main ones are technical and fundamental. In technical analysis, traders collect, process and analyze numerical data and parameters related to the market, including prices, volumes, etc. In fundamental analysis, traders analyze events and news affecting the markets directly or indirectly. The article deals with price velocity measurement methods and studies trading strategies based on that methods.

The article presents a new version of the Pattern Analyzer application. This version provides bug fixes and new features, as well as the revised user interface. Comments and suggestions from previous article were taken into account when developing the new version. The resulting application is described in this article.

The purpose of this article is to create a custom tool, which would enable users to receive and use the entire array of information about patterns discussed earlier. We will create a library of pattern related functions which you will be able to use in your own indicators, trading panels, Expert Advisors, etc.

In the previous article, we analyzed 14 patterns selected from a large variety of existing candlestick formations. It is impossible to analyze all the patterns one by one, therefore another solution was found. The new system searches and tests new candlestick patterns based on known candlestick types.

In this article, we will consider popular candlestick patterns and will try to find out if they are still relevant and effective in today's markets. Candlestick analysis appeared more than 20 years ago and has since become quite popular. Many traders consider Japanese candlesticks the most convenient and easily understandable asset price visualization form.

In this article, we will analyze the concept of correlation between variables, as well as methods for the calculation of correlation coefficients and their practical use in trading. Correlation is a statistical relationship between two or more random variables (or quantities which can be considered random with some acceptable degree of accuracy). Changes in one ore more variables lead to systematic changes of other related variables.

The article considers applying the separate optimization method during various market conditions. Separate optimization means defining trading system's optimal parameters by optimizing for an uptrend and downtrend separately. To reduce the effect of false signals and improve profitability, the systems are made flexible, meaning they have some specific set of settings or input data, which is justified because the market behavior is constantly changing.

The article explores the advantages and disadvantages of trading in flat periods. The ten strategies created and tested within this article are based on the tracking of price movements inside a channel. Each strategy is provided with a filtering mechanism, which is aimed at avoiding false market entry signals.

The article is devoted to the analysis of trading signals for the MetaTrader 5 platform, which enable the automated execution of trading operations on subscribers' accounts. Also, the article considers the development of tools, which help search for potentially promising trading signals straight from the terminal.

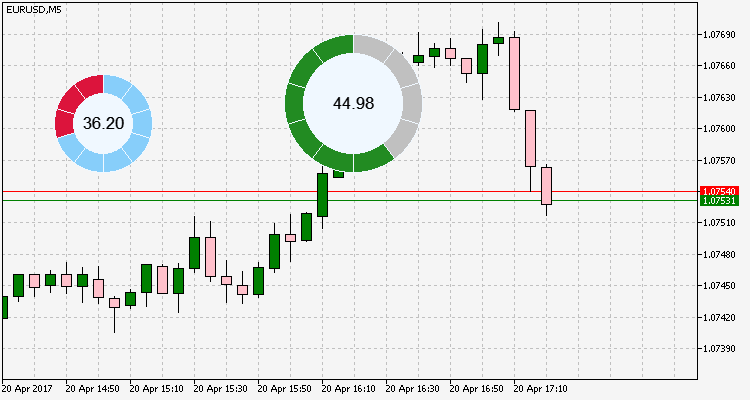
The article considers new types of indicators with more complex structural implementation. It also describes the development of pseudo-3D indicator types and dynamic infographics.
The article deals with developing custom graphical indicators using graphical primitives of the CCanvas class.
- Проработаны множество методов для настройки цвета/размера.
- Вертикальная/горизонтальная ориентация.

The article highlights several methods for trend identification aiming to determine the trend duration relative to the flat market. In theory, the trend to flat rate is considered to be 30% to 70%. This is what we'll be checking.
In this article, we develop and tests several strategies based on the Donchian channel using various indicator filters. We also perform a comparative analysis of their operation.
The article provides a brief overview of ten trend following strategies, as well as their testing results and comparative analysis. Based on the obtained results, we draw a general conclusion about the appropriateness, advantages and disadvantages of trend following trading.


