Kourosh Hossein Davallou / Profile
- Information
|
13+ years
experience
|
33
products
|
75
demo versions
|
|
0
jobs
|
0
signals
|
0
subscribers
|
Dual Timeframe VWAP Indicator for MT4 Description Professional VWAP indicator that displays both **Daily** and **Weekly** VWAP simultaneously on your chart. Features: - Dual VWAP Lines: Blue for Daily, Red for Weekly - Configurable Bands: Two deviation bands for each timeframe - Session Control: Customizable trading hours for Daily VWAP - Clean Visuals: Solid lines for main VWAP, dashed for bands - Optimizable: Parameters can be optimized using Genetic Algorithm Key Settings

Advanced ZigZag Histogram with Divergence Detection and Order Flow Simulation ZigDeltaSwingPro is a comprehensive technical analysis indicator for MetaTrader 5, built on the classic ZigZag algorithm and enhanced with modern features such as divergence detection, dynamic histogram visualization, swing pattern recognition, and simulated order flow insights. Designed for scalpers and swing traders alike, it leverages MT5’s internal tick volume to deliver actionable signals—no external data
RenkoVP is a professional-grade indicator designed for structure-based traders who rely on Renko bricks, volume profile, Fibonacci zones, and pattern recognition. It runs fully online on the main chart—no offline charts required—and offers a modular, interactive interface for precise market analysis.
---
📸 Visual Integration (Based on Chart Screenshots)
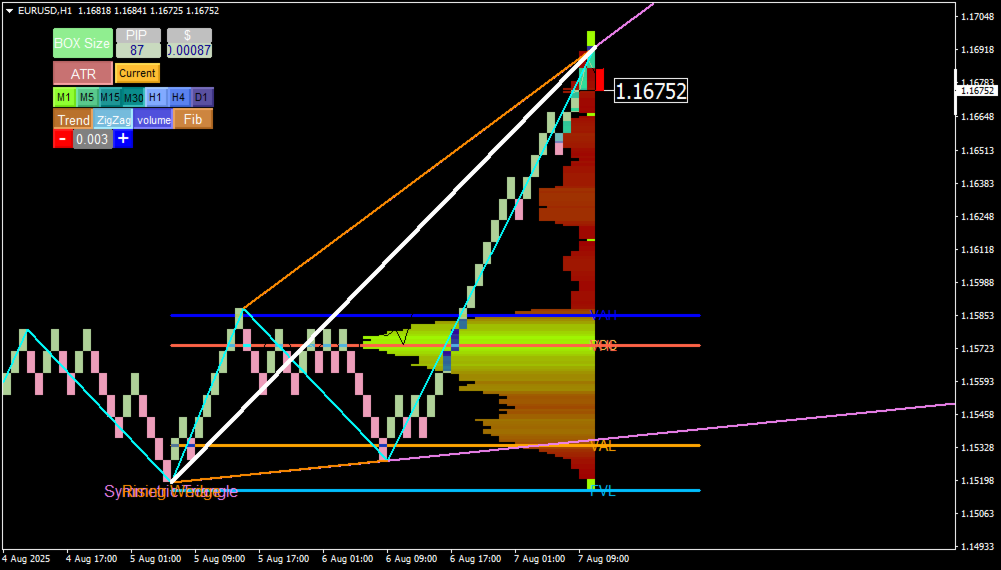
The screenshots demonstrate RenkoVP in action on EUR/USD charts (H1 and M5), showcasing:
- Renko Bricks: Turquoise and pink bricks represent bullish and bearish moves. Brick size is dynamically set via ATR (Auto mode) or manually in pips/dollars.
- Trend Line Tool: A white diagonal line connects the highest and lowest visible prices. Once drawn, it activates Volume and Fibonacci tools.
- Volume Profile: Displayed as a horizontal histogram on the right, with color-coded zones:
- POC (orange line): Highest traded volume
- VAH / VAL (blue lines): Value Area High/Low
- HVL / LVL / DVL / TVL: Additional volume metrics for deeper insight
- Dynamic Fibonacci Levels: Drawn from the trend line, fully editable. Key levels like 61.8% are marked for reversal or continuation setups.
- Zigzag & Pattern Recognition: Zigzag lines adapt to Renko structure. The indicator auto-detects classic and harmonic patterns (Triangle, Flag, Bat, Butterfly, etc.).
- Control Panel: Includes BOX Size, ATR, timeframe buttons (M1 to D1), and toggles for Trend, Zigzag, Volume, and Fibo modules.

Advanced Renko & Point & Figure Indicator with Win/Loss Pattern Analysis This powerful indicator combines two proven strategies—Renko and Point & Figure (P&F)—into one comprehensive tool for trend identification, pattern recognition, and risk management. With dynamic Box Size calculation (Fixed or ATR-based), moving average filters, and win/loss pattern detection, traders can make smarter, data-driven decisions. Key Features Hybrid Renko + P&F
Order blocks are essential structures in trading that indicate areas where large institutional traders, like banks and hedge funds, have placed their orders. These blocks represent significant price levels where substantial buying or selling activity has occurred, providing clues about potential market movements. So, why should you, as a trader, care about order blocks? Well, knowing where these big orders are placed can give you a huge advantage. It’s like having a map showing
Overview RenkoVP is a professional tool for price structure analysis that runs fully online on the main chart. Unlike many other Renko indicators, it requires no offline charts. The indicator combines Renko bricks, volume profile, dynamic Fibonacci levels, and automatic pattern recognition to help traders identify trends, key zones, and precise entry/exit points. Renko Bricks Configuration The indicator offers both manual and automatic brick configuration: No offline chart required - runs

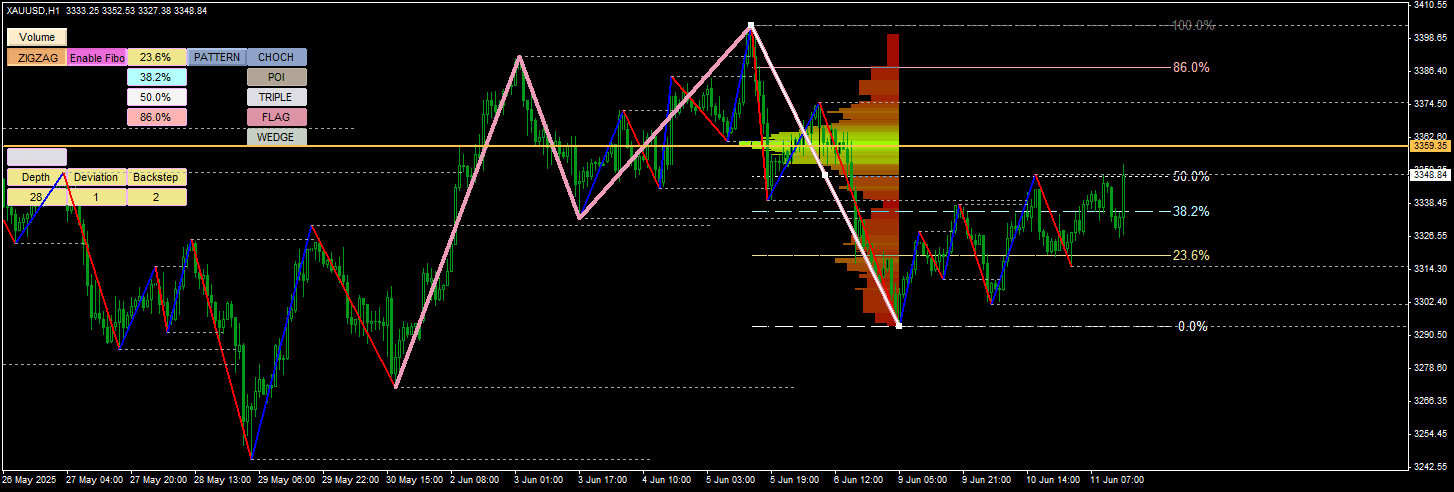
🔸 Price had retraced to the 50% Fibonacci level following a prior downtrend, signaling a possible corrective move.
🟢 There was a demand zone at that level, showing previous strong buying interest.
📐 The lower boundary of a flag/wedge formation aligned perfectly with this Fib level, hinting at a breakout opportunity.
🔁 A bullish Change of Character (CHoCH) had just formed, suggesting a structural shift from bearish to bullish momentum.
📊 Supporting evidence: bullish candles forming at support and a low-volume pullback, ideal for catching a breakout early.
👉 The plan: Enter long at or just above the 50% level, with stop-loss below the wedge and targets toward 61.8% and beyond.
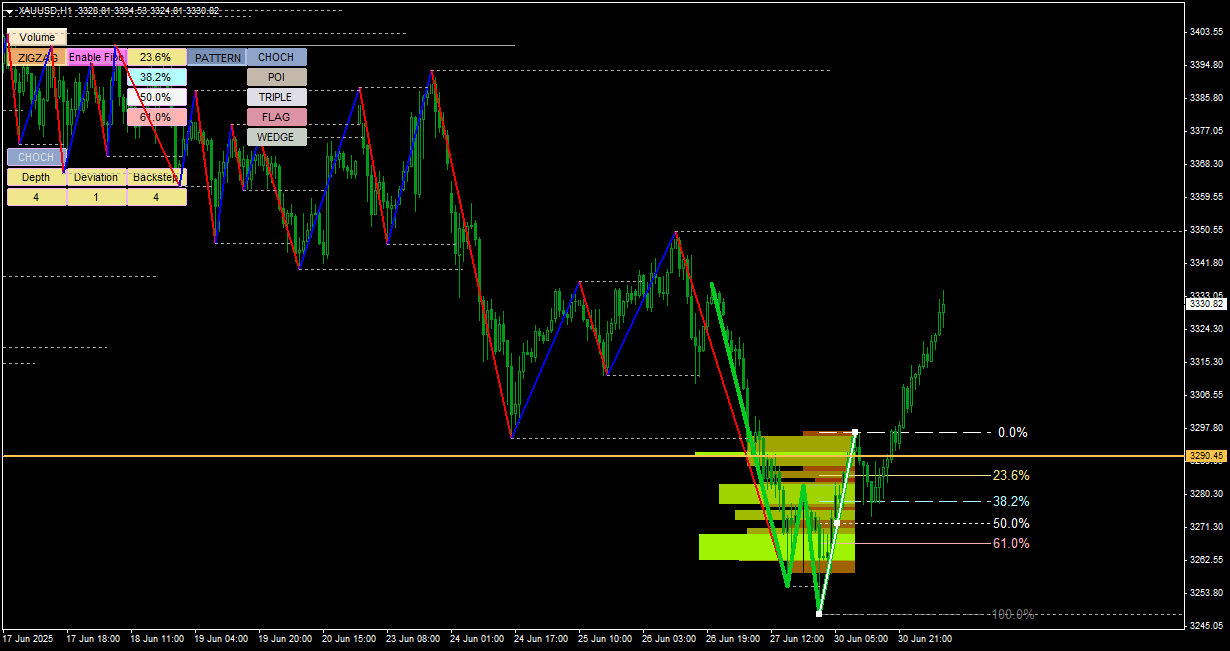
✅ How the Second Chart Validates the Strategy
In the updated chart:
✅ Price respected the 50% zone and reversed upward, triggering the planned buy entry.
🚀 The wedge pattern broke to the upside, confirming the structural breakout.
📈 A second CHoCH formed, reinforcing that bulls had regained control.
🎯 Price reached the 61.8% target zone and was pushing toward extended Fibonacci projections (e.g. -100%).

Description: Elevate your chart analysis with this advanced indicator that seamlessly integrates Zigzag structures, Fibonacci retracements, and Volume Profile insights. Designed for traders who seek clarity and precision, this tool visually identifies high-probability price patterns and market turning points. Whether you're tracking CHOCH shifts, pinpointing POIs, or analyzing TRIPLE tops and FLAG formations, this indicator offers the depth and flexibility to adapt to any trading strategy


